
Analyzing the strategic financial management decisions of Nestle for last 5 years
Question
Task: Explain the industry under which the company operates and the strategic trends experienced in the past 5 years. Discuss the company growth and financial strategy.Evaluate various mergers and acquisitions strategy options and apply the concept of shareholder value creation and divestitures.By applying financial theories, critically analyse and measure the risk and financial performance (apply advanced financial tools in your answer). Your explanations should converge on your insights regarding how the risk assessment impacts the corporate strategy.Based on financial risk models and theories, explain your advice to the company in terms of how it will measure and manage risk. Your advice should incorporate alignment of your suggested risk management advice to the corporate strategy.Based on the case study company you have selected, critically analyse the financial performance of the company.
Answer
Background
Nestle is a global company in the food processing industry dealing in various kinds of products under twenty-nine brands. The company was founded in the year 1866 by Henri Nestle in Cham, Switzerland as Anglo-Swiss Condensed Milk Organization.The company operates in 198 countries with 447 factories and is among one of the largest food companies in the world(Nestle, 2022). The headquarters of the company is located in Vevey, Vaud, Switzerland. Since its incorporation, the company has continuously been acquiring companies and also creating its own products under different brand names. The company was able to grow and capture a large share of the market during World War I which flourished more during World war II. The company's 43% of sales come from America, 28% from Europe and 29% from Africa, Oceania and Asia.
Recent Five-Year Developments:
2017: The Company introduced a new infant formula for its baby products in Spain that contained two human milk Oligosaccharides, which is the best formula as an alternative to breastmilk and has numerous health benefits. The company also acquired a major stake of about 68% in Blue Bottle Coffee with an expectation of an increase in sales by 70% after the acquisition(Nestle Global, 2017). It also made an agreement to acquire a California-based company named Sweet Earth which is a producer of plant-based foods.
2018: The Company publicized the introduction of the Nestle Alumni System through the premeditated association with Enterprise Alumni and SAP to engross over one million alumni internationally.
2019: The organization proclaimed that Nestle would issue Nutri-Score on all of its items vended in the European nations which assisted the nutritious brand.
2020: Canada’s Nestle and USA’s Nestle ice cream segments were assimilated by Froneri. The company similarly proclaimed its inclination to capitalize on plant-based nutrition opening with meat-free products and tuna salad to reach and engage vegan and younger consumers.
2021: The Company publicized that it trades its water brands in Canada and the USA to One Rock Capital Partners and Metropoulos& Co. Water brands sale was anticipated to end in springtime and will encompass the mountain, purified water brand and spring water brand and the distribution facility. This strategy did not encompass the AcquaPanna and Perrier, S. Pellegrino varieties in initial April 2021, and the trade was settled(Ellison, 2021).
The Covid19 virus did not have a negative impact on Nestle. Owing to lockdowns, individuals purchased more packaged food items not only dairy and coffee merchandise but also pet items which amplified the sales of the corporation (Neo, 2021). The company, therefore, attained its sturdiest quarterly sales growth in 2021 in ten years. This year the company also settled to buy Bountiful Company, a vitamin manufacturing entity previously recognized as The Nature's Bound Co for $5.75 billion, observing the abundance of the entity's development in the quartier arrived from minerals, vitamins and supplements which assist immune system and health. The transaction acquired several assets from the Bountiful Company encompassing Solgar, Bounty, Puritan’s Pride and Osteo Bi-Flex. The crucial element behind the growth of the company during this period was innovation and versatility to deal with unprecedented situations (Askew, 2021).
Mergers and Acquisition and Shareholder Value Creation
The company’s mergers and acquisition policies are disciplined as they focus to protect Return on Invested Capital.
In the last five years, the company acquired Blue Bottle Coffee and Sweet earth in the year 2017.
In 2018, it sold off its US Confectionary business to Ferrara Candy Company and struck a deal with Starbucks for a distribution channel worth $ 7.5 billion. It also announced the sale of Gerber Life Insurance for $ 1.55 billion(Doering, 2021).
In 2020 the company announced the division of the ice cream section of Nestle USA and Nestle Canada.
In 2021, the company announced the sale of its water brands to One Rock Capital Partners and Metropoulos& Co. in the Us and Canada. It also acquired the company Nature’s Bounty, a vitamin manufacturing company(Nunes, 2022).
In 2022, Nestle acquired Brazilian Natural, Organic and plant-based food makers.
Financial Performance
The company's financial performance has not been steady over the past recent year as the competition is increasing the company's revenue has declined over the recent two years. The company recorded the highest sale in the year 2019 CHF 921,568 million which decreased to CHF 84,343 million in 2020 and has improved slightly in 2021 to CHF 87,088 million(Nestle, 2021). The company's net profits have increased constantly though the sales revenue decreased as the company has been able to manage its costs efficiently the net profit margins have been increasing.
Though the company is investing in companies through acquisitions and disinvesting through disposals but it has also faced may inherent risks and their effects due to such activities:
(i) Due to cost inflation and pricing actions the company’s underlying operating profits decreased by 30 basis points and gross margin decreased by 130 basis points in the year 2021. These are inherent risks which are associated with acquisitions in different countries, inflation, currency exchange risks which cannot be avoided.
(ii) The trading operating profit decreased by 290 basis points due to impairment costs related to disposal of Wyeth business in the year 2021.
(iii) The Net divestitures decreased by 2.9% in 2021 due to Nestlé Waters North America, Yinlu and Herta transactions. The negative impact on sales from foreign exchange moderated to 1.3%.
Thus, by analyzing the key performance indicators, yearly trends and inherent risk factors we can say that the mergers and acquisitions done by company are not always profitable, it may lead to adverse effects too.
Risk Analysis
At Nestle, the Audit Committee is in-charged of internal and external audits, internal controls, financial reporting, compliance and risk management. It is responsible to review reports regarding fraud, compliance, enterprise risk management and the Group’s annual risk assessment. The Enterprise Risk Management (ERM) framework established by the company is designed to asses risk and devises plans to mitigate its effects on the company’s long-term purpose and business strategy(Kumar, 2021). The company has devised a plan to carry on Top Down Approach once a year to identify principal risks and allocate resources to address them. The line management is responsible for assessing and mitigating actions and allocating a degree of materiality to the issues that arise for wider sustainability concerns(Deshmukh, 2022). The annual group risk assessment by line management is reported to the executive board and the executive board submits its report to Audit Committee.
Some principal risk factors identified are as follows:
Product Quality and Safety:Any major event may take place by any serious fault in product quality or safety non-compliance which may affect the brand’s reputation, loss of trust, litigations and penalties due to failure to meet regulatory requirements. Thus, the company needs to establish policies and control to ensure that products are of high quality and prevent health risks (Anjoran, 2020).
Climate Change:Due to extreme weather conditions there might occur a shortage of supply, transitional disruptions, water shortage or floods may cause major harm to the company’s production and supply chain(Folk, 2018). Thus, to mitigate the impact on operations cost the company should emphasis adopting practices that are favourable for the environment. Nestle’s Net Zero Road map to create sustainable work culture is a major step towards creating value, it shall also support the generation and regeneration of food systems, use recyclable and reusable packaging, etc to contribute to minimising climate change and its effects.
System, Security and Privacy: Every company faces threats of cyber-attack or failure of digital networks or internal systems which may disrupt activities but alsocause loss of data privacy, security and control. This may result in loss of customer's trust, litigations, penalties or fines. Thus, a contingency plan has to be made to protect the hardware and software of the organisation and a plan to guard against data security threats complying with the evolving regulatory landscape.
Strategic Investment Choices: Investment choices of the company vary over a time period due to many factors like technological changes, and geographic expansions. New business models, entry into new categories, etc. This may lead to broader exposure for the group and acceptance of higher return metrics and risk. This risk may be mitigated by making investment choices for the group aligned with their strategy and prioritising them on the basis of their potential to create value for a long-term period(Karlsson, 2018).
Business Transformation: There are always underlying risks associated with large-scale changes like mergers and acquisitions, restructuring, and undertaking management projects. The risk of failure to realise anticipated benefits, impairment loss, and resistance from employees is associated with these business transformation projects(Bradley, Jong and Walden, 2019). However, these risks can be mitigated by acquiring executive sponsorship aligned with the group's targets and appropriate levels of resources that will support smooth execution.
Non-Financial Corporate Governance:If a company fails to comply with non-financial reporting and performance they fail to meet shareholders' expectations. This results in a risk of adversely impacting the corporate reputation of brands and the company as a whole. Thus, to mitigate this type of risk the board needs to align non-financial reporting frameworks like TCFD, SASB, GRI, etc. set up a sustainability committee to comply with ESG strategy and other reporting frameworks.
Financial Analysis
Financial analysis helps us to understand the strengths of a business, how the company is performing and what is the risk associated with the company.
Capital Structure of the Company: The Company is financed by internal sources of finance and is more reliant on Equity for funding its assets and other ventures than on external sources like Debts. The Equity share capital of the company in 2021 was CHF 282 million, however, the retained reserve has also increased from CHF 76,812 million in 2020 to CHF 81,363 million in 2021 as the company reported a net profit of CHF 17,196 million. The company also utilizes its reserves to buy back shares from the open market.
The short-term financial debts of the company are also minimal about CHF 10,092 million in 2021 and CHF 12, 019 million in 2020. The company is regularly paying off its loan liabilities as and when they fall due hence the loan liabilities figures values are decreasing continuously. However, it also acquired fresh loans worth CHF 11,339 million for various investment purposes like the acquisition and purchase of assets.
Trend Analysis
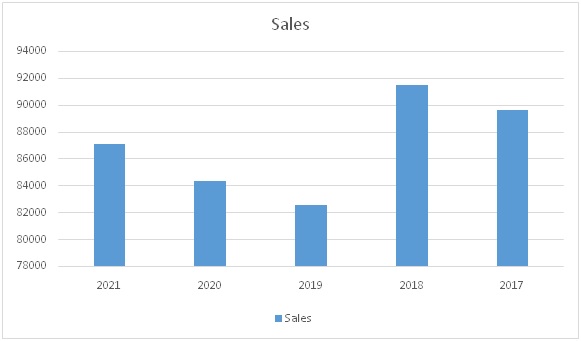
Figure 1: Sales of the firm
Source: (Self-Created)
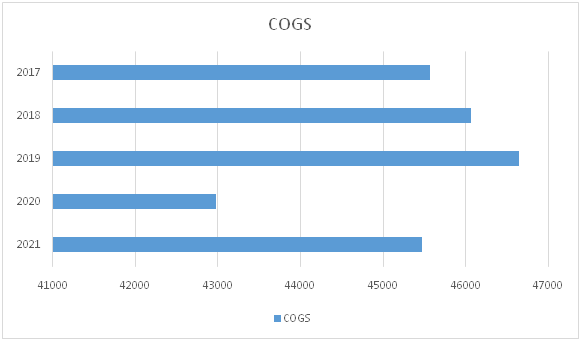
Figure 2: Cost of sales of the firm
Source: (Self-Created)
As we can evidently see the company’s expense on research and development has fallen down over the last five years. The company spent the highest CHF 1739 million in the year 2017 whereas the lowest was in the year 2020 CHF 1576 million as due to the pandemic the company's operations were restricted.
Company’s Cost Structure:
The company's cost of goods sold has been fluctuating over the recent five years, but we can conclude that the company is efficiently managing its cost and trying to decrease its costs of operations by devising an efficient system of purchase and also curbing down on other administration expenses. In the year 2021, the trading expenses were the highest in the last five years CHF 3,131 million as impairment expenses of CHF 2,093 million were included in it. The company’s other operating expenses are higher than other operating income in the year 2021.
Ratio Analysis for Five Years:
|
Ratios |
2021 |
2020 |
2019 |
2018 |
2017 |
|
|
Profitability |
||||||
|
Net Profit Margin |
Net income / Sales |
17196 /87088 |
12372 /84343 |
12904 / 92568 |
10468 /91439 |
7511/89590 |
|
19.75% |
14.67% |
13.94% |
11.45% |
8.38% |
||
|
Return on Capital Employed Ratio |
Net Profit after Taxes/ Gross Capital Employed * 100 |
17196 / 53727 |
12372 / 46514 |
12904 / 52862 |
10468 / 58403 |
7511/62229 |
|
32.01% |
26.60% |
24.41% |
17.92% |
12.07% |
||
|
Leverage |
||||||
|
Debt to Equity ratio |
Debt / Equity |
36482 / 53727 |
27928 / 46514 |
23132/ 52862 |
25700/ 58403 |
18566/62229 |
|
0.68 |
0.60 |
0.44 |
0.44 |
0.30 |
||
|
Times Interest Earned |
Earnings Before Interest and Taxes / Interest |
12159/953 |
14233/983 |
13674/1216 |
13789/2572 |
13277/3500 |
|
|
|
12.76 |
14.48 |
11.25 |
5.36 |
3.79 |
|
Liquidity |
||||||
|
Current Ratio |
Current Assets/ Current Liabilities |
39257 / 40020 |
34068 / 39722 |
35663 / 41615 |
41003 / 43303 |
31844/38189 |
|
0.98 |
0.86 |
0.86 |
0.95 |
0.83 |
||
|
Acid Test Ratio |
(Current Assets - Inventories - Prepaid expense/ Current Liabilities) |
(39257-11982-575) / 40020 |
(34068-10101-477) / 39722 |
(35663-9343-498) / 41615 |
(41003-9125-530) / 43303 |
(31844-9177-573)/38189 |
|
0.67 |
0.59 |
0.62 |
0.72 |
0.58 |
||
|
Efficiency |
||||||
|
Inventory Turnover |
Cost of Goods Sold / Average Inventory |
45468 / ((11982+10101)/2) |
42971 /((10101+9343)/2) |
46647 / ((9343+9125)/2) |
46070 / ((9125+9177)/2) |
45571/ ((9177 +8963)/2) |
|
4.12 |
4.42 |
5.05 |
5.03 |
5.02 |
||
|
Fixed Asset Turnover |
Sales / Average Fixed Assets |
87088 /((99885+89960)/2) |
84343 /((89960+92277)/2) |
92568 / ((92277+96012)/2) |
91439 / ((96012+101326)/2) |
89590/ (101326+110279)/2) |
|
0.92 |
0.93 |
0.98 |
0.93 |
0.21 |
||
The company's profitability increased over the recent five years from 8.38% in the year 2017 to 19.75% in the year 2021. The return on equity has also increased over the years as the profits are increasing, in the year 2021 the return was highest at 32.01% which must have satisfied the shareholders and will help the company to attract new investors.
Nestle is an Equity oriented company, it trellises more on internal funds than on debts or other financial liabilities to finance its operations. The debt-equity ratio of the company in 2017 was 0.30 times but to benefit from the effect of financial leverage the company is trying to increase its debt funds in a minimal manner, the debt-equity ratio in the last audited financial year of 2021 was 0.68 times. As the company is earning high profits and does not possess a large number of debts, therefore its interest obligations are also low and easily paid off with the net profit earned each year. The Times Interest Earned ratio has rose from 3.79 times in 2017 to 12.76 times in 2021.
The company's liquidity position is quite risky, Though the company is continuously trying to improve its current ratio still it is below standard, Every company in general is expected to have twice the amount of current assets in its capital structure to the current liabilities as it can easily pay off obligations and grab any opportunity by liquidating the current assets. The company has not been able to meet the standard in any year, still, we can say they are on the right track as the current ratio has improved from 0.83 times in 2017 to 0.98 times in 2021.
Efficiency ratios help to determine how well the company is using its resources to boost sales. The inventory turnover ratio of the company has though decreased over the period of five years from 5.02 times in 2017 to 4.12 times in 2021 but is still maintained at a good rate which signifies that inventories are converted into sales rapidly. The Fixed asset turnover ratio of the company has majorly improved from 0.21 times in 2017 to 0.92 times in 2021.
Stock Wealth Analysis
(i) Average Yearly Returns of last five years
The company has been growing significantly though the sales have declined as the number of market players have increased. The management of the company has been continuously trying to increase its returns to satisfy their shareholders thus, they have decreased their operating cost expenses to deliver higher profits.
Return on Equity:
|
2021 |
2020 |
2019 |
2018 |
2017 |
|
32% |
26% |
24% |
18% |
12% |
Thus, it is clearly evident that despite fall in revenue the management is trying to deliver higher returns to attract more investments.
(ii) Market Value Added: Market Value of Shares – Book Value of shareholder’s equity
Market Value of Shares: CHF 351,682 million (Annual report, 2021)
Book Value of Shares: CHF 53,140 million
Therefore, Market Value Added = CHF (351,682 – 53,140) million
= CHF 298,542 Million
(iii) Estimation of Cost of Capital:
Equity / (Equity + Debt) * Cost of Equity + Debt / (Equity + Debt) * Cost of Debt * (1- Tax Rate)
Cost of Equity = Risk Free Return +(Market Return – Risk Free Return) * Beta
10 Year’s Treasury Bond = 3.5% (U.S. Market)
Beta = 0.77 (Infrontanalytics.com)
Market Return = 19.47%
Therefore Cost of Equity = 3.5% + (19.47 – 3.5)*0.77
= 15.79%
Cost of Debt = Interest / Debt * (1- Tax)
= (953/36482)* (1- .209)
= 2.06 %
Therefore, Cost of Capital = 15.79 * 53727 /(53727+36482) + 2.06* (36482 /(53727+36482))
= 10.22 %
Valuation Perspectives
(i) Economic Value Added = Net Profit After Taxes – (Invested Capital * Cost of Capital)
Net Profit After Taxes = CHF 17,196 million
Invested Capital = CHF 90,209 Million
Cost of Capital = 10.22%
Therefore, Economic Value Added = 17,196 – (90,209 * 10.22%)
= CHF 7,977 million
(ii) Equity Spread: Beginning Stockholder’s Equity * (Return on Equity – Cost of Equity)
Beginning Stockholder’s Equity = CHF 46,514 million
Return on Equity = 32.01%
Cost of Equity = 15.79%
Therefore Equity Spread = 46514 * (32.01-15.79)
= CHF 7,544.57 million
(iii) Discounted Cash Flow Method
Here, we will discount the after tax operating cash flows to get its present value with the help of discounting factor. The Cost of Capital calculated above will be taken as discounting factor for our calculations: 10.22%
The Operating cash flows of last five years from 2017 to 201 has been taken from its cash flow statement. As the discount factor is net of tax thus, the cash flows taken are also net of tax. Alternatively The profits after tax can also be taken for calculating the valuation ogf the firm. Both the approaches are calculated below.
Valuation as per Operating Cash Flow:
|
Year |
Operating Cash Flow |
Interest Factor @ 10.22% |
Present Value |
|
2017 |
14199 |
0.907 |
12882.42 |
|
2018 |
15398 |
0.823 |
12674.87 |
|
2019 |
15850 |
0.747 |
11837.17 |
|
2020 |
14377 |
0.678 |
9741.52 |
|
2021 |
13864 |
0.615 |
8522.88 |
|
CHF |
55658.86 |
Valuation as per Net Profits:
|
Year |
Operating Cash Flow |
Interest Factor @ 10.22% |
Present Value |
|
2017 |
17196 |
0.907 |
15601.52 |
|
2018 |
12372 |
0.823 |
10184.02 |
|
2019 |
12904 |
0.747 |
9637.03 |
|
2020 |
10468 |
0.678 |
7092.87 |
|
2021 |
7511 |
0.615 |
4617.38 |
|
CHF |
47132.82 |
After calculating the valuation of the company by all three methods we can say that the company’s market valuation is higher than its book values. This is an indicator of company’s growth and strong market share. Most of the values have been taken from audited financial statements of the company but where the data was not available we have taken help from different reliable sources to get the values and perform our calculations. The sources of information from outside are mentioned with them.
Conclusion
After performing the financial analysis of the company thoroughly from all the parameters we have gained a deep insight of the company’s financial structure. Some points that we discovered about the company’s strategy and its alignment with corporate performance are as follows:
(i) The company has been earning huge profits each year despite of decrease in its sales revenue. This was possible due to company’s efficient cost structure, the management has been continuously working on decreasing its cost of goods sold, administration cost, selling and distribution cost, Finance expense or other trading expense. The company steadily maintain its spend on research and development so that it can innovate new products and get better access to new markets. The company net profit margin has increased greatly over the past five years as we have assessed. This helped the company to keep their shareholders satisfied by providing large dividends and higher returns on equity. Thus, with successful planning of strategy to control costs the company boosted its corporate performance.
(ii) The company’s liquidity position is risky as it does not possess large working capital that can pay off the current obligations smoothly. The company has to improve its operating cycle so that stocks are readily converted into cash and receivables are collected quickly to pay off the current obligations as and when they fall due. Hence we would like the company to devise a mechanism of efficient debt collection by deploying factoring or other methods and keep a check on their inventory too avoid situation of dead stocks. These techniques will not all strategically improve its liquidity position but will also help to boost its operational efficiency.
(iii) The company is slowly increasing its debt capital to benefit from leverage effect. The company’s strategy to increase finance cost to benefit from tax saving on net profits is an effective way to increase company’s wealth. But, we would like to advise the company to include debts up to a certain limit which will not affect its financial position as if the company transforms into a debt oriented company from equity oriented company it will harm its risk appetite. The Company will face problems in raising further finance from financial institutions or new investors as a company’s whose Debts are larger than Equity are considered to be highly risky and this proposition will not align with its strategy to grow larger as a brand.
(iv) The company’s valuation are quiet impressive as by the results of all methods and techniques we could infer that the company is adding to its value in the market and earning higher returns than the cost of its capital. Thus, as the market capitalization is quiet high as compared to book values it easy for a company to arrange finance.
Thus, by using the financial evaluation theories like Economic Value Added, Market Value added, etc. we can certainly conclude that the company is performing efficiently and is safe from an investor’s point of view to invest and enjoy great returns in future. The company’s diversification in products and strong supply chain worldwide are the main factors of its phenomenal success and great market share.
Reference
Anjoran, R. (2020). Why Product Safety, Quality, and Reliability Are Tightly Linked. [online] QualityInspection.org. Available at: https://qualityinspection.org/product-safety-quality-reliability-tightly-linked/ [Accessed 16 Jan. 2023].
Askew, K. (2021).Nestlé brews strong coffee growth as COVID serves ‘improved’ category dynamics. [online] foodnavigator.com. Available at: https://www.foodnavigator.com/Article/2021/08/03/Nestle-brews-strong-coffee-growth-as-COVID-serves-improved-category-dynamics [Accessed 16 Jan. 2023].
Bradley, C., Jong, M. de and Walden, W. (2019).The ‘all in’ approach to business transformation | McKinsey. [online] www.mckinsey.com. Available at: https://www.mckinsey.com/capabilities/strategy-and-corporate-finance/our-insights/why-your-next-transformation-should-be-all-in [Accessed 16 Jan. 2023].
Deshmukh, R. (2022). Nestle’s Marketing Strategy of Expertise in Nutrition. [online] The Strategy Story. Available at: https://thestrategystory.com/2022/01/16/nestle-marketing-strategy/ [Accessed 16 Jan. 2023].
Doering, C. (2021). Let’s make a deal: How Nestlé is using M&A and multibillion-dollar divestitures to shape its portfolio. [online] Food Dive. Available at: https://www.fooddive.com/news/lets-make-a-deal-how-nestle-is-using-ma-and-multibillion-dollar-divestit/593601/ [Accessed 16 Jan. 2023].
Ellison, G. (2021). Nestle water owners return Michigan permit, plan new withdrawal. [online] mlive. Available at: https://www.mlive.com/public-interest/2021/10/nestle-water-owners-return-michigan-permit-plan-new-withdrawal.html [Accessed 16 Jan. 2023].
Folk, E. (2018).- How Climate Change Will Affect Businesses - Renewable Energy Magazine, at the heart of clean energy journalism. [online] Renewable Energy Magazine, at the heart of clean energy journalism. Available at: https://www.renewableenergymagazine.com/emily-folk/how-climate-change-will-affect-businesses-20181109 [Accessed 16 Jan. 2023].
Karlsson, J. (2018). Support in Strategic Investment Decisions. [online] Diva Portal. Available at: https://www.diva-portal.org/smash/get/diva2:1265212/FULLTEXT02 [Accessed 16 Jan. 2023].
Kumar, S. (2021).Risk Management and Enterprise Risk Management. [online] ResearchGate. Available at: https://www.researchgate.net/publication/353444960_Risk_Management_and_Enterprise_Risk_Management [Accessed 16 Jan. 2023].
Neo, P. (2021). ‘Difficult economic environment’: Nestle sees slower growth in APAC despite positive China, India results. [online] foodnavigator-asia.com. Available at: https://www.foodnavigator-asia.com/Article/2021/08/02/Difficult-economic-environment-Nestle-sees-slower-growth-in-APAC-despite-positive-China-India-results [Accessed 16 Jan. 2023].
Nestle (2021). Annual Review 2021. [online] Nestle. Available at: https://www.nestle.com/sites/default/files/2022-03/2021-annual-review-en.pdf [Accessed 16 Jan. 2023].
Nestle (2022). About us. [online] Nestlé Global. Available at: https://www.nestle.com/about [Accessed 16 Jan. 2023].
Nestle Global (2017). Nestlé acquires majority interest in Blue Bottle Coffee. [online] Nestlé Global. Available at: https://www.nestle.com/media/pressreleases/allpressreleases/nestle-acquires-majority-interest-blue-bottle-coffee [Accessed 16 Jan. 2023].
Nunes, K. (2022). Nestle expanding global nutrition business with acquisition. [online] www.foodbusinessnews.net. Available at: https://www.foodbusinessnews.net/articles/21416-nestle-expanding-global-nutrition-business-with-acquisition [Accessed 16 Jan. 2023].
Quesada, H.J. (2019). Publication CNRE-43P. [online] Available at: https://vtechworks.lib.vt.edu/bitstream/handle/10919/93102/CNRE-43P.pdf [Accessed 16 Jan. 2023].


