Data Analysis Assignment Investment On The Market Of Furniture, Wood And Paper Of UK
Question
Task: The client is a business investor. This client has not invested in the UK wood, furniture and paper manufacturing sector before. The client wants you to analyse the data provided on UK wood, furniture and paper manufacturers, and to present the analysis as a business report of no more than 2,500 (excluding tables, charts and appendices). The report should help the client in their aim to better understand potential company performance in the UK wood, furniture and paper manufacturing sector, in order to target future investment. The client has requested the following from you:
The client requires you to provide:
- An analysis of the distribution of the profit rate across all companies in the data set.
- An analysis of the distribution of the profit rate, comparing the large and SME (small & medium sized) firms in the data set.
- An analysis of the distribution of the profit rate, comparing manufacturers in the data set by their export activity.
- An analysis of the distribution of Return on Capital Employed comparing large and SME manufacturers in the data set.
- An analysis of the export activity of the manufacturers in the data set against their size, measured by whether they are large or SME companies
- An analysis of the extent to which the profit rate across all manufacturers in the data set is associated with the other quantitative variables in the data set.
- An analysis of the extent to which the profit margin for manufacturers in the data set that can be predicted using the other quantitative variables in the data set.
Answer
Introduction
The study developed in the data analysis assignment report signifies that the investment in businesses has been found to be quite common as this helps in generating profits. Furthermore, this profits can be put together for making sold investment year after year (Leslie and Reimer, 2003). This allows in the development in the business stability and peace of mind. In this particular paper, a client is eager on investing on wood, paper and furniture manufacturing companies in the UK. However, it is very important to perform an analysis of the market through considering the data. After observing the data, it will help understand the potentiality of the market of the paper, furniture and wood sector so that it helps in targeting future investment.
Aim: The main aim of the case scenario explored in the segments of data analysis assignment is to analyze the market of furniture, wood and paper of UK to understand whether it is considered to be appropriate of the purpose of investment.
Objective
- To see the distribution of profit among the large firms and SMEs.
- To analyze the return in capital employed among the SMEs and large firms.
What is the role of analyzing of the profit rate distribution across the companies in the context of data analysis assignment?
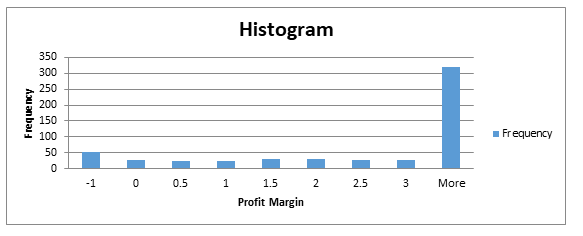
The distribution of the profit rate is considered to be quite important as this is going to help in understanding the amount of profit margin that the company is going to incur once entering the market. For the analysis of the profit rate across the companies, the profit margin data has been considered. Histogram is an ideal statistics measure for evaluating the profit rate distribution. The histogram allows in getting a summary of the data (Gazo and Quesada, 2005). Through the histogram, the mean value could be derived for assessing the maximum and the minimum value of the data. It also helps in understanding the trends in the data. The profit margin has been calculated and was found to be more the 3% in most of the cases. Even descriptive statistics has been used to evaluate the profit margin (Chambers, 2017). The average profit margin in the sector of furniture, wood and paper industry was 5%. Even the maximum profit that can be incurred from the data is 47.82 % and minimum amount that can be incurred is -13.08%. From the descriptive statistics, a detailed summary of the variable can be easily to be available. The skewness of the data is 1.6 and that is greater than 1 so the data implies that it is highly skewed. Since there exist positive skewness so it can be said that the distribution in skewed to the right. Even the mean is to the right of the skewness. This is the reason taking average is not the optimal when considering profit in case of furniture, wood and paper sector (Lihra, Buehlmann and Graf, 2012). The value of kurtosis measures the curve steepness and a positive value of 6.4 shows that the distribution ha a heavier tails than that of the normal distribution.
Analysis of the profit rate distribution comparing the SME and large firms
For analyzing the profit rate distribution with the help with the large and SME firms cross tab evaluation and t-test has been performed. The use of the cross tabulation statistical tool is considered to be important in analyzing the relationship between a numbers of variables (Schabenberger and Gotway, 2017). The main reason mentioned in the data analysis assignment for which the cross tabulation is preferred is because this allows the researcher to get a granular and profound insight about the data. It allows in providing insights of the categorical variables from cross tabulation would be not possible to derive by digging into the set as a whole (Korolev, et al., 2017). From the cross tabulation, it was found that among 83 large manufacturing enterprise most of their profit margin was in the range -0.1 to 9.9 and there was only 1 large enterprise that incurred profit margin between 39.9% to 49.9% (Hitchens, et al., 2003). In case of the small enterprises, it was found that 310 SMEs were found to be having a profit margin of -0.1 to 9.9%, 57 of them had a profit range leases than 0.1%. Only 11 of them were found were found to have a profit margin of 19.9% to 29.9%. From the comparative analysis performed herein data analysis assignment, using the cross tabulation data it was found that that higher number of SME and large firms were found to incur profit margin of -0.1 to 9.9% *( Ranganathan, Pramesh, and Aggarwal, 2017).
A t- test can be performed to test the hypothesis as follows:
H0: There is an impact of the profit rate on large and SME firms
H1: There is no impact of the profit rate on the large and SM firms.
The t test is considered as inferential statistic and is utilized for determining if there lies any type of significant difference in the means of the two groups. From the hypothesis testing illustrated in this context of data analysis assignment it can be found that the value of p lies less than 0.05. The null hypothesis is thus rejected.
Analysis of the profit rate distribution, through comparing the data of the manufacturer with the export activity.
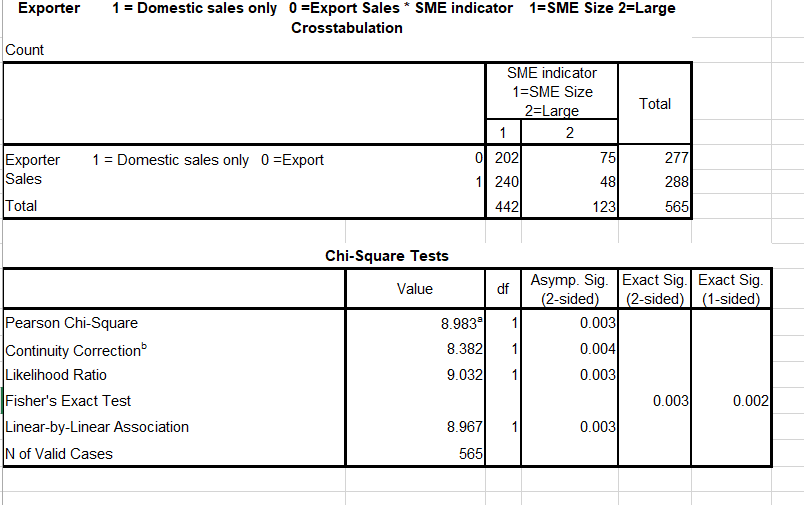
For making a comparison of the data of the manufacturer with the export activity can be done through the cross tabulation and chi square test. The quantitative research method like the cross tabulation is considered to be quite ideal for carrying out the relationship between two or variables (Silverman, 2018). Through cross tabulation, it is going to help in comparing and analyzing the results for one or more variables. From the comparison of the data on SME and Exporter `data, it can be found that SME size firms are found to be selling more domestically than that of the exports. On the contrary, it was found that the large sized firms they tend to sell their products domestically than exports. Through the overall analysis, it can be found that domestic sells are much higher than that of the exports in both the type of manufacturing units (Wormald and Evans, 2009).
To understand the association of the variable within this data analysis assignment, the chi-square test has been used. This helps on searching as whether there lies any type of relationship between the categorical variables (Law, 2015). The value of chi- square is 0.03. This shows the level of significance is less than 0.03. This implies that there is some degree of association between the exports and manufacturing units.
Analysis of Return on Capital Employed in comparison to SME and large manufacturers
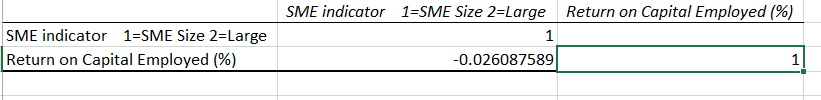
To understand the relationship between the return on the capital employed and type of manufacturers, the correlation test has been conducted for the research (AlManei, Salonitis, and Xu, 2017.). Correlation test is considered to be a statistical test to show whether the variables have a strong relationship or not. In most of the cases, it has been found the Pearson rank correlation is sued for understand the relationship between the terms. This type of statistical test is also considered as a bivariate analysis. Through this test the researcher is going to see that relation between the manufacturers are the return on capital employed. After the correlation test has been performed, the results was -0.02. The findings obtained in this section of data analysis assignment shows that there is a negative and low correlation of return on capital in comparison to the SME indicator.
Analysis of export activity of manufacturers in dataset with respect to size
Export activity of the manufacturers of paper and furniture sector also has a considerable degree of influence as to whether they are large or small in size. For this analysis on data analysis assignment, the correlation test has been performed to see whether the export activity is related to the size of the SME. A correlation helps in understand the relations of the export activity and the SME indicator (Cox, 2018). Before carrying out the correlation test, the data has been filtered for only export sales and that has been compared to SME indicator. The value of correlation analysis test is -0.12. The study developed in the data analysis assignment implies that there is a negative association of the export sales with that of the SME indicator (Blackburn, 2016.).
Analysis of the association of profit rate with other quantitative variables
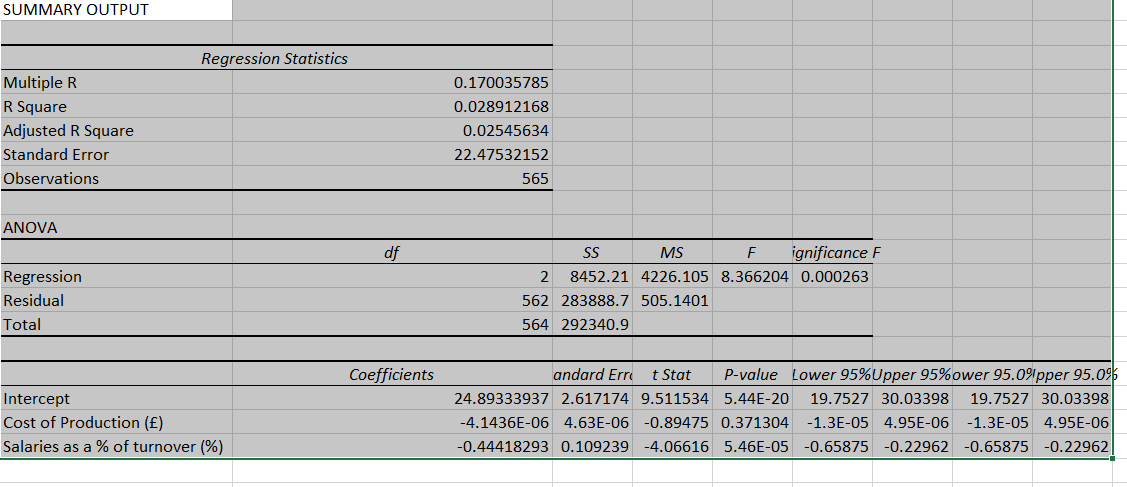
Profit rate also computed using the return on capital employed in a firm. To find the association of the profit rate with that of cost of production and salaries as a percentage of turnover. From the result of the regression analysis performed in the segment of data analysis assignment, it has been found that the value of significance is less than 0.05. This shows that the value of the regression is considered to be meaningful (Crowder, 2017). This shows that there is a positive association of cost of production and salaries as a percentage of turnover on the return of the capital employed.
Table 1: Regression analysis showing the impact of cost of production and salaries as a percentage of turnovers on the return on capital employed.
|
SUMMARY OUTPUT |
||||||||
|
Regression Statistics |
||||||||
|
Multiple R |
0.170035785 |
|||||||
|
R Square |
0.028912168 |
|||||||
|
Adjusted R Square |
0.02545634 |
|||||||
|
Standard Error |
22.47532152 |
|||||||
|
Observations |
565 |
|||||||
|
ANOVA |
||||||||
|
df |
SS |
MS |
F |
Significance F |
||||
|
Regression |
2 |
8452.21 |
4226.105 |
8.366204 |
0.000263 |
|||
|
Residual |
562 |
283888.7 |
505.1401 |
|||||
|
Total |
564 |
292340.9 |
||||||
|
Coefficients |
Standard Error |
t Stat |
P-value |
Lower 95% |
Upper 95% |
Lower 95.0% |
Upper 95.0% |
|
|
Intercept |
24.89333937 |
2.617174 |
9.511534 |
5.44E-20 |
19.7527 |
30.03398 |
19.7527 |
30.03398 |
|
Cost of Production (£) |
-4.1436E-06 |
4.63E-06 |
-0.89475 |
0.371304 |
-1.3E-05 |
4.95E-06 |
-1.3E-05 |
4.95E-06 |
|
Salaries as a % of turnover (%) |
-0.44418293 |
0.109239 |
-4.06616 |
5.46E-05 |
-0.65875 |
-0.22962 |
-0.65875 |
-0.22962 |
Analysis between the profit margin and quantitative variable
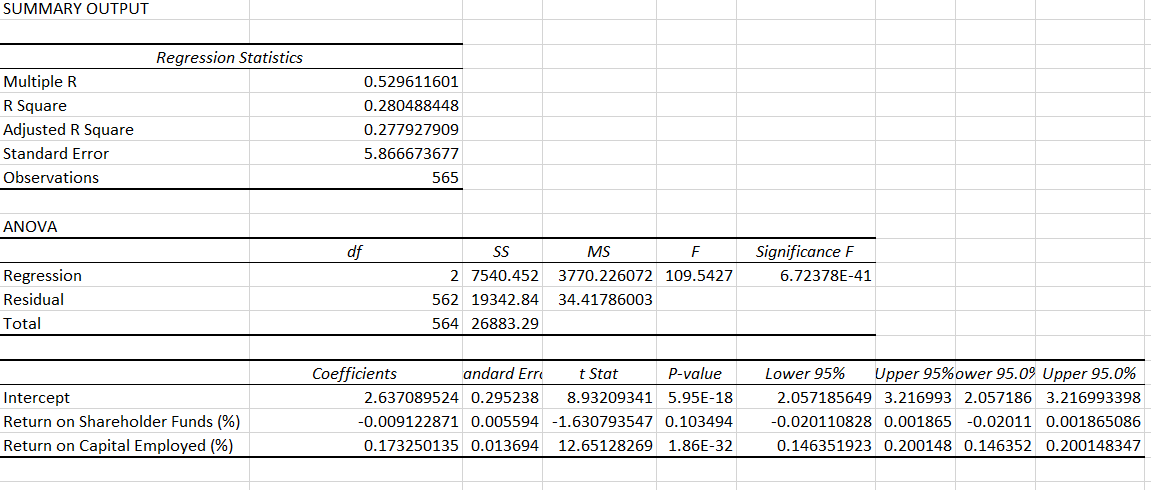
The data analysis assignment signifies the regression analysis which is considered to be an ideal test for carrying out prediction. It helps in analysis the impact that independent variables can have on the dependent variable. In this particular analysis, it has been the impact that different quantitative variables can have on the dependent variable i.e. the profit margin (Bain, 2017). There are a number of factors that are working in an organization and that has an effect on the profit margin. Some of the important factors that are considered are cost of production, return on the capital employed, number of employees employed, salaries as percentage of the turnover, return on shareholder funds. The impact of all these variables can be huge. In this analysis, it has been considered a relationship of the profit margin with that of the return on shareholder funds and capital employed. From the regression analysis performed in the context of data analysis assignment, it can have been found that the value of R square is 0.2. This shows that that 20% of the variation in the independent variables are able to explain the dependent variable. Even the value of significance in this model is 0.6 which is less than 0.05. Thus, the regression model concludes, that there is not much association of the return of shareholder fund and capital employed to that of the profit margins.
Table 1: Regression analysis: Impact of return on shareholder funds and capital employed on the profit margin in the context of data analysis assignment.
|
SUMMARY OUTPUT |
||||||||
|
Regression Statistics |
||||||||
|
Multiple R |
0.529611601 |
|||||||
|
R Square |
0.280488448 |
|||||||
|
Adjusted R Square |
0.277927909 |
|||||||
|
Standard Error |
5.866673677 |
|||||||
|
Observations |
565 |
|||||||
|
ANOVA |
||||||||
|
df |
SS |
MS |
F |
Significance F |
||||
|
Regression |
2 |
7540.452 |
3770.226072 |
109.5427 |
6.72378E-41 |
|||
|
Residual |
562 |
19342.84 |
34.41786003 |
|||||
|
Total |
564 |
26883.29 |
||||||
|
Coefficients |
Standard Error |
t Stat |
P-value |
Lower 95% |
Upper 95% |
Lower 95.0% |
Upper 95.0% |
|
|
Intercept |
2.637089524 |
0.295238 |
8.93209341 |
5.95E-18 |
2.057185649 |
3.216993 |
2.057186 |
3.216993398 |
|
Return on Shareholder Funds (%) |
-0.009122871 |
0.005594 |
-1.630793547 |
0.103494 |
-0.020110828 |
0.001865 |
-0.02011 |
0.001865086 |
|
Return on Capital Employed (%) |
0.173250135 |
0.013694 |
12.65128269 |
1.86E-32 |
0.146351923 |
0.200148 |
0.146352 |
0.200148347 |
Conclusion and recommendation
The overall analysis illustrated herein data analysis assignment has shown that the UK is one very developed nation and considering business opportunity is considered to be a very ideal aspect but it is important for looking into the market scenario prior to indulging in a particular business. Even in case of business in a sector like paper, furniture and wood it is important to consider the market situation and consider looking into the business situation prior entering in the market. Through the overall analysis done in the above sections of data analysis assignment, it has been found that profit margin is considerably high but it is skewed. An average profit margin is not always achieved in a business as a result there is a huge loss in terms of asset. A client on entering the sector as a large or an SME is highly likely to earn a profit margin of maximum 9.9%. . If the client wants to enter into the market as a manufacturer in the market it is important for him to sell the commodities in the domestic market as that is going to help the client to fetch a lot of profit. Type of SME indicators does not help in assuring that the return on capital employed is going to turn out to be positive. Even the type of export activity that a client engages in there will be a negative association with the size of the SME firm.
Reference
AlManei, M., Salonitis, K. and Xu, Y., 2017. Data analysis assignment Lean implementation frameworks: the challenges for SMEs.
Bain, L., 2017. Statistical analysis of reliability and life-testing models: theory and methods. Routledge.
Blackburn, R.A., 2016. Government, SMEs and entrepreneurship development: Policy, practice and challenges. Routledge.
Chambers, J.M., 2017. Graphical methods for data analysis: 0. Chapman and Hall/CRC.
Cox, D.R., 2018. Analysis of survival data. Chapman and Hall/CRC.
Crowder, M.J., 2017. Statistical analysis of reliability data. Routledge.
Gazo, R. and Quesada, H.J., 2005. A review of competitive strategies of furniture manufacturers. Forest Products Journal, 55(10), p.4.
Hitchens, D., Clausen, J., Trainor, M., Keil, M. and Thankappan, S., 2003. Competitiveness, environmental performance and management of SMEs. Greener Management International, pp.45-57.
Korolev, V.Y., Gorshenin, A.K., Gulev, S.K., Belyaev, K.P. and Grusho, A.A., 2017, July. Statistical analysis of precipitation events. Data analysis assignment In AIP Conference Proceedings (Vol. 1863, No. 1, p. 090011). AIP Publishing.
Law, A.M., 2015, December. Statistical analysis of simulation output data: the practical state of the art. In 2015 Winter Simulation Conference (WSC) (pp. 1810-1819). IEEE.
Leslie, D. and Reimer, S., 2003. Fashioning furniture: restructuring the furniture commodity chain. Area, 35(4), pp.427-437.
Lihra, T., Buehlmann, U. and Graf, R., 2012. Customer preferences for customized household furniture. Journal of Forest Economics, 18(2), pp.94-112.
Ranganathan, P., Pramesh, C.S. and Aggarwal, R., 2017. Common pitfalls in statistical analysis: Logistic regression. Perspectives in clinical research, 8(3), p.148.
Schabenberger, O. and Gotway, C.A., 2017. Statistical methods for spatial data analysis. Chapman and Hall/CRC.
Silverman, B.W., 2018. Density estimation for statistics and data analysis. Routledge.
Wormald, P.W. and Evans, M.A., 2009. The integration of industrial design capability within UK SMEs: the challenges, opportunities and benefits. Data analysis assignment International journal of product development, 9(4), pp.343-356.
Appendix
Part a
Part b
|
Count of SME indicator 1=SME Size 2=Large |
Column Labels |
||
|
Row Labels |
Large |
Small |
Grand Total |
|
<-0.1 |
21 |
57 |
78 |
|
-0.1-9.9 |
83 |
310 |
393 |
|
9.9-19.9 |
13 |
59 |
72 |
|
19.9-29.9 |
4 |
11 |
15 |
|
29.9-39.9 |
1 |
4 |
5 |
|
39.9-49.9 |
1 |
1 |
2 |
|
Grand Total |
123 |
442 |
565 |
Part c
Part d
Part e

Part f
Part g