
MBA Assignment: Use of Data Analysis and Problem Solving in Retail Industry
Question
Assessment Description
This is a group project. You will be provided with a dataset pertaining to the operations of a retail organisation. You need to analyse this data and present insights using a BI tool of your choice. Describe the current mode of operation, possible inefficiencies, available data and how this data may be used to provide efficiencies based on the concepts and techniques covered in the subject.
Answer
Introduction:With the immense growth, retail industry generates enormous data that can be used by marketers as the data demonstrates the hidden business patterns and insights of the customers (Hofmann & Klinkenberg, 2013). The data is used to identify the growth opportunities that businesses can gain and thus win competitive edge to sustain this ever-growing business market.
In the particular project of data analytics, the data that has been gathered from data.gov on the area of sales of retail sector has been analysed so that several details can be identified. The data analysis has been conducted with the use of tableau data analytics tool. Based on the acquired information and insights, recommendation has been provided in the particular paper.
Problem Background: In the South Australia, retail sector offers higher employment opportunities. It has been supported by available statistics that about 17 million people are employment in the specific industry. Retail sector in the SA witness’s extensive growth of sales especially in the month of November which increases upto 9.2% which is estimated as 6,055.2 Billion AUD.
Customer segmentation that are developed by the retail sector is more refined and the information are collected based on their purchasing pattern and recommendation program.(Chen, Chiang & Storey, 2012)To focus upon the customers’ needs and requirements a wide array of data from wide segments of customers is collected and data on business opportunities are gathered through consumers’ buying patterns as suggested by (Holsapple, Lee-Post, & Pakath, 2014).
9994 rows of sales data are included in the selected dataset with 20 different features such as Order Date, Oder ID, Shipping Mode, Shipping Date, Customer Name, Customer ID, City, State, Customer segment, Region, Postal Code, category, Product ID, Sub-Category, Sales amount, Product Name, Quantity ordered, Profit, and Discount offered on a particular order as suggested by (Evans & Lindner, 2012).
The key objectives of the particular project are listed as follows:
- To develop marketing and sales campaign, to attract the interest of the potential customers so that revenue of business can be increased through purchases
- To identify the link between the different aspects and parameters so that better cross sales of products can be acquired
Analysis and Outcomes:
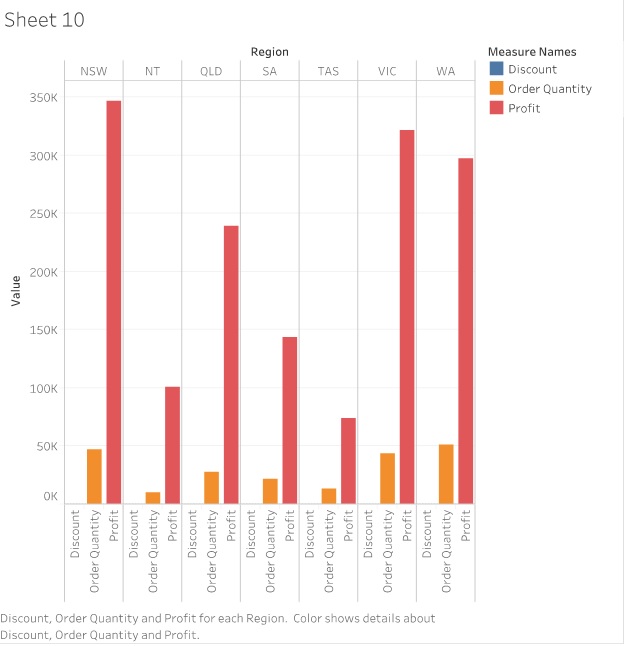
Profit gained through sales comparison in a particular region:
In respect to sales in different regions, West Region has achieved highest amount of sales followed by Central and Eastern regions.
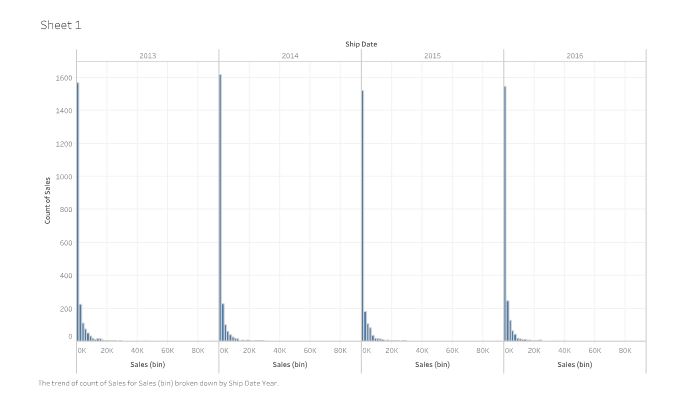
Figure: Comparative study on sales acquired in different year
In addition with the above graph, to collect good amount of information and data on the profit from the sales made in distinct regions worksheet below is developed alongside a dashboard in line with the work of (Shmueli, Bruce, Yahav, Patel, & Lichtendahl Jr, 2017).
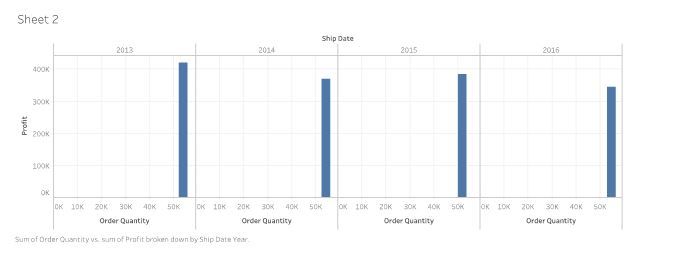
Figure: Comparative study on profit acquired in different year
From the analysis and study of both the presented dashboard analysis, it can be said that West region has acquired highest amount of profit in compliance with the maximum amount of sales in the particular region. Good amount of sales had generated maximum profits similarly in the East region too.
Profit through sales in the customer segment: Profit made through sales acquired by distinct regions have been demonstrated in the particular section of the paper.
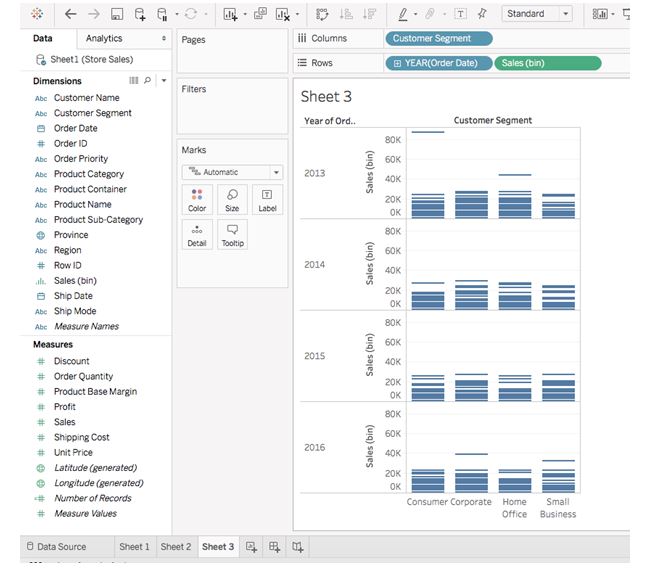
Figure: Comparative study on sales made in different regions in the consumer segment
From the three dashboards that have been demonstrated above that in all the segments, West regions witnesses highest number of customers. According to the number of customers as per their traffic different selected segments can be arranged as East, Central and South.
As per the region, sales made by different segments in the specific regions:
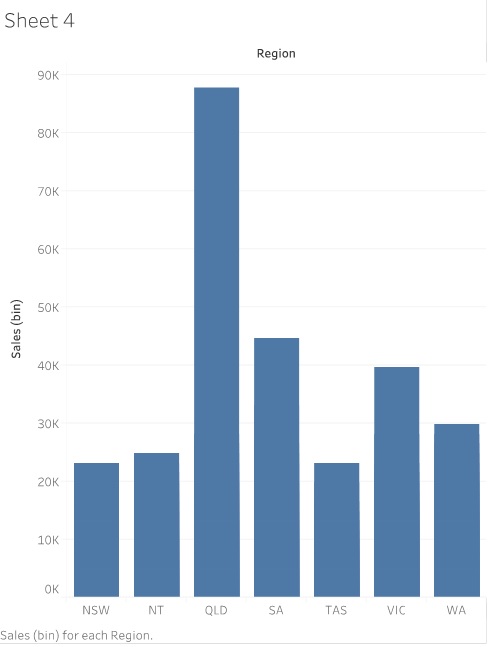
Figure: Sales comparison made in different regions
As demonstrated and explained in the previous section in terms of number of customers and sales based-data also shows the similar outcomes.
Comparative study on profit in different regions
Different regions are compared based on the profit and revenue collected from different customer segments and products.
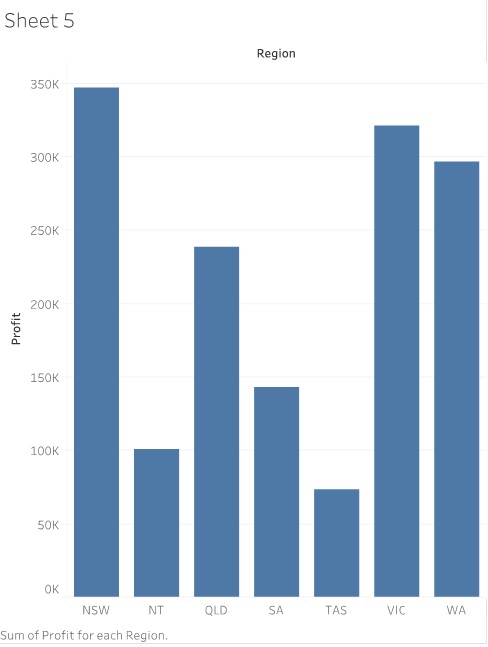
Figure: Comparative study on profit generated from different segments in the different regions
Highest profit generated from the corporate customer segment is from West region, which is followed by East region of the nation, gains second highest profit. In comparison with the official and home segment, highest amount of profit that is acquired from East region is distinct from the revenues from profits collected from the other two regions.
Difference in the shipping in different regions of the country
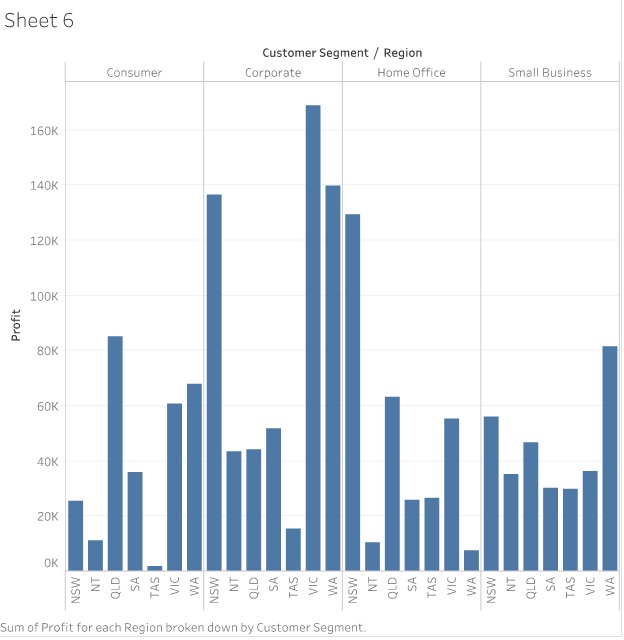
Figure: Comparison of profit gained by distinct segments in specific regions
Distribution in distinct regions have been demonstrating in the above dashboard in line with the work conducted by (Lim, Chen, & Chen, 2013). It is clearly evident form the above dashboard that West regions shows highest number of standard shipping of products.
The above demonstrated dashboard has been designed to identify sales gained by different cities in different regions. Major fifteen cities particularly in the central regions of the country, with the sales data has been demonstrated in the particular analysis are as below:
From the given table, highest amount sales have been found to be conducted in Victoria. Following outcomes and sales data is produced by the same analysis conducted including three regions.
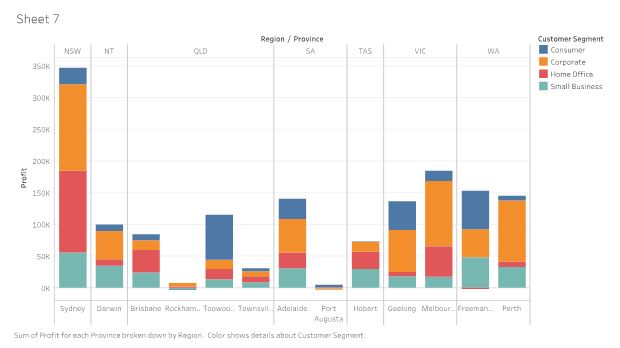
Difference in the shipping in different regions of the country
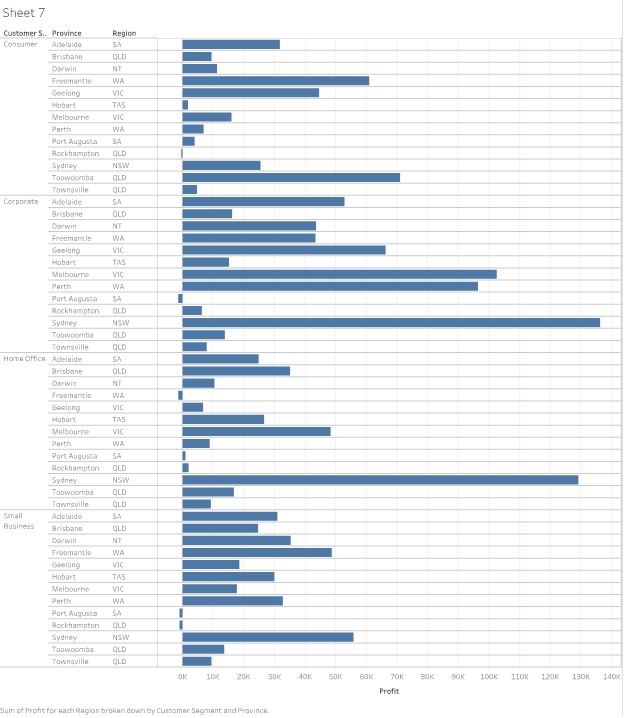
Figure: Comparative study of profit made by different region
It is demonstrated from the above dashboard that Australia has witnessed highest amount of sales in the entire NSW (New South Wales). Sales carried out in the top 12 cities have been demonstrated in the below table.
The following dashboard shows sales conducted in different cities of West regions:
Following table shows sales done in thirteen cities which again demonstrates that Sydney has recorded highest number of sales in the region.
Profit made by different managers: The below dashboard demonstrates profit accumulated by different managers or persons
In the respect of profit made by increased sales, discount plays very significant role as profit that a business organization makes decreases with the increasing amount of discounts on the services or products it offers and vice versa.
The dashboard below demonstrates amount of discount acquired for the different segregation of products.
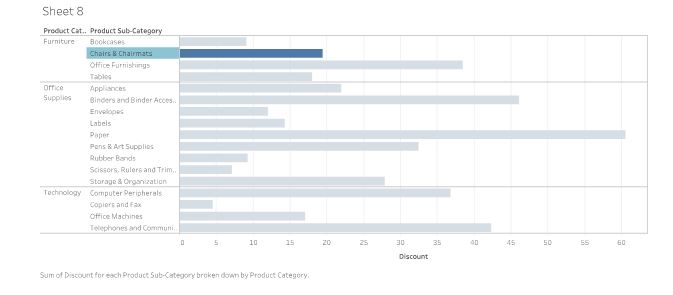
It is clearly shown in the above dashboard that maximum amount is given in the office supplies.
Followed by different data representation and comparative studies carried out in this particular paper, below dashboardhas been designed in order to identify the profit accumulated from distinct categories of products.
It can be commented here that highest amount of profit is generated from the Technology based products while the Furniture sector accumulates the lowest amount of profit. In reference to the comparative study that has been carried out above it can be commented here that discounts as given in Technology products leads to increased amount of profit through growing sales.
Comparative study on amount of profit based on discounts given in different states
Profit amount that is acquired from different states is demonstrated as below:
Above dashboard demonstrates profit amount made by different states of the country. It needs a mention that negative profit implies loss in the business. In the above dashboard that bar in brown colour demonstrate loss of business as they are going downward to the X axis in the respective states.
In line with the above two dashboards followed by their comparative study, it is evident that the major states expect NSW that provides high discount on their product have experienced negative profit that is the business organizations in all those cities have been witnessing loss. The states are Adelaide, Brisbane, Hobart, Melbourne, etc.
Recommendations to the business organization that have been experiencing negative profit or loss in their business operation
From the analysis sales data that is represented above a few recommendations have been provides which would enable the business organization improving from their present state of business.
- It is recommended to the business to offer discounts depending on varied customer segments and their tastes and likes so that the opportunity to convert a new customer to loyal customer can be achieved. It also has been found that business organizations can offer discounts to their customer within an aim to develop their revenue for both home and corporate office category.
- Different conditions on different discounts is an efficient strategy to enhance business performance. For instance, organization can fix minimum base price so that the profit can be availed. The organization thus would be able to offer discounts to it consumers where much reduction in product profit is not required.
Conclusion: Since retail industry is aggressively developing the efficacy to minimise resistance on operating business while fulfilling clients’ needs and preferences has never been so essential. Adequate information needed to progress the business through customer satisfaction further enhance organizational opportunity to win competition. Every interaction that a business has with its customer has potential influence on its existing as well as possible customers’ dealings. With adequate knowledge on the customers buying patterns the business organizations can focus upon the segments that are popular to the customers.
References: Chen, H., Chiang, R., & Storey, V. (2012). Business intelligence and analytics: from big data to big impact. MIS quarterly,.
Evans, J., & Lindner, C. (2012). Business analytics: the next frontier for decision sciences. Decision Line,, 43(2), 4-6.
Hofmann, M., &Klinkenberg, R. (2013). RapidMiner: Data mining use cases and business analytics applications. . CRC Press.
Holsapple, C., Lee-Post, A., &Pakath, R. (2014). A unified foundation for business analytics. Decision Support Systems, 64(5), 130-141.
Lim, E., Chen, H., & Chen, G. (2013). Business intelligence and analytics: Research directions. .ACM Transactions on Management Information Systems (TMIS),, 3(4), 17.
Shmueli, G., Bruce, P., Yahav, I., Patel, N., &Lichtendahl Jr, K. (2017). Data mining for business analytics: concepts, techniques, and applications in R. . John Wiley & Sons.


