
Quantitative Analysis Assignment: Valuation Of A Survey
Question
Task:A sociologist theorised that people who watch television frequently are exposed to many commercials, which in turn lead them to buy these goods, resulting in increasing debt. To test this belief, a researcher plans to survey a sample of families across the country.
Part 1: Briefly explain
- What type of survey method could the researcher use and why?
- What sampling method could the researcher use to select his/her sample and why?
- What are the variables the researcher should consider collecting data for the purpose of the analysis and why?
- Identify the data type(s) for the variables mentioned in part (c).
- What kind of issues the researcher may face in this data collection?
Part 2: First, the researcher wishes to use the graphical descriptive methods and numerical descriptive mesures to present the data for the two variables.
- He decides to use 10 classe intervals, such as 0
- Using appropriate BIN values, draw two histograms for the two variables.
- Present a numerical summary output results for the data on the two variables the researcher has considered by including the summary measures, mean, median, variance, standard deviation, range, smallest and largest values and the three quartiles, for each variable.
- Based on your histograms in part (b) and descriptive summary measures in part (c), comment on the skewness of the distribution of the two variables.
Part 3: Second, the researcher wishes to investigate the association between the two variables.
- Explain what could be the independent variable (X) and the dependent variable (Y).
- Using Excel, compute the numerical measure that provides information about the direction and strength of the linear relationship between the Total debt and TV hours. Interpret this value.
- Using an appropriate plot, investigate the relationship between Total debt and TV hours. On the same plot, fit a linear trend line.
- Display the regression summary table. Using the summary results, estimate the Least Squares Regression equation and interpret the intercept and slope coefficient estimates of the estimated linear regression model.
- Interpret the value of the coefficient of determination, R-squared (R2).
- Using the regression summary output table, conduct a hypothesis testing to conclude whether there is a linear relationship between Total debt and TV hours. use a=.5
Part 4
- Based on your answers above, write a summary report about the findings of the study conducted by this researcher .
Answer
Part 1
a) The most appropriate survey method in this case of quantitative analysis assignment would be online survey since it would ensure higher geographical reach at a low cost. Since samples are to be collected from across the country, face to face survey would be highly time consuming and costly. Further, the questions are also close ended which do not require much interpretation (Flick. 2015).
b) The appropriate sampling method would be stratified random sampling. This would ensure that the sample would contain all pivotal attributes which could impact TV viewing and hence ensure a faithful representation of the underlying population of interest (Hillier, 2016).
c) The researcher should intend to collect data regarding the following two variables
- Average TV watching in a specified period (Day or week)
- Debt level (individual or family)
d) Both the variables highlighted above would have numerical or quantitative data with the relevant data measurement scale being interval. This is because for both the variables an absolute zero is defined and negative value cannot be assumed (Medhi, 2015).
e) Certain issues that the researcher may face during the collection of data are as follows (Flick, 2015).
- Inaccurate data on the part of respondents particularly with regards to watching TV as the hours would be based on rough estimate
- Some of the sample members may not respond thereby leading to a biased sample response.
- Some of the responses may be incomplete or have error and the same would have to be cleaned.
PART 2
a) In order to decide on the number of classes as 10, the researcher would have taken two aspects into consideration which are the range of the underlying variable and the distribution of values in the range. Considering the range, a rough idea of the desired classes may be brought about but a more accurate estimate would consider the distribution of value since too large class sizes may result in a high amount of observations belonging to a particular class which is not advisable (Hillier, 2016).
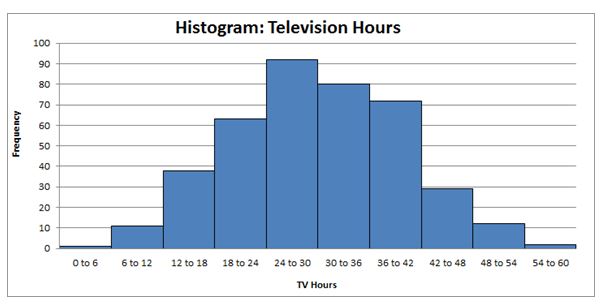
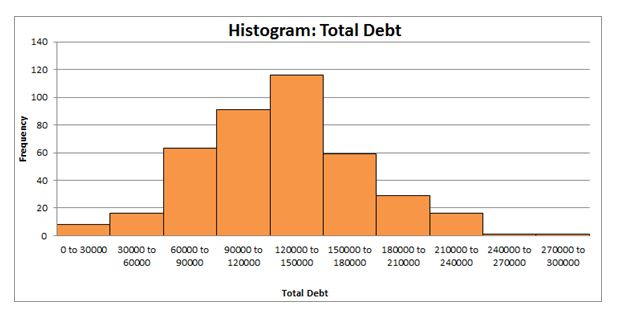
b) The requisite histograms are highlighted as follows.
c) The numerical summary for the selected variables is indicated as follows.
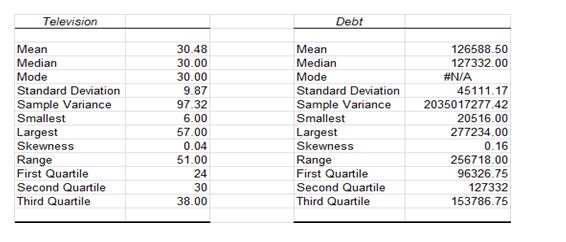
d) In relation to television hours, it is apparent that the mean is higher than the median by a slight amount which indicates that some amount of positive skew is present owing to families having very high TV viewing weekly hours. In relation to total debt, it is apparent in this quantitative analysis assignment that the mean is lower than the median by a small amount which indicates that some negative skew is present whereby there are families which tend to have very low debt levels compared to average (Medhi, 2015).
Part 3
(a) The independent variable would be the weekly hours of TV watching while the dependent variable would be the debt level. This is because of the relationship that the sociologist wishes to explore where hours watching TV tends to impact the underlying debt level. Hence, the duration of TV viewing impacts the level of debt.
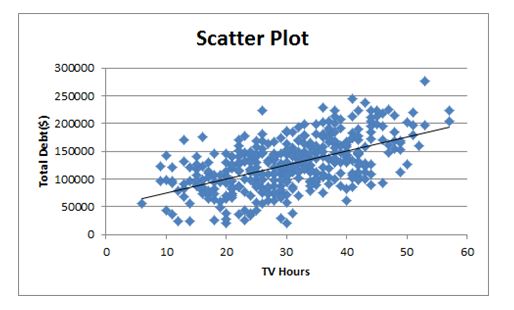
(b) The correlation coefficient between Total debt and TV hours is 0.55. The positive value is indicative of a positive relationship between the TV hours and Total Debt which would move in the same direction. Further, the magnitude of 0.55 indicates moderate strength of relationship between the variables provided (Flick, 2015).
(c) The relevant scatter plot along with trend line is depicted as follows.
(d) The regression summary table is reflected as follows
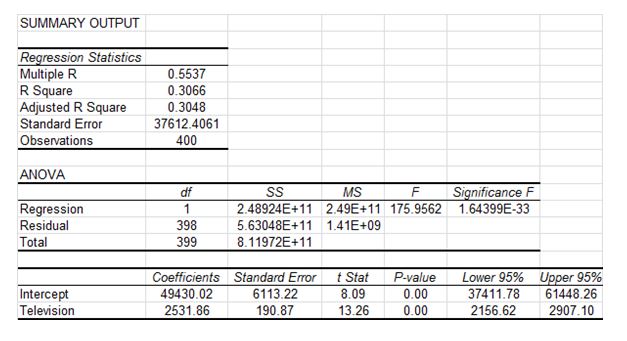
The regression equation is highlighted below.
Total Debt ($) = 49430.02 + 2531.86* TV Hours
The intercept value is $ 49,430.02. This implies that even if the TV hours viewed by the family per week is zero, still the total debt would $ 49,439.02 on an average.
The slope value is 2531.86. It implies that with a change in TV hours viewing per week by one hour, the total debt of the family would change by $ 2,531.86 in the same direction (Hillier, 2016).
(e) The R2 value is 0.3066 which implies that 30.66% of the changes in the total debt level of the family may be accounted for by corresponding changes in the TV viewing hours per week. As a result, the fit of the model does not seem good (Medhi, 2015).
(f) The requisite hypotheses are as stated below.
Null Hypothesis: Slope is insignificant and hence can be assumed to be zero.
Alternative Hypothesis: Slope is significant and hence cannot be assumed to be zero.
The relevant output for hypothesis testing is shown below.
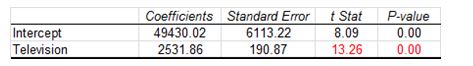
hypothesis-testing -in-quantitative-analysis-assignment.JPG
Part 4
The given sample data in the quantitative analysis assignment has limited presence of skew and thereby is close to normal distribution. This is also confirmed by the histogram for the two variables in the sample data provided. As per the statistical analysis of the data collected, it is apparent that there is a linear relationship of significance between the weekly TV viewing hours and the total debt level of the family. The correlation coefficient and the scatter plot indicate that the underlying relationship is positive thereby leading to some support to the hypothesis made by the sociologist. However, the magnitude of the relationship referred in this quantitative analysis assignment is rather moderate and not very strong. It is imperative that further analysis needs to be conducted in this regards especially with regards to possible presence of any confounding variable which could lead to the above relationship. Quantitative analysis assignments are being prepared by our management homework help experts from top universities which let us to provide you a reliable top assignment help service.
References
Flick, U. (2015) Introducing research methodology: A beginner's guide to doing a research project (4th ed.). New York: Sage Publications.
Hillier, F. (2016) Introduction to Operations Research. (6th ed.). New York: McGraw Hill Publications.
Medhi, J. (2015) Statistical Methods: An Introductory Text (4th ed.). Sydney: New Age International.


