
Statistical Analysis Assignment On Body Image Perception In Children From Age Group 8-12 Years
Question
Task: To prepare a report that includes analysis and presentation of data. The report should be suitable for community health centre workers and parents of pre-adolescent children.
This assignment will help you achieve the following learning outcomes for this subject:
- Upon successful completion of this assignment, you should be able to:
- Interpret key aspects of research findings
- Prepare and present a report that includes statistical analysis and involves the presentation of data.
This is an individual assignment however you will work in your allocated teams in the Workshops on activities designed to help develop the skills needed to prepare your report. These activities will include exercises that cover: data analysis; simple statistical tests; and data presentation.
As individuals you will:
- Use the research questions to design your plans for the quantitative data analyses.
- Describe the study design, method, sampling strategy and population, data collection method, data variables used and the study participants (including sample size)
- Describe data in both narrative and graphical formats from an existing research report.
- Describe the methods that you use in your analyses
- Conduct analyses to address your research objectives
- Interpret your results and draw appropriate conclusions
- Prepare a narrative summary of your findings
- Formulate suitable recommendations for future research and the intended audience of your report.
In regards to these tasks, Public Health, Rehab Counselling students will:
- Describe and analyse data from a research report
- Conduct analyses to compare sub-sets of the study population
- Conduct analyses to address the research objectives that include either a t-test or ?2 to test relevant associations
- Conduct a content analysis of a focus group transcript provided to complement the findings from the quantitative analyses
- Include both quantitative and qualitative findings in your narrative summaries and interpretation of results
- Attach your detailed qualitative analysis as an appendix.
Answer
Abstract
Body imaging discussed in this Statistical analysis assignment is an important social concern experienced by the young generation nowadays which in turn impacts their physical and mental well-being. The consequences of body image dissatisfaction among individuals often result in compensatory behaviours such as compulsive and strenuous long hours of exercise, inadequate dietary patterns, repulsive behaviours and such behaviours are also responsible for develop health related issues such as obesity, low self-esteem or eating disorders. The current study aims at identifying the differences among pre-adolescent individuals about their Body image perceptions that vary with age and gender. The report will also establish the statistical significance in the observed differences in the body image perception and would qualitative analyse why such differences arise. The quantitative data for this study has been gathered from Table 24 of a report by Nava Beunfil who used a cross sectional survey design to established statistical significance among pre-adolescent individuals that were dissatisfied with their body image. The current study has used descriptive statistics and logical regression to analyse the relationship between the body image index and the type of sports children play in Australia.
Introduction –
Body image is a complex topic discussed in this Statistical analysis assignment and it is multi layered as well. The idea about body image is sub-divided into a person’s perception and its attitude towards it. The perception of a person’s involves how they define the body in terms of its size, shape and weight whereas the latter involves thoughts, feelings and behaviour towards it. Whenever there’s mentioning of body image there is always mentioning of body dissatisfaction. Body dissatisfaction falls under the attitudinal aspect and gives negative perceptions about their body (Neves et al., 2017). Body image’s perception is permanent and may or may not start at the onset of puberty or adolescents. Body weight, shape and size related issues starts at the onset of childhood (Kostanski and Gullone, 2006). In this statistical analysis we have solved 3 research questions from the data given in table number 24 (Nava Buenfil 2012 report). Out of which the first two questions are based on quantitative assessment of the table while the last question is qualitative assessment.
Method-
Study design-: The study design used in the report by Nava Beunfil uses a cross sectional survey design. The report was made because of the scope of the study and the nature in which the investigation was made.
Hypothesis: The study was done to estimate the qualitative and quantitative analysis of the table 24 provided in the report by Nava Beunfil which shows the differences in the measures of body image by pre-adolescents children.
Study population: The study of Statistical analysis assignment was done on children studying in grades 3 to 6 from catholic primary schools in north and west part of Australia. The study was done keeping in mind from where the children belong that is advantageous or disadvantageous part of the town.
Sampling strategy: The study used logistic regression as the sampling method which analysed the relationship between the body image index and the type of sports children play in Australia.
Data variables: The data variables used in the report to perform the statistical analysis was male, female, their ages and their responses.
Study participants: Study included a total number of 339 children, in which 116 were males and 173 were females from 13 catholic primary schools in Australia. The mean age of the children participating in the study was 10.
Quantitative analysis: The quantitative analysis of table number 24 was done by the chi-square test (2 by 2 method). It is a non-parametric test which is used to test the following 2 criteria-
- Independency of the 2 variables (hypothesis of no association between 2 variables) (Singhal and Rana, 2015).
- How likely the 2 variables fit in the criteria (Singhal and Rana, 2015).
Qualitative analysis: The qualitative research was done by characterising the aims of the study, themes were made according to the given transcript. Instead of using numbers qualitative research uses the social aspects of the person in general and generate words. It is generally aim in understanding the attitude and behaviour of the person. In this study, there was need of understanding how the children in Australia perceive a particular issue, therefore qualitative analysis was appropriate (McCusker and Gunaydin, 2014).
Results-
Quantitative analysis of Statistical analysis assignment - (Descriptive Statistics)
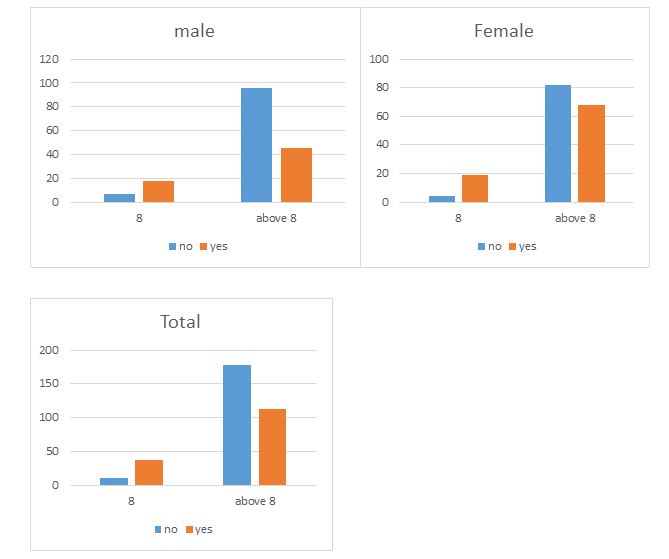
Data: We divided the data into three categories namely, male, female and the total analysis. There were total 166 number of males and 173 number of females. The total number of children in the study were 339. The answers were divided into following groups –
- No, not at all
- No, not much
- I don’t know
- Yes, a little
- Yes, a lot
These 5 answers were clubbed into 2 namely, YES or NO. The other criteria that divided the data was children 8 years of age and children more than 8 years of age. The total number of children under 8 years male were 25 and above 8 years male were 141. Similarly, the total number of children over 8 years of age female were 23 while above 8 years of age female were 150.
The analysis of the above data within this Statistical analysis assignment was done with the help of chi-square test (R by C table). The hypothesis was analysed into 3 parts which means 3 chi square tests either one for male, female and total number of children. The chi square test was performed with the help of the online software OpenEpi.com.
For the first test we used male children, the hypothesis was accepted and the p- value of the table came out to be 0.0001409, which is less than 0.05. Therefore, the hypothesis is accepted.
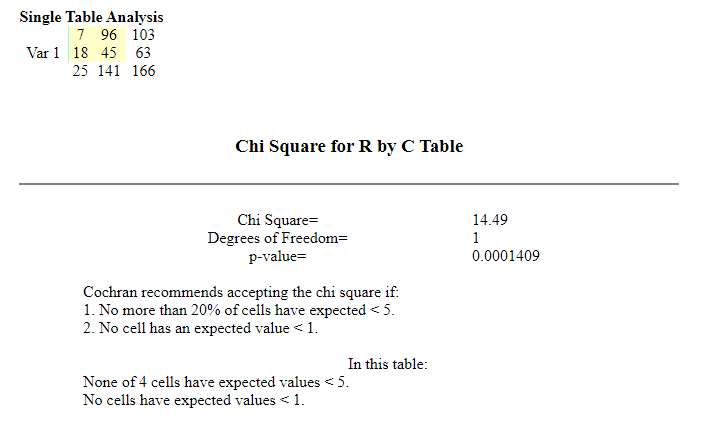
Figure 1: Male chi- square test
The second test performed in this Statistical analysis assignment was with the female children, the hypothesis was accepted and the p- value of the chi square test came out to be p= 0.0008708. As the value of p obtained is less than 0.05, the hypothesis is accepted and correct.
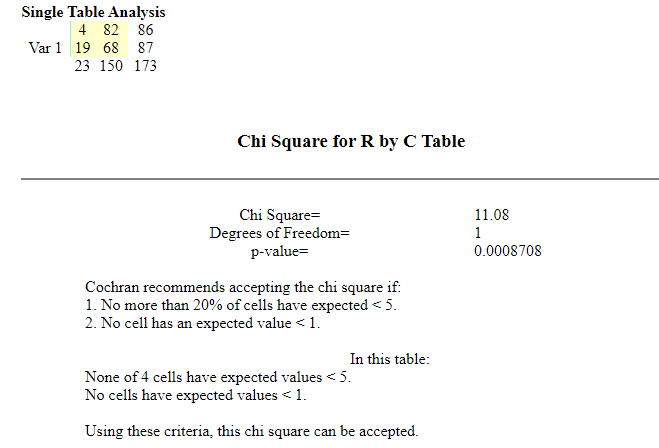
Figure 2: female chi- square test.
The third chi square test was performed and analysed on the total number of the children, including male and the female. The p – value was this test was 0.000000676 which is less than 0.05, so the null hypothesis can be accepted.
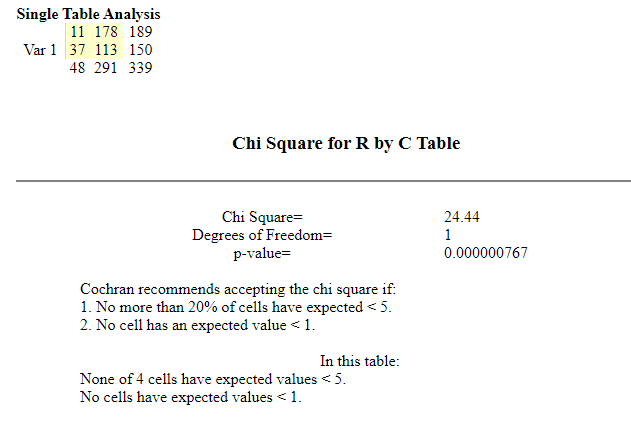
Figure 3: Total number of children chi- square test.
Qualitative analysis-
Data: The first step mentioned in this Statistical analysis assignment to do qualitative analysis is to collect the data. The data for qualitative analysis was taken from the transcript provided. Thematic analysis is based on identifying the patterns or themes for study (Aronson, 1994). From the transcribed version of the interview patters were identified and themes were made accordingly. There were 3 themes that were made from the 11 interview questions given in the transcript. The interview participants were 10 children from grade 6 (5 females and 5 males) of catholic primary school in Melbourne. The questions were solely based on the children’s perceptions on body image, being fit and celebrities stereotypes.
Three themes were made in this Statistical analysis assignment namely, perception on body image, perception on body fitness and perception of body stereotypes. The answers to the themes were clubbed in 4 scales namely, do not know, weak perceptions, moderate and very strong perceptions. Codes were given to the scales by the number 1, 2, 3 and 4. The questionnaire was made and the answers were encircled.
Theme 1: children’s perception on body image.
Children according to their gender have different perceptions on body image. Body image perception was classified according to being overweight, fat, height and competition between the children on how they look and how they have their body. Out of 5 three of the boys said they would like to have lots of muscle and do not want to overweight while the other 2 mentioned being moderate, taller with a physique of a footballer. The girls on the other hand had different views on this. 2 of the girls did not want to look fat while the other 3 did not want to look too skinny neither too fat. 2 boys and 2 girls thought that it is very important to look good and not fat.
Theme 2: children’s perception on body fitness.
Just like body image children of different gender have different perceptions on how fit the body is and sports played by the person. To all the boys’ sports and fitness is a very strong opinion. All the 5 boys wanted to be fit and good at sports. While girls had different perception about it. 2 of the girls think it is very important to be fit. 1 of them think it is moderate to have a body fitness while the other 2 had very weak perception about body fitness. They think fitness is barely important.
Theme 3: perception on body stereotypes.
Body stereotypes were seen to be followed by most girls. While boys also had a perception on it but the responses from the girls were strong and effectible. 3 out of 5 girls wanted to look like some celebrity and had strong perceptions about it. While the other 2 thought of it to be not that important and had weak perceptions about it. Boys on the other hand, had strong perceptions about following a celebrity’s fitness and body image. 2 out of 5 had strong perceptions about the stereotypes of a person’s body. Another 2 had weak to moderate answers while 1 did not know about it.
Theme 4: changes in the body.
The children were asked about the changes they would make to themselves. Out of 5 girls 2 said “they don’t know” while one said that she doesn’t want to change anything. 1 out of 5 girls said that she would change “what she eats and what she wears and how she does her hair? The boys on the other hand, had strong opinions on changing themselves according to the sports. While 1 had moderate answers to it.
Discussions: The study hypothesis mentioned in this Statistical analysis assignment came out to be statistically significant in accordance to the null hypothesis we took. The perception of body image and relates issues changes according to the child’s age, gender and the social status. The body physique of the child also determines the perception of a child’s image on his body. Both quantitative as well as qualitative analysis showed the almost same results. The quantitative analysis showed that both the variables (male and female) are not dependent on each other and therefore, proves the hypothesis of different perceptions of male and female on body images. The qualitative analysis on the other hand was done by making themes and clubbing the answers of the interview into 4 themes. A scale was provided to the themes and answers were taken in codes given to the each theme. The study had many limitations in respect to body-size image perceptions by the children. First, the ethnicity and the diversity of the children were not known. The statistical analysis could have some differences in context to the diverse groups the children belongs to. The diverse group could be racial or ethnic (Runfola et al., 2012). Second, the findings or the analysis were done only the sample given or provided and are not generalizable (Runfola et al., 2012). Third, this was a cross- sectional study so we do not know whether it was due to age or other factors (Runfola et al., 2012). There were also limitations to the scope of the study and the data provided. The study had limitations in terms of qualitative analysis, this type of analysis does not provide basic frequencies to the characteristics of the data and is only a descriptive solution to the data (Bothe & Andreatta, 2004). The main disadvantage of the study mentioned in this Statistical analysis assignment was that it cannot be extended to wider range of populations and is limited only to the sample provided.
References-
Aronson, J. (1994). A Pragmatic View of Thematic Analysis. The Qualitative Report,, 2(1).
Bothe, A., & Andreatta, R. (2004). Quantitative and qualitative research paradigms: Thoughts on the quantity and the creativity of stuttering research. Advances In Speech Language Pathology, 6(3), 167-173. doi: 10.1080/1441704112331283020
Kostanski, M., & Gullone, E. (2006). The Impact of Teasing on Children’s Body Image. Journal Of Child And Family Studies, 16(3), 307-319. doi: 10.1007/s10826-006-9087-0
McCusker, K., & Gunaydin, S. (2014). Statistical analysis assignment Research using qualitative, quantitative or mixed methods and choice based on the research. Perfusion, 30(7), 537-542. doi: 10.1177/0267659114559116
neves, c., cipriani, f., meireles, j., morgado, f., & ferreira, m. (2017). BODY IMAGE IN CHILDHOOD: AN INTEGRATIVE LITERATURE REVIEW. Revista Paulista De Pediatria, 35(3), 331-339.
Runfola, C., Von Holle, A., Trace, S., Brownley, K., Hofmeier, S., Gagne, D., & Bulik, C. (2012). Body Dissatisfaction in Women across the Lifespan: Results of the UNC-SELFand Gender and Body Image (GABI) Studies. European Eating Disorders Review, 21(1), 52-59. doi: 10.1002/erv.2201
Singhal, R., & Rana, R. (2015). Chi-square test and its application in hypothesis testing. Journal Of The Practice Of Cardiovascular Sciences, 1(1), 69. doi: 10.4103/2395-5414.157577
Appendices-
Instructions: Please answer each statement given below by using the rating scale here:
|
Strong perceptions |
Moderate perceptions |
Weak perceptions |
Do not know /no perceptions |
Circle one number for each line according to your answer for every theme.
|
|
Strong perceptions |
Moderate perceptions |
Weak perceptions |
Do not know/ no perceptions |
|
Strong with lots of muscles |
1 |
2 |
3 |
4 |
|
I want to be not fat, not really thin either, just medium. Just a 1bit muscular. |
1 |
2 |
3 |
4 |
|
I think it's important to be a little bit skinny. I am sort of glad I am skinny and not too fat. |
1 |
2 |
3 |
4 |
|
It's good to look nice, because otherwise people might think you’re a complete weirdo. |
1 |
2 |
3 |
4 |
|
I’m fit. |
1 |
2 |
3 |
4 |
|
I just want to be myself |
1 |
2 |
3 |
4 |
|
To me, I would like to look like a celebrity – someone cool. |
1 |
2 |
3 |
4 |
|
No, I can’t think of anyone |
1 |
2 |
3 |
4 |
|
I started thinking about what I looked like mostly this year; definitely not when we were young because we didn’t know what the hell was going on. |
1 |
2 |
3 |
4 |


