
Financial Analysis Assignment: Great West Company
Question
Task: The client has attached a different file named as “RATIOS” and they want those ratios to be calculated looking at the balance sheet of the company and file is attached of the balance sheet.Do add the Ratio tables in the assignment.Please refer the “RATIOS”file which is attached.You can do any other work as well.Assignment structure is also mentioned below.It has to be the same.You can do additional things.Things to analyse are-
- Whether the company can expand their business globally after looking at the present scenario
- What strategies can the company make to expand the business
- Can the company get more inventories looking at the present debt which the company has.
- What product market should the company focus so that they can make profit.
Answer
Executive Summary
Ratio analysis is a tool of financial statement analysis that helps in comparison of a particular company’s financial position with other organizations and industry averages. This is considered as a most effective financial statement analysis tool because it helps in eliminating the effect of different factors such as the size of the organization and operating capacity of different companies. This financial analysis assignment is prepared in order to analyze the financial position of The Great West Company on the basis of financial statements provided for the year 2016, 2017 and 2018. This company is operating in the food industry of Canada and other parts of the world. The ratios calculated for GWC will be compared with other competitors in the market and industry average ratios. At last, other factors such as business expansion and inventory management will also be discussed in this financial analysis assignment. All these functions are undertaken in this financial analysis assignment in order to identify the actual financial position of the company in the market with the help of data provided in financial statements.
Ratio analysis:
Profitability ratio: These are the ratios that show profitability increase and a decrease in profitability of the company over the period of time.
|
Profitability ratios |
|||
|
Particular |
2018 |
2017 |
2016 |
|
Net profit |
69691.00 |
77076.00 |
69779.00 |
|
Gross profit |
586086.00 |
541497.00 |
522614.00 |
|
Total revenue |
1953743.00 |
1844093.00 |
1796035.00 |
|
Total equity |
382156.00 |
367785.00 |
357612.00 |
|
Total assets |
930948.00 |
805821.00 |
793795.00 |
|
Total Cash flow |
-5083.00 |
-7000.00 |
8114.00 |
|
Return on equity |
18.24 |
20.96 |
19.51 |
|
Return on assets |
7.49 |
9.56 |
8.79 |
|
Gross profit margin |
30.00 |
29.36 |
29.10 |
|
Cash flow to sales |
-0.26 |
-0.38 |
0.45 |
Return on equity (ROE)
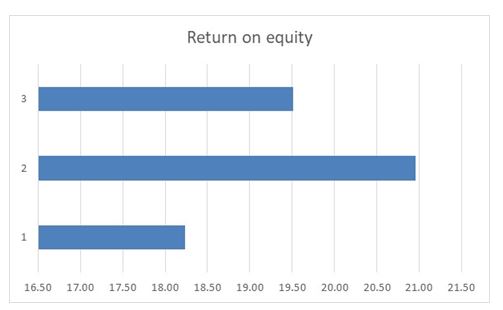
Return on equity ratio of the company has improved in the year 2017 but it decreased in the year 2018. It shows that the profitability of the company has a decline in a current financial year as compared to 2017. Return on equity ratio for Loblaw in the year 2016 and 2017 were .40% and 9.00% and the industry average was 18% to 30%. On the basis of this evaluation, it can be said that return on equity ratio of the company is according to the industry average and it is very effective as compared to the main competitor of the company i.e. Loblaw (Hoskin, Fizzell and Cherry, 2014). The company should try to maintain a return on equity ratio of around 25 % in future financial years. This return on equity can be maintained by the management by enhancing sales and profitability with the help of marketing planning and focusing on most profitable products and services. Controlling indirect cost of can also be used to increase net profits generated from primary business.
Return on assets (ROA)
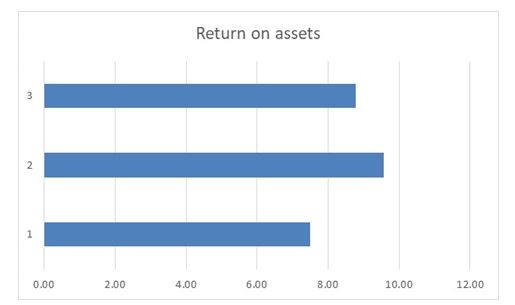
Return on asset ratio is a profitability ratio and efficiency ratio that shows profit generated by a company with the help of resources available with an organization in form of total assets. Return on asset ratio of the company has increased from 8.79 % to 9.56 % in 2017 but then it decreased to 7.49% in the year 2018. This trend in return on asset ratio shows that profitability of the company is fluctuating but the level of fluctuation is not very high and Company can recover easily from this decline in the next financial year with better management. Return on assets can be improved by improving efficiency of management to generate more profits from use of assets. Economic concepts of break-even analysis and economics of scale can be adopted in order to do so. In addition to that focus should also be given on managerial accounting.
Gross profit ratios
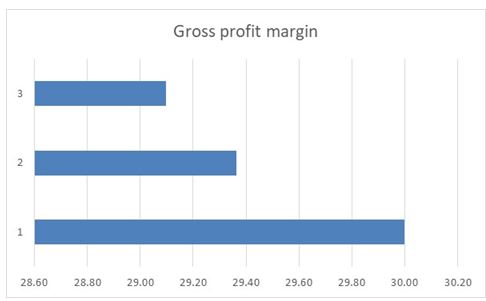
Gross profit margin shows the efficiency of the operational capabilities of a company as it shows the ratio between a gross profit of the company and the total revenue generated in a particular financial year. Gross profit ratio of the company is around 30% in all financial years that shows the total direct cost of the company is seventy percent of the total revenue generated (Warren and Jones, 2018). Industry average cost to sales ratio is 74 % and it is 75.20 and 76.20 in case of Loblaw in the financial year 2017 and 2016 respectively. It clearly shows that the total cost incurred by GWC is around 5% lower as compared to other organizations working in the food industry of Canada. Gross profits can be further improved by making periodic contracts with suppliers of raw material to maintain the increase in cost of goods sold. This will help in controlling the unexpected rise in cost of raw material.
Cash flow to sales ratio
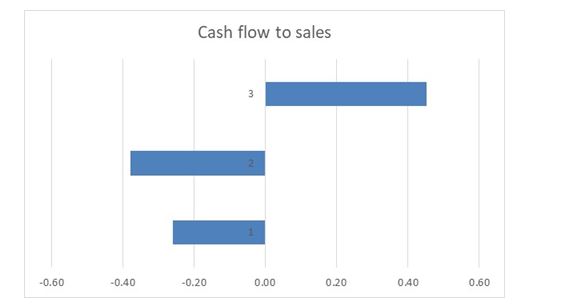
This profitability ratio shows cash generated by a company out of total revenue generated in a particular financial year. This ratio considered as generated from all the activities performed by management i.e. operating, investing and financing activities. Cash flow to sales ratio has decreased substantially in the year 2017 and 2018 as companies generating a negative overall cash inflow in these financial years. Cash generation capacity of the company is not effective which is a result of financing and investing activities as there is a substantial inflow of cash inflow from operating activities (Fazzini, 2018). It would not be effective to evaluate the profitability of the company on the basis of this ratio because it is common for business organizations to invest in assets to increase operating capacity which results in overall negative cash inflow. Management should try to maintain overall cash inflow in every financial year. This can be done by evaluating the profit generating capacity of every asset available with the company on periodic basis. Company is investing constantly on new machineries and equipment which is productive for the company but they should also sell out any unproductive asset that can be replaced by new assets.
Liquidity ratio
|
Liquidity ratios |
|||
|
Particular |
2018 |
2017 |
2016 |
|
Current assets |
335003.00 |
327938.00 |
335581.00 |
|
Current liabilities |
171212.00 |
152244.00 |
155501.00 |
|
Inventory |
222072.00 |
213217.00 |
211736.00 |
|
Prepaid assets |
7006.00 |
5547.00 |
7229.00 |
|
Quick assets |
105925.00 |
109174.00 |
116616.00 |
|
Operating cash flow |
141419.00 |
126024.00 |
132987.00 |
|
Current ratio |
1.96 |
2.15 |
2.16 |
|
Quick ratios |
0.62 |
0.72 |
0.75 |
|
Cash flow ratio |
0.83 |
0.83 |
0.86 |
Current ratio
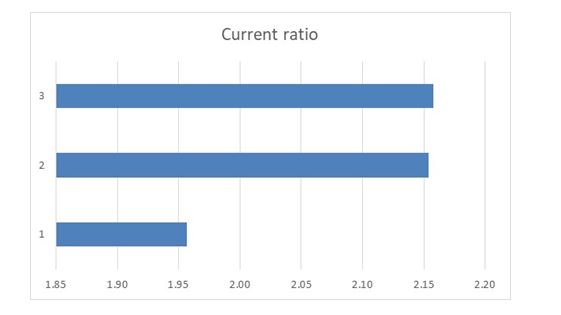
The current ratio for short-term liquidity position of a company in the market by making a comparison between current assets and current liabilities as the business organization uses economic benefit from current assets to pay off economic obligations. The current ratio of the company in the year 2016 is 2.16 which has decreased to 2.15 in 2017 and 1.96 in 2018. On the basis of industry average current ratio of the company is comparatively higher (Wahlen, Baginski and Bradshaw, 2014). The current ratio of Loblaw is around 1.45 and in industry average is around 1.60 to 1.70. The short-term liquidity position of the company is effective in the market and better as compared to other organizations in the market. Current ratio of company is a little higher as compared to industry average that should that there might be loss of interest income. This interest can be earned by company through investing excess money that will be realised from sale of excess current assets.
Quick ratio
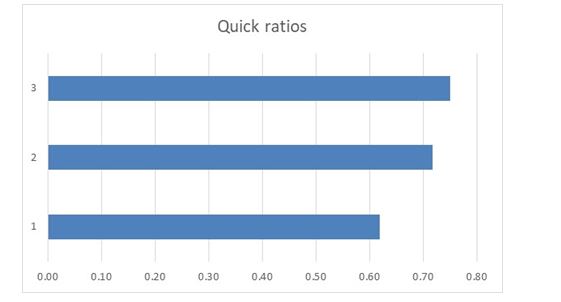
The quick ratio is similar to the current ratio but it excludes prepaid assets and inventory while calculating quick assets from total current assets because they are not easily convertible cash within a given period of time. Quick asset ratio of the company is around. 83 in the last two financial years. It is a General assumption in any industry that quick ratio should be at least half of the total industry current ratio. According to this assumption industry, the quick ratio should be around 0.80- .85. Therefore it can be said that the quick ratio of GWC is optimum according to Food Industry of Canada. Company should not try to make any changes in current assets other than inventories and prepaid assets as quick ratio of the company is optimum. There is a requirement of decreasing current ratio that should be done by decreasing the amount of closing inventories.
Cash flow ratio
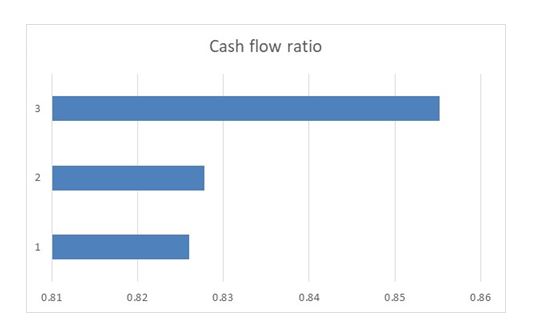
Operating cash flow is the ratio between operating cash flow generated by the organization and current assets of the company. This ratio shows whether current liabilities can be paid off with the help of cash generated from the daily operations of a company. Total cash flow ratio of the company is around .85 in all the financial years. It shows that 85% of the current liabilities in a particular financial year can be paid off with the help of operating cash inflow (Thomas et.al, 2016). This is a substantial amount of cash generated by GWC and it is a sign of effectiveness and profitability in business operations. Current strategy and policies in relation to operating cycle of the company is optimum and management should not make any changes.
Capital structure ratio
|
Capital Structure Ratios |
|||
|
Particular |
2018 |
2017 |
2016 |
|
Total equity |
382156.00 |
367785.00 |
357612.00 |
|
Total debt |
313549.00 |
229266.00 |
225489.00 |
|
Total assets |
930948.00 |
805821.00 |
793795.00 |
|
EBIT |
113971.00 |
118131.00 |
107321.00 |
|
Interest expense |
10145.00 |
7220.00 |
6210.00 |
|
Debt to equity ratio |
0.82 |
0.62 |
0.63 |
|
Debt ratio |
0.34 |
0.28 |
0.28 |
|
Equity ratio |
0.41 |
0.46 |
0.45 |
|
Interest serving ratio |
11.23 |
16.36 |
17.28 |
Debt to equity ratios
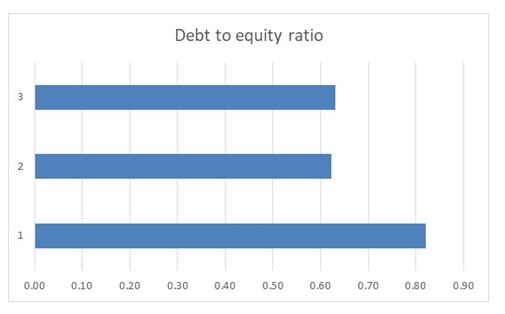
Debt to equity ratio shows the ratio between components of capital in a particular business organization. Debt to equity ratio in case of GWC is .63 and .62 in the year 2016 and 2017 respectively but it has increased to 0.82 in the year 2018. After evaluating the industry average which is around 1.30 to 1.60, it can be said that the capital structure of the company is not according to the generally acceptable capital structure in the food industry of Canada. There is a requirement to increase the level of that component in the total capital structure of GWC (Danis, Rettl and Whited, 2014). It will increase the total interest cost paid by the company but tax benefits will help in increasing the net profitability of the company.
Currently company is thinking to expand the business in international market. This can be done by the company by doing the expansion with the help of debt financing. If all the financial requirement are not achieved by debt financing then equity sources can be selected but industry average of 1.30 to 1.60 should be maintained.
Debt ratio and Equity ratio
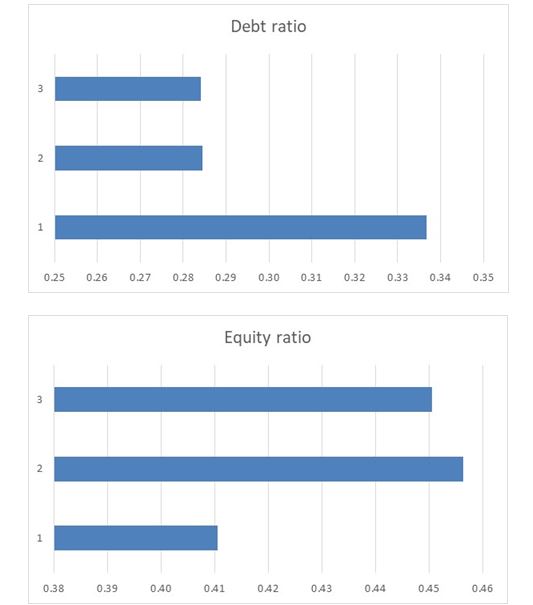
Both of these ratios shows the proportion of total assets in the business that is financed with the help of debt component or equity component. According to the ratio analysis, the debt ratio of the company has increased from .28 in the year 2016 and 2017 to .34 in the year 2018 (Wahlen, 2014). On the other hand equity ratio of the company is around .45 which shows that the majority of the asset financed with the help of equity.
Interest serving ratio
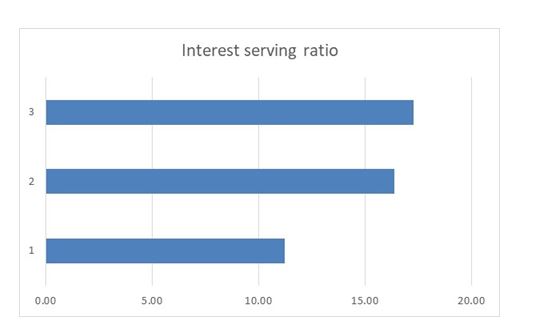
Interest serving ratio which is also called as interest coverage ratio shows the number of earnings available with the company to pay off total interest on long-term debt obligations. This ratio has decreased from 17 times to 16 times in 2017 which has further decreased to 11 times in 2018. It shows that total earning available before interest and Taxes is 11 times the interest expenditure of the company. Interest coverage ratio has decreased over the period of time but it can be said that there will not be any problems in the future in relation to the payment of interest cost.
International business expansion
Currently, GWC is working in the international market but it is limited to US, South Pacific and the Caribbean market. Company has proposed to further expand its business in the other international markets in order to increase the growth rate and international presence of the company. This can be evaluated with the help of segmentation report provided in the financial statements by the management of the company. Total revenue and net profit generated by an international and Canadian segment of the company are as follows-
|
Particular |
2018 |
2017 |
2016 |
|
Sales |
|
|
|
|
Canada |
11,71,621.00 |
11,25,330.00 |
10,89,898.00 |
|
International |
7,82,122.00 |
7,18,763.00 |
7,06,137.00 |
|
Consolidated |
19,53,743.00 |
18,44,093.00 |
17,96,035.00 |
|
|
|
|
|
|
Earnings from operations |
|
|
|
|
Canada |
72,597.00 |
74,445.00 |
66,495.00 |
|
International |
41,374.00 |
43,686.00 |
40,826.00 |
|
Consolidated |
1,13,971.00 |
1,18,131.00 |
1,07,321.00 |
|
|
|
|
|
|
Net profit (Canada) |
6.20 |
6.62 |
6.10 |
|
Average |
6.30 |
||
|
Net profit (International) |
5.29 |
6.08 |
5.78 |
|
Average |
5.72 |
||
On the basis of the above table of this financial analysis assignment, it can be said that the average profitability of the Canadian segment of the company is around 6.3 percent whereas the average profitability of the International segment is around 5.72. This difference is not very substantial considering the fact that Canada is the main headquarter of the company (Suzuki and Okamuro, 2016). Therefore it would be profitable for the company to increase international business and invest in other parts of the world.
Method of international business expansion
There are various methods that can be used by GWC for expansion of business in the international market such as franchise, licensing merger and acquisition, development of New Market segment, corporate extension, exporting, e-channel etc. it is recommended that management of GWC should execute this International expansion in two phases. First management of the company should start an e-commerce channel in the proposed countries that are not fully utilized in terms of the Food Industry (Zander, McDougall-Covin and Rose, 2015). After analyzing the results of this E-Commerce channel business for the expansion should be done with the help of merger and acquisition which is the fastest method of growth and development.
Additional inventory
Yes, management of the company can get additional inventories in order to expand the business after analyzing the current debt obligations on the company. Current Debt to equity ratio of the company is substantially lower as compared to other business organizations working in this industry. Therefore there is a scope of increasing the debt obligations without affecting the optimum capital structure of the company (Wild, 2017). The company should increase the debt component and invest the amount received from Debt obligations in purchasing of inventory in order to expand the business in the international market.
Products to focus on for increasing profitability
Management of GWC should focus on current highly profitable products and services offered in the Canadian market. On the other hand in case of the international market in this financial analysis assignment, management is required to conduct analysis on other organizations working in the food industry to identify most profitable food products available in the market. This financial analysis assignment should be conducted by the management during the stage of identifying the potential market for business expansion in international market. Separate Strategies for the Canadian market and the international market will help in increasing the overall profitability of the company.
GWC is engaged in the business of apparel, home goods, outdoor products and food products. According to the latest financial statements of the company, 79% of total revenue of the company is generated with food products sales. It would be more profitable for the company to focus on food products in both international as well as domestic market. This is the area of business that is already popular and resources required to expand this segment is not substantial as compared to apparel and home products. Majority of new financial and human resources should be invested in this segment and initial focus of international business expansion should also be food products. Financial analysis assignments are being prepared by our online accounting assignment help experts from top universities which let us to provide you a reliable best assignment help service.
References
Danis, A., Rettl, D.A. and Whited, T.M., 2014. Refinancing, profitability, and capital structure. Journal of Financial Economics, 114(3), pp.424-443.
Fazzini, M., 2018. Financial Statement Analysis. In Business Valuation (pp. 39-76). Palgrave Macmillan, Cham.
Hoskin, R.E., Fizzell, M.R. and Cherry, D.C., 2014. Financial Accounting: a user perspective. Wiley Global Education.
Suzuki, S. and Okamuro, H., 2016. Determinants of academic startups’ orientation toward international business expansion. Administrative Sciences, 7(1), p.1.
Thomas, R.R., Van Greuning, H., Henry, E. and Michael, A.B., 2016. International financial statement analysis.
Wahlen, J., 2014. Financial Reporting, Financial Statement Analysis and Valuation/James Wahlen, Stephen Baginski, Mark Bradshaw. Cengage Learning.
Wahlen, J., Baginski, S. and Bradshaw, M., 2014. Financial reporting, financial statement analysis and valuation. Nelson Education.
Warren, C. and Jones, J., 2018. Corporate financial accounting. Cengage Learning.
Wild, T., 2017. Best practice in inventory management. Routledge.
Zander, I., McDougall-Covin, P. and Rose, E.L., 2015. Born globals and international business: Evolution of a field of research. Journal of International Business Studies, 46(1), pp.27-35.


