Portfolio Management Assignment on Asset Classes
Question
Write a report on portfolio management assignment discussing the various differences in the asset class weights within each of three investor portfolios as well as the differences between each investor’s portfolios. Why do these differences exist? Do these differences make sense?
Answer
Introduction:
There are different types of investment opportunities explored in the portfolio management assignment, which provide return at different rates and include different levels of risk, as well. In general, it has been observed in the portfolio management assignment that investments, which provide higher returns, also bear higher risks. On the other hand, though the investors always require higher returns, the risk bearing capacity also differs from investor to investor. In accordance with the risk-bearing capacities of investors, they can be classified into three sections – Conservative, Balanced and High Growth. Conservative investors do not prefer highly risky investment opportunities, whereas, High Growth investors can take high risk for higher returns. The Balanced investors prefer such investments, which have moderate level of risk. Hence, it is quite difficult to select proper investments, which can provide required return and also match the risk-profile of the individual investor, as well.
Portfolio management is a useful tool, which can satisfy the investors’ requirements by creating proper balance between the required return and preferred risk level. Herein portfolio management assignment, it can be defined as the process of analyzing and selecting different investment securities to form the investment blend, which can fulfill the objectives of investors. An ideal investment portfolio includes both highly risky investment with higher returns as well as investments with lower return and lower risk at proper proportion as per the investor’s risk profile.
In this report on portfolio management assignment, some selected asset classes with different return rates and different risk levels are taken into consideration for preparing portfolios of three investors, who belong to different risk profiles. The report on portfolio management assignment demonstrates how the selection of asset classes and weights of asset classes vary for different risk profiles under different scenarios. It also includes the analysis of such variation.
Domestic Portfolio:
In this portfolio management assignment, the first type of portfolio includes the domestic asset classes, which are ASX300, AUBD and CASH. The individual risk and return rates of these asset classes are given below within this portfolio management assignment:
|
Returns |
Standard Deviation |
|
|
ASX300 |
0.47% |
3.44% |
|
AUBD |
0.35% |
0.52% |
|
CASH |
0.35% |
0.08% |
It can be observed from the table that ASX300 provides highest return amongst the three assets, but also contains highest risk level. The return rates of AUBD and CASH are same, though AUBD is more risky than CASH. The correlations of these assets are also shown below within the portfolio management assignment:
Correlation:
|
ASX300 - AUBD |
-0.25 |
|
AUBD - CASH |
0.23 |
|
CASH - ASX300 |
-0.19 |
It is clear that the returns of ASX300 do not correlate with the returns of AUBD and CASH. However, AUBD and CASH has minimum correlation with each other.
Based on the above data provided in the portfolio management assignment, the optimal portfolios for the three types of investors are prepared below:
Conservative Investor:
|
|
Weight |
|
ASX300 |
79.60% |
|
AUBD |
10.03% |
|
CASH |
10.38% |
|
Total |
100.00% |
|
Portfolio Return |
0.45% |
|
Portfolio St.Dev. |
2.72% |
|
Portfolio Variance |
0.07% |
|
Risk Aversion Coefficient |
12.00 |
Balanced Investor:
|
|
Weight |
|
ASX300 |
100.00% |
|
AUBD |
0.00% |
|
CASH |
0.00% |
|
Total |
100.00% |
|
Portfolio Return |
0.47% |
|
Portfolio St.Dev. |
3.44% |
|
Portfolio Variance |
0.12% |
|
Risk Aversion Coefficient |
7.94 |
High Growth Investor:
|
|
Weight |
|
ASX300 |
100.00% |
|
AUBD |
0.00% |
|
CASH |
0.00% |
|
Total |
100.00% |
|
Portfolio Return |
0.47% |
|
Portfolio St.Dev. |
3.44% |
|
Portfolio Variance |
0.12% |
|
Risk Aversion Coefficient |
7.94 |
However, if these investors would prefer equal investment in ASX300 and AUBD and exclude CASH, then the portfolio return and risk level would be as follows:
|
|
Weight |
|
ASX300 |
50.00% |
|
AUBD |
50.00% |
|
Total |
100.00% |
|
Portfolio Return |
0.41% |
|
Portfolio St.Dev. |
1.67% |
|
Portfolio Variance |
0.03% |
|
Risk Aversion Coefficient |
29.28 |
The two asset-portfolios would provide returns at the rate 0.41%, which is lower than all the three optimal portfolios. However, along with return rate obtained in the present context of portfolio management assignment, the risk levels would also drop significantly.
Analysis:
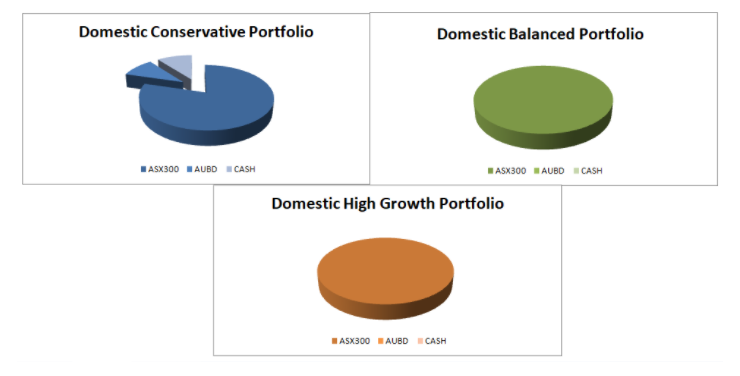
The weights of the three asset classes in the three different portfolios are shown in the following graph:

The conservative investor’s portfolio contains all the three assets to minimize the risk of overall portfolio, for including highly risky ASX300 with the help of AUBD and CASH, which are less risky nature. However, considering the risk-bearing capacity of the investor and generate required returns, almost 80% of the total investment is funded in ASX300. Approximately 10% of the total investment should be invested in AUBD and CASH individually.
The portfolio of balanced includes only ASX300. The risk aversion coefficient of balanced portfolio is slightly higher than risk aversion coefficient of the balanced investor. Hence, it can be stated that the portfolio return is comparatively lower than the expected return of the investor and there has been a scope to include investments with higher return and risk level. However, as there is no other domestic asset class, the investor has to satisfy with this return only.
The high-growth portfolio would also contain ASX300 only and the risk aversion coefficient of the portfolio is much higher than that of the investor. However, just like the balanced investor, he/she does not have any opportunity to invest in any other high return generating asset due to unavailability of other profitable domestic assets.
The two-asset portfolio, which contains ASX300 and AUBD, reflects that if the total investment is divided equally in a highly risky and less risky asset classes, then it would help to minimize the overall portfolio risk greatly. However, it would result in fall of overall portfolio return also. The risk aversion coefficient of the two-asset portfolio is much higher even for the conservative investor. It indicates that even the conservative investor can bear more risk to earn higher returns. Hence, it is clear that AUBD and CASH can minimize risk, but are unable to provide the expected returns. For this reason identified in the portfolio management assignment, these assets have not been considered for the balanced and high-growth. In conservative portfolio, the weights of these assets have been limited to approximately 10% each for avoiding any reduction of returns.
International Portfolio:
For international portfolio, both the domestic assets, stated above, and some selected international assets have been taken into consideration. The individual risk and return rates of these assets are shown in the table provided within the portfolio management assignment:
|
Returns |
Standard Deviation |
|
|
ASX300 |
0.47% |
3.44% |
|
AUBD |
0.35% |
0.52% |
|
CASH |
0.35% |
0.08% |
|
USBD |
0.48% |
3.73% |
|
S&P500 |
0.50% |
5.30% |
|
NKY |
0.35% |
0.80% |
|
EMEQ |
0.50% |
5.28% |
|
EMBD |
0.40% |
1.73% |
The table denotes that S&P500 and EMEQ are the most profitable assets in terms of returns, but are also most risky assets, as well. USBD is another international asset with higher return rate and higher risk level than ASX300. All other international assets provide lower returns than ASX300. In terms of risk level, CASH is the least risky asset, which provides same return as AUBD and NKY, both of which include higher risks than CASH.
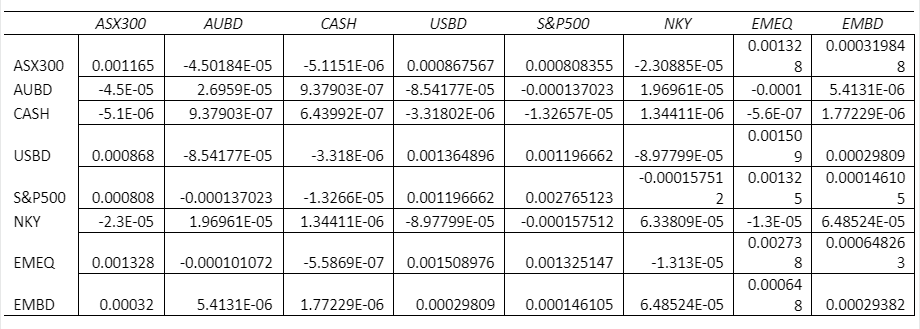
The covariance matrix of these eight asset classes are given below within the portfolio management assignment:

The optimal portfolios of the three investors considering the eight asset classes are presented below:
Conservative Investor:
|
|
Weight |
|
ASX300 |
50.00% |
|
AUBD |
50.00% |
|
CASH |
5.63% |
|
USBD |
7.30% |
|
S&P500 |
5.78% |
|
NKY |
4.67% |
|
EMEQ |
9.11% |
|
EMBD |
4.75% |
|
Total |
100.00% |
|
Portfolio Return |
0.45% |
|
Portfolio St.Dev. |
2.75% |
|
Portfolio Variance |
0.08% |
|
Risk Aversion Coefficient |
12.00 |
Balanced Investor:
|
|
Weight |
|
ASX300 |
70.64% |
|
AUBD |
0.00% |
|
CASH |
0.00% |
|
USBD |
0.00% |
|
S&P500 |
0.00% |
|
NKY |
0.00% |
|
EMEQ |
29.36% |
|
EMBD |
0.00% |
|
Total |
100.00% |
|
Portfolio Return |
0.48% |
|
Portfolio St.Dev. |
3.70% |
|
Portfolio Variance |
0.14% |
|
Risk Aversion Coefficient |
7.00 |
High-Growth Investor:
|
|
Weight |
|
ASX300 |
0.00% |
|
AUBD |
0.00% |
|
CASH |
0.00% |
|
USBD |
0.00% |
|
S&P500 |
0.00% |
|
NKY |
0.00% |
|
EMEQ |
100.00% |
|
EMBD |
0.00% |
|
Total |
100.00% |
|
Portfolio Return |
0.50% |
|
Portfolio St.Dev. |
5.23% |
|
Portfolio Variance |
0.27% |
|
Risk Aversion Coefficient |
3.65 |
Analysis:
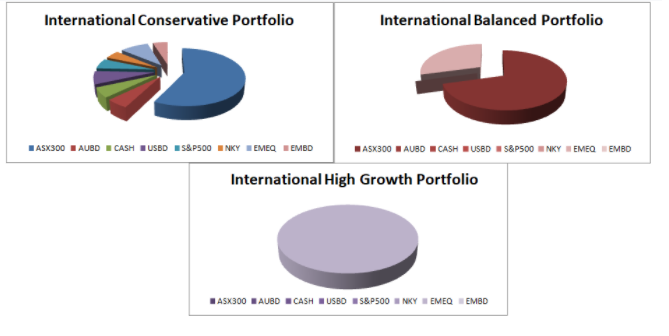
The weights of different assets classes in the three international portfolios are presented in the graphs below:

As the graphs display in the above section of portfolio management assignment, the conservative portfolio would include all the eight assets, though almost 58% of the total investment would be allocated to ASX300, followed by EMEQ, USBD and S&P500, which would have 9.11%, 7.30% and 5.78% shares respectively. The main reason of investing maximum amount in ASX300 instead of EMEQ, USBD and S&P500 is the higher risk, associated with the latter assets. Though, more investment in these assets would help to generate higher returns, it would also increase overall risk level of the portfolio, which is not preferable for the conservative investor. However, on the other hand, if these assets would not be included in the portfolio, then the investor cannot earn the expected return. Hence, to balance the affordable risk level and expected return, more than half of the investment is allocated to ASX300, which provides fourth highest return rate amongst the eight asset classes and also less risky than the stated three assets. For mitigate the risk factor further in accordance to the risk aversion coefficient of the investor, assets with lower returns rates and risk levels are also included in the portfolio. Thus, it has become an ideal conservative portfolio, where less risky assets immunize the high risk, associated with high return generating assets.
The balanced portfolio developed in the portfolio management assignment would include only ASX300 and EMEQ with having share of 70.64% and 29.36% respectively. AUBD, CASH, NKY and EMBD are excluded due to its lower returns. S&P500 has not been considered as it provides return at same rate as EMEQ, but have higher risk than the latter. On the other hand, the return rate of USBD is slightly higher than ASX300, but its risk level is quite higher than that of the latter. The maximum amount is allocated to ASX300 due to its moderate return rate and risk level. Thus, this portfolio properly fulfills the balanced investor’s requirement of return and matches with his/her risk bearing capacity.
The high growth portfolio would only consist of EMEQ, as the investor can bear the bear higher risk, associated with it for higher returns. Inclusion of any other lower return generating asset would lead to fall in returns and hence, other assets are not included in the portfolio. Though, S&P500 provides same return as EMEQ, the risk level associated with it is higher than EMEQ. Incorporation of S&P500 would not increase the portfolio return, but increase the portfolio risk unnecessarily. Hence, it is considered as the higher risk would not help the investor to earn higher returns. However, the risk aversion coefficient of the portfolio is still higher than the individual coefficient of the investor. Therefore, there is a scope to include asset with higher risk and higher return than EMEQ.
It can be observed further that inclusion of the international assets would not be helpful for the conservative investor, as the return rate of international portfolio would be same as domestic portfolio, but the risk, associated with the is higher than the latter. The balanced investor can enjoy 1% increase in return along with increasing risk. On the other hand, the high-growth investor would be able to earn 3% higher returns. Hence, it can be stated in the portfolio management assignment that high-growth investors would be benefitted most for the incorporation of international assets.
Minimum Variance Portfolio:
The weights of the asset classes in the minimum variance portfolio would be as follows:
|
|
Weight |
|
ASX300 |
70.64% |
|
AUBD |
0.00% |
|
CASH |
0.00% |
|
USBD |
0.00% |
|
S&P500 |
0.00% |
|
NKY |
0.00% |
|
EMEQ |
29.36% |
|
EMBD |
0.00% |
|
Total |
100.00% |
|
Portfolio Return |
0.48% |
|
Portfolio St.Dev. |
3.70% |
|
Portfolio Variance |
0.14% |
|
Risk Aversion Coefficient |
7.00 |
High-Growth Investor:
|
|
Weight |
|
ASX300 |
0.05% |
|
AUBD |
4.70% |
|
CASH |
92.89% |
|
USBD |
0.00% |
|
S&P500 |
0.81% |
|
NKY |
1.56% |
|
EMEQ |
0.00% |
|
EMBD |
0.00% |
|
Total |
100.00% |
|
Portfolio Return |
0.35% |
|
Portfolio St.Dev. |
0.08% |
|
Portfolio Variance |
0.0001% |
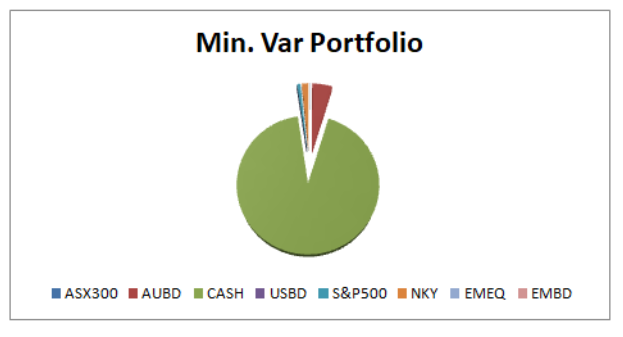
As the name suggests, minimum variance portfolio should have the minimum variance, possible. It can be noted from the table, the minimum variance for the portfolio, prepared by considering the eight assets, would be 0.0001%. The weights are further displayed through the following chart presented in the portfolio management assignment:

The main objective of the portfolio outlined in the portfolio management assignment is to generate returns with minimum risk. Hence, all the riskier assets, such as, USBD and EMEQ have been excluded from the portfolio. EMBD has also not been considered as the risk, associated with his asset, is comparatively higher than the return, provided it. For this same reason, the proportion of ASX300 in this portfolio is lowest. On the other hand, almost 93% of the total investment is allocated to CASH due its lowest risk level amongst all the eight assets.
As it can be observed in the portfolio management assignment, the expected return of this portfolio is 0.35%, which is much lower than all the three optimal risky international portfolios. Therefore, the high-growth investor, who is willing to take higher risk for higher returns, would be affected adversely most for holding minimum variance portfolio.
Conclusion:
From the above analysis on portfolio management assignment, it can be concluded the domestic three-asset portfolios of all the three investors are more profitable than the domestic two-asset portfolio. The international portfolio of conservative investor would associate higher risk than his/her domestic three-asset portfolio, but would not provide any higher return. Hence, conservative investor should invest in the domestic three-asset portfolio instead of international return for the same return at lower risk.
As discussed above within this portfolio management assignment, the domestic three-asset portfolio of balanced investor provides lower return than expectation in accordance with his/her risk bearing capacity. The international portfolio provides optimum return in accordance to his/her risk bearing capacity. Therefore, balanced investor should select the international portfolio. However, it would cause minimal increase in return. Hence, the portfolio should be kept under observation, as it may require re-construction for fall in return rates or increase in risk levels, associated with the selected assets, in future.
The high-growth should opt for the international portfolio due to significantly higher returns in comparison to the domestic three-asset portfolio. However, the current return rate is not the optimum rate for the investor in comparison to his/her risk bearing capacity. Hence, in future, if any asset provides higher return than EMEQ, then such asset even with higher risk level should be included in the portfolio.
The minimum variance portfolio should not be considered as it would not provide desired returns to any of the investors.


