
Data Analytics Assignment: Data Processing Of Life Expectancy Data From WHO
Question
Task:
Data Analytics Assignment Overview
A data analytics project starts with collecting the data and ends with communicating the results from the data. In between, there are multiple steps that are required to be followed- data preprocessing is one of the most important steps among them. The data preprocessing step itself has multiple steps depending on the nature, type, value etc. of the data.
On the other hand, data visualisation uses visual representations to explore, make sense of, and communicate data that often includes charts, graphs, illustrations etc. Today, there is a move towards visualisation that can be observed among many big companies.
For this assignment, students are required to write 1,500 words report on a specific case study and explain the use and applications of data preprocessing and data visualisation techniques on a selected data set. Students can choose any suitable data set that is publicly available on the internet.
Students are required to select a data set and answer the following questions:
- What is the purpose of the data set, and what kind of insights can be extracted from the chosen data set?
- Have you applied any data cleaning approaches (e.g., missing value handling, noisy data handling) for the chosen data set? Explain in your own words what data cleaning approaches you have perform or why it was not required.
- Have you applied any data transformation techniques (normalisation, attribute creation, discretisation etc.) for the chosen data set? What data transformation techniques you have performed or why it was not required to perform any transformation? Explain in your own words.
- Have you applied any data reduction techniques (reduce dimension, reduce volume, balance data) ?If yes, then describe the data transformation technique(s) you have followed; otherwise, explain why no transformation techniques were not required.
- Design an interactive dashboard using 3-4 charts/graphs/illustrations to represent the data.
Answer
Introduction
The concept of data mining explored in the data analytics assignment is one of the leading domains of Information Technology that is leading as well as directing the world. With the advent of technological advancement, everything can be converted into information. These collected data can be stored in the form of tables with relevant types of attributes and values. These large tables are called datasets and they are so called datasets because they are used in data mining and taking out crucial information through analysis. This assignment is based on the concept of data mining which takes in multiple sets of datasets that are used to predict information that is useful. The assignment is primarily focused on data preprocessing which contains data cleaning, data transformation, and data reduction. These three are the most important element of data pre – processing. This assignment utilizes a practical dataset obtained from Kaggle to apply the techniques of data pre – processing using Microsoft Excel.
Overview of the Data
The dataset is the list of countries and their life expectancy which is generated and prepared by the WHO. The importance of this dataset for learning and practising data cleaning, transformation, and reduction techniques. The biggest challenge in this situation is to conduct this pre – processing in MS Excel. The dataset contains 22 columns and 2938 rows of information. The columns are –
Country: Name of the country for which the rest data is given.
Year: The particular year in which the rest of the data was recorded.
Status: Status of the development of the country.
Life Expectancy: Rate of life expectancy.
Adult Mortality: The number of adults dying per thousand people in a year.
Infant Deaths: The number of infants dying per thousand people in a year.
Alcohol: Amount of alcohol per capita for the age 15+ consumption (litres).
Percentage Expenditure: Percentage of the GDP expenditure on health.
BMI: Average Body Mass Index of the population.
Under 5, deaths: Number of deaths of the children below 5 years per 1000 years.
Total Expenditure: Total expense made
GDP: Gross Domestic Product of the company in that particular year.
Population: Population of the country in a particular year.
Thinness (1-19 years): Average thickness of individual in a particular year
Thinness (5-9 years): Average thickness of individual in a particular year
Income Composition of Resources: The composition of income from resources
Schooling: Average schooling years
Data Preprocessing
Data Cleaning
Data Cleaning is the process of removing unwanted or unnecessary content or element from the dataset. The proposition of data cleaning in a dataset is primarily done to remove blank rows, cells, any kind of duplicate values. One can also say that data cleaning allows to make the dataset more representable and non – ambiguous. Data cleaning lets the analyst to work on data and remove all the loose ends that can increase their effort in further and deep analysis (Kathuria, Gupta and Singla, 2021).
Data cleaning will allow the dataset to become more readable and easier to understand, that’s why it will be comfortable to interpret. In incorporates consistency in the data. It provides accurate results and allows the analyst to make better decisions. There is no a particular set of tasks that must be carried out for data cleaning. It is done while working on the dataset and understanding as well as observing the dataset to determine the scope of cleaning.
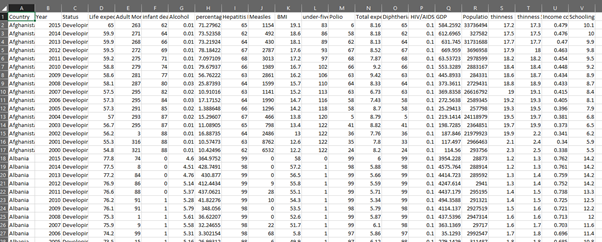
In this data set, the cleaning will begin with auto – fitting the column width. This will make the data more presentable. This can be done by selecting all the columns and then click on ‘Format icon’ on Cells section in Home tab. Then select ‘AutoFit Column Width’. Then the next step is to change the data type of ‘Percentage Expenditure’ column to Percentage. This can be done by clicking on the (%) icon on Number section in Home tab. At the same place, there is an icon to increase the decimal significant point by shifting it to right. The GDP column must be associated with dollar sign along with reducing decimal to only three significant place. This same procedure should be followed for GDP too. The population column must be associated with comma (,) sign to mark the counting system. There are numerous blank cells in the dataset. This has to be deleted along with their complete row by clicking on Find & Select from Editing section of Home tab. Then select ‘Go To’ Special’. Then select Blanks. This will select all the blank the cells. Then on delete arrow in Cells section on Home tab. Then click ‘Delete Sheet Rows (Woo, Kim and Lee, 2020).
Before
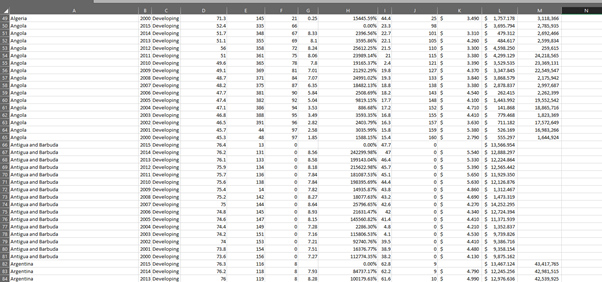
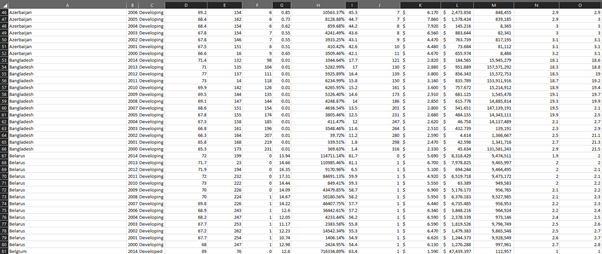
After Data Cleaning
Data Transformation
Data transformation is one of the prominent steps in data pre – processing. The primary notion is to modify the worksheet and change certain elements to reduce its value or within the outliers. There are many techniques for data transformation such as normalization, decertation, attribute creation, etc. The primary attribute associated with data transformation is to change the format or numerical values of the data. Basically, it’s a ETL (Extract Transform Load) process which can be done by adding an excel from Get Data. In this case similar transformation can be done through power Query (Keskar, et al. 2021).
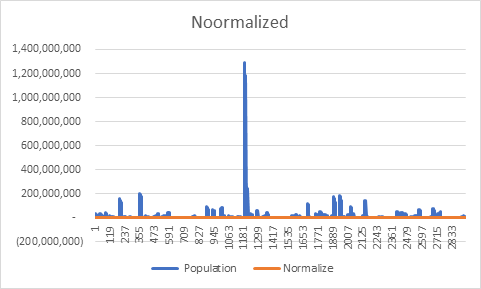
Normalization
The objective of normalization is to reduce its actual magnitude. In other words, it can be said that it is a way to reduce the scale of the data so that it falls in a smaller range.
For this we will normalize population because it’s quite large, so we can normalize it by using excel function. (=Standardize(Population cell, Mean, Standard Deviation).
Manipulation
In the following figure pivot table has been used to concise the data for a statical and narrowed analysis. The pivot table has been created using the columns – Country, Life Expectancy, Adult Mortality, Population, and BMI. The countries are grouped together and din’t had year wise distribution. N the other hand, every other column was in the average form (Rayat, 2018).
|
Row Labels |
Average of Life expectancy |
Average of Adult Mortality |
Average of Population |
Average of BMI |
|
Afghanistan |
58.194 |
269.063 |
9972259.813 |
15.519 |
|
Albania |
75.156 |
45.063 |
696911.625 |
49.069 |
|
Algeria |
74.209 |
102.818 |
24124739.273 |
48.873 |
|
Angola |
50.675 |
362.750 |
10107848.375 |
18.450 |
|
Argentina |
75.238 |
100.385 |
20847453.538 |
54.485 |
|
Armenia |
73.307 |
117.333 |
1063395.933 |
44.027 |
|
Australia |
81.907 |
62.429 |
3541690.500 |
54.929 |
|
Austria |
81.480 |
65.800 |
6330993.933 |
47.667 |
|
Azerbaijan |
71.146 |
119.846 |
1906076.077 |
43.408 |
|
Bangladesh |
69.967 |
135.667 |
45988342.500 |
14.442 |
|
Belarus |
69.747 |
220.267 |
6164016.867 |
54.240 |
|
Belgium |
80.653 |
69.933 |
2324699.000 |
50.040 |
|
Belize |
69.153 |
154.200 |
157799.867 |
39.793 |
|
Benin |
57.708 |
269.308 |
4143771.308 |
19.300 |
|
Bhutan |
65.920 |
231.533 |
472931.533 |
17.120 |
|
Bosnia and Herzegovina |
76.182 |
63.545 |
1813739.455 |
48.509 |
|
Botswana |
55.407 |
460.933 |
1119512.067 |
31.867 |
|
Brazil |
73.273 |
151.267 |
93830194.800 |
46.460 |
|
Bulgaria |
72.740 |
124.733 |
5165119.467 |
53.753 |
|
Burkina Faso |
57.233 |
224.000 |
7680183.333 |
16.644 |
|
Burundi |
56.027 |
257.455 |
3842748.455 |
15.791 |
|
Cabo Verde |
72.623 |
110.615 |
281645.846 |
24.238 |
|
Cambodia |
66.433 |
154.778 |
6493229.556 |
16.489 |
|
Cameroon |
54.860 |
305.500 |
8580129.900 |
25.780 |
|
Canada |
82.233 |
66.750 |
14844926.833 |
54.267 |
|
Central African Republic |
51.417 |
444.833 |
3072260.333 |
14.933 |
|
Chad |
52.286 |
322.143 |
7677454.571 |
17.500 |
|
Chile |
79.944 |
78.333 |
15251788.889 |
54.578 |
|
China |
74.140 |
73.000 |
334124.733 |
21.067 |
Data Reduction
The most common method of reducing data during pre – processing is done either by removing some portion of the data or grouping two different data. The important aspect of grouping is the dimension, attributes, and domain of the data. The primary objective of conducting data transformation is to establish a relationship between different variables whether they are dependent or independent. It also allows you to minimize the sizer of worksheet to prevent any type of clogging due to presence of huge data. The primary notion of reducing data came into existence because of the concerns associated with storage. There are many ways to reduce data such as compression, data deduplication (Zanna, et al.).
In the given dataset, there are certain attributed that can be eradicated. Since the primary objective of the dataset was to showcase life expectancy of countries. This thing can be shown either country wise or year wise. Thus, rest other column will be removed and at first year wise life expectancy will be given and then country wise. This can be achieved by selecting the appropriate columns for the reduction. In this case, the columns that will be selected are country, year, and life expectancy.
Dashboard Design
The dashboard design contains all the important visualization that would be the results of the changes made in Data cleaning, transformation, and reduction process. It would also involve important insights (Tiew, Lim and Sivagnanasithiyar, 2020).
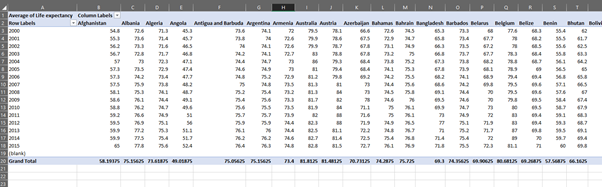
Data Reduction (Year wise, life expectancy)
The country is taken on the column side with year on the rows.
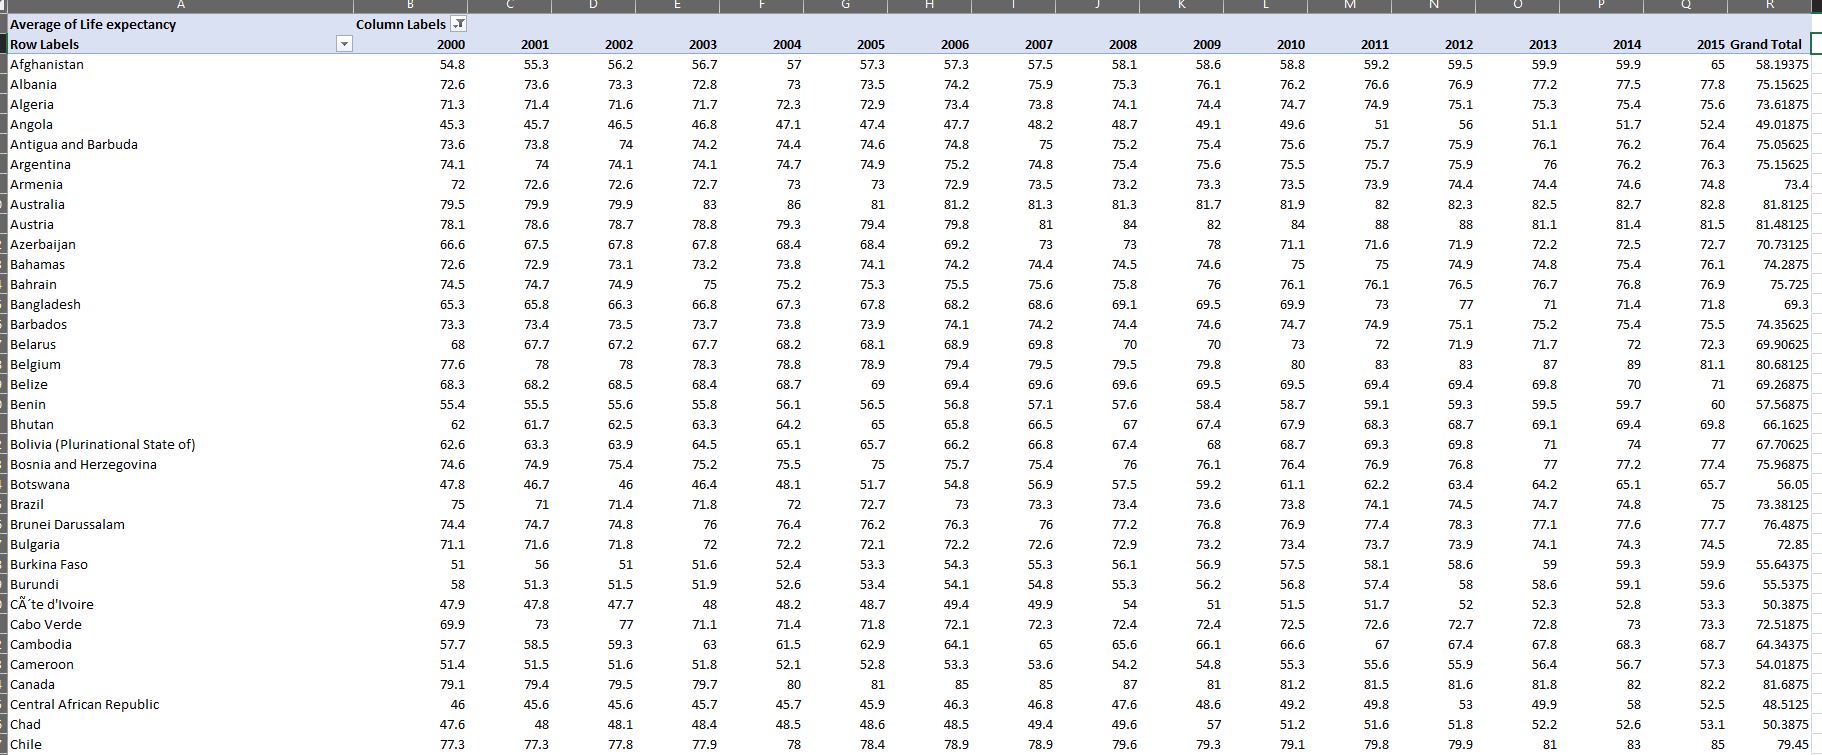
Data Reduction (Country wise, life expectancy)
The country is taken on the row side with year on the column.
Conclusion
The paper was based on pre – processing of data which is focused upon real - world problems or challenges. The content and techniques of pre – processing is a primary problem that must be understood and well known before beginning analysis. Analysts and Data Scientists are quite largely involved in the processes of data mining and analysis to standardize important information. The primary steps to mining and analysis are data cleaning, transformation, and reduction. Each of these tasks has numerous techniques and they are carried out for a particular purpose. The paper has used a dataset to represent these methodologies applied in MS Excel. The objective of this assignment was to practically imply theoretical information on real - world data. Data pre – processing seems to be extremely important as it reduces the burden of analysts up to a great extent. The paper has successfully employed the techniques in an appropriately applicable manner.
References
Kathuria, A., Gupta, A. and Singla, R.K., 2021. A Review of Tools and Techniques for Preprocessing of Textual Data. Computational Methods and Data Engineering, pp.407-422.https://link.springer.com/chapter/10.1007/978-981-15-6876-3_31
Woo, H., Kim, J. and Lee, W., 2020. Validation of Text Data Preprocessing Using a Neural Network Model. Mathematical Problems in Engineering, 2020.https://www.hindawi.com/journals/mpe/2020/1958149/
Keskar, V., Abdufattokhov, S., Phasinam, K., Wenda, A., Jagtap, S.T. and Ventayen, R.J.M., 2021. Big Data Preprocessing Frameworks: Tools and Techniques. Data analytics assignment Design Engineering, pp.1738-1746.http://www.thedesignengineering.com/index.php/DE/article/view/1729
Rayat, C.S., 2018. Applications of Microsoft Excel in Statistical Methods. In Statistical Methods in Medical Research (pp. 139-146). Springer, Singapore.https://link.springer.com/chapter/10.1007/978-981-13-0827-7_15
Zanna, B., Ibrahim, U.A., Goni, A.A. and Sanda, I.G., Challenges of Microsoft excel in statistical analysis on Education: A case study of federal college of freshwater fisheries technology, Baga, Borno State, Nigeria.https://www.allmultidisciplinaryjournal.com/archivesarticle/2021.v2.i4.338.pdf
Tiew, S., Lim, C. and Sivagnanasithiyar, T., 2020. Using an excel spreadsheet to convert Snellen visual acuity to LogMAR visual acuity. Eye, 34(11), pp.2148-2149.https://www.nature.com/articles/s41433-020-0783-6


