
Psychology Assignment: Investigating Fraudulent & Valid Passports
Question
Task:
Instructions for psychology assignment:
Faces convey a wealth of information (identity, emotion, age…) critical for the success of our everyday social interactions. Though humans are generally very good at processing this information, many studies have indicated that this ability is not equally distributed across all faces that we encounter, and that processing of facial information is superior for ingroup relative to outgroup faces. Among the most widely investigated examples of this phenomenon are the own-race and own-age biases in face processing. For example, multiple studies have shown that memory (old vs new) and discrimination (same vs different) is superior for faces of one’s own race or ethnicity and age group compared to faces of another race or ethnicity or age group.
Imagine that you have been hired as a researcher to help investigate whether the ability to discriminate doctored passport photographs from real passport photographs depends on:
- the age of participants (Age Group A vs Age Group B) and the age of a person depicted in the photograph (Same Age Group vs Different Age Group)
- the ethnicity of participants (Ethnicity Group A vs Ethnicity Group B) and the ethnicity of a person depicted in the photographs (Same Ethnic Group vs Different Ethnic Group)
Select ONE of these two research questions and design a study using a Signal Detection Theory approach to investigate it. Your answer should be written-up as Method and Results section of the research report.
Answer
Introduction
This psychology assignmentis widely associated with a hypothetical dataset that will aid the process of investigating fraudulent and valid passports. This has been based on the idea that the dataset shows a vivid plethora of participants termed "group A and group B.” This will be further taken into consideration and compared to the photographs with similar groups. The process associated with the study is related to “Signal detection theory” and will be related to various statistical tools such as descriptive and inferential statistics. This will be critical for the practice and validity of the dataset related to psychology.
Method for analysis: Signal Detection Theory
Wixted(2020) and Lee& Penrod(2019) contradict that deciding on a specific detection method or technique is an essential prospect of any psychological development. Therefore, in this case, the "signal detection theory" has been considered. This has been explained with the help of figure 1 as the visual manifestation of the theory. The basic idea of the theory is related to measuring the potential difference among various associated datasets and entities. The mentioned is further accountable for observing random patterns and building meaningful information through the same. However, this is not a mandate to use statistical tools for the same.
Background or contextual information plays a significant role in using the signal detection theory. In this case, the approach has been related to various statistical tools associated with the relative identification and comparing invalid to valid passports based on images and documented age of an individual. Tsikandilakis& Chapman(2018) and Jernberg, Lehtiniemi& Uusitalo(2017) further argue that the signal detection framework is an influential framework that could be associated with "perpetual decision-making” processes.
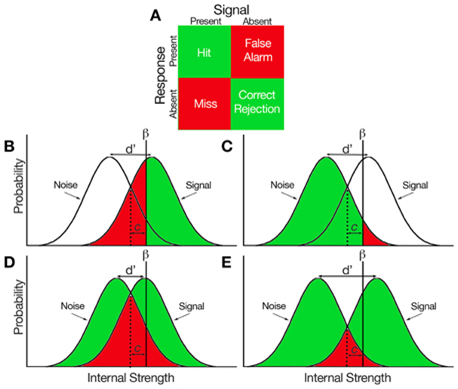
Figure 1: Signal detection theory
(Source: Frontiers, 2017)
Design
Research problem: Using two sets of data (group A and B) based on the biological age of individuals to photographs to determine fake and real passports.
The primary approach associated with the study will be based on the signal detection theory. This will be based on the hypothetical dataset related to the study.
Participants
It is essential to note that the data is composed of numerous individuals. However, all participants are hypothetical as the dataset is hypothetical by nature. Therefore, there was no exclusion or recruitment criteria associated with the same.
Materials
The materials used for the research has been related to software and data analytics tolls related to Microsoft Excel. This has been further related to supporting literature for external studies and implementing statistical frameworks.
Procedure
The analysis composed of descriptive statistical that related to bias and sensitivity analysis. This was further associated with an inferential statistics as the final decision making process that related to paired t-tests for inducing signal detection approach.
Data analysis
The data analysis has been related to using the signal detection methods. However, this is often related to the process of choosing the primary dataset. The use of the framework could be established as immediate implantation that accounts for psychological state. Hence, highly competent decisions are often made using the same framework. This accounts for real-life choices that could be ensured through the same. While a positive hit can be related to differentiation more than 1, the negative hit could be related to similarities within the analysis.
Analysis and Discussion
This section of the study has been associated with the overall demographics of the dataset. Xia& Sun(2017) and Ranganathan, Pramesh& Aggarwal(2017) argue that establishing the entire dataset will be critical for overcoming the research question. This could be associated with the potential difference related to the variability and related visual assets. However, it is essential to note that the variability has been based on various filters such as the gender and the group for the mentioned data. This is fundamentally based on the idea that the total number of entries is 200, where 100 belong to group A and the rest in group B.
|
Demographics: Age |
|
|
Count |
200 |
|
Null |
0 |
|
Mean |
42.1 |
|
Standard deviation |
20.9 |
|
Maximum |
71 |
|
Minimum |
19 |
|
Demographics: Gender – Male (m) |
|
|
Count |
54 |
|
Null |
0 |
|
Mean |
37.4 |
|
Standard deviation |
20.4 |
|
Maximum |
70 |
|
Minimum |
19 |
|
Demographics: Gender – Female (f) |
|
|
Count |
146 |
|
Null |
0 |
|
Mean |
43.6 |
|
Standard deviation |
20.9 |
|
Maximum |
71 |
|
Minimum |
19 |
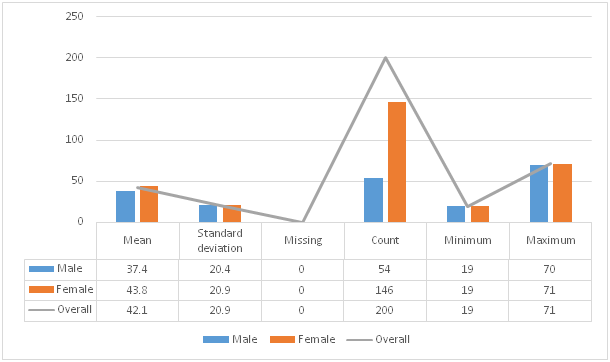
Figure 2: Overall visualisation
(Source: Generated by the researcher)
The following table has been generated while considering the age groups as A and B for the study. This could be related to the appreciation that data analytics tools and filters had to be used to gain the results.
Demographics: Age Group – Group A
|
Demographics: Age Group – Group A |
|
|
Count |
100 |
|
Null |
0 |
|
Mean |
21.4 |
|
Standard deviation |
1.7 |
|
Maximum |
28 |
|
Minimum |
19 |
|
Demographics: Age Group – Group A |
|
|
Count |
100 |
|
Null |
0 |
|
Mean |
62.8 |
|
Standard deviation |
3.04 |
|
Maximum |
71 |
|
Minimum |
57 |
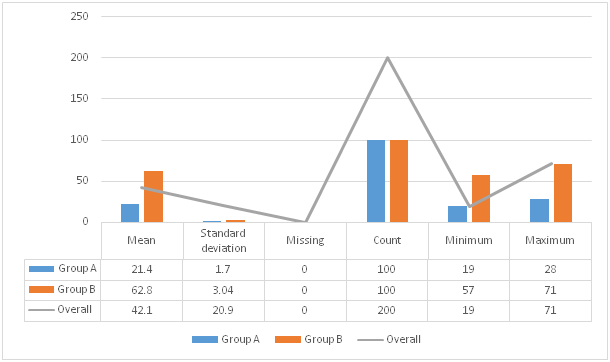
Figure 3: Group-based comparison
(Source: Generated by the researcher)
Descriptive Statistics
Kaur, Stoltzfus& Yellapu(2018) and Mishra et al., (2019) argue that descriptive statistics, in this case, could be related to statistical summary. This can be further accounted with summarising the findings through various approaches. However, in this case, "sensitivity” and “bias" analysis has been completed. This will account for relative description that can be plotted in a well-addressed graph. Thus, the following data assets have been observed:
Sensitivity analysis – Age Group
|
Sensitivity analysis – Age Group |
|||
|
|
Group |
Similarity |
Difference |
|
Mean |
Group A |
1.45 |
1.27 |
|
|
Group B |
1.49 |
1.43 |
|
Standard deviation |
Group A |
0.585 |
0.514 |
|
|
Group B |
0.79 |
0.621 |
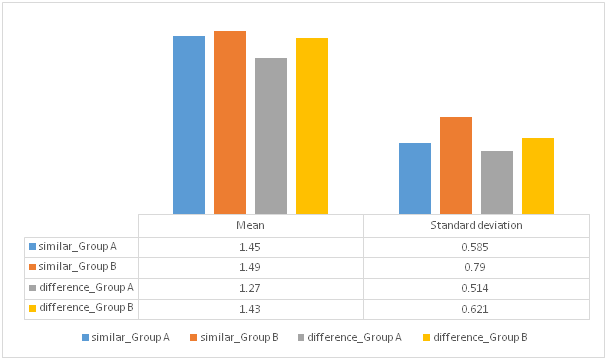
Figure 4: Sensitivity analysis
(Source: Generated by the researcher)
Bias analysis – Age Group
|
Bias analysis – Age Group |
|||
|
|
Group |
Similarity |
Difference |
|
Mean |
Group A |
0.883 |
0.803 |
|
|
Group B |
0.606 |
0.69 |
|
Standard deviation |
Group A |
0.605 |
0.249 |
|
|
Group B |
0.381 |
0.368 |
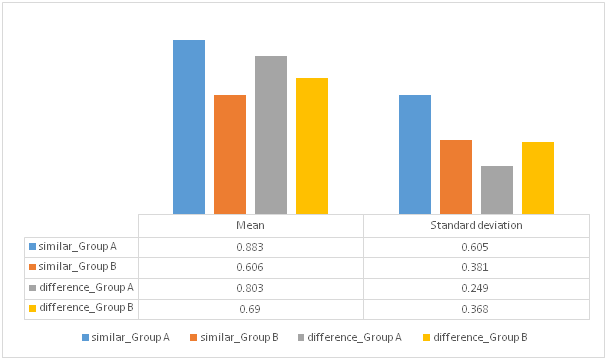
Figure 5: Bias (beta) analysis
(Source: Generated by the researcher)
Inferential Statistics
Amrhein, Trafimow& Greenland(2019) critically expresses that there are various tools that can be easily used for addressing the prospects of inferential statics. It has been noted that the mentioned is related to processing available data based on specific properties. This can be further associated with the prospects of measurement and the relative hypothesis that will determine the signal detection theory associated with the study. This will be related to testing the available data, while in most cases, this is related to testing the hypothesis placed for the study. In this case, the process will determine various levels of variability. The mentioned has been accounted for with senility and bias analysis. It is essential to note that sources confirm the use of ANOVA as the primary tool. However, this will complicate the findings and the process of measurement.
It is essential to note that t-test has been taken into consideration for the study. This could be associated with measuring the independence of the variables and variability of observing the possibility of identifying fake from real passports using documented pictures from statistical data.
Paired sample t-test – Sensitivity analysis
|
Paired sample t-test – Sensitivity analysis |
|
|
Statistics |
4.67 |
|
df |
199 |
|
p |
<0.001 |
|
Mean difference |
0.121 |
|
SE difference |
0.0259 |
|
Paired sample t-test – Bias analysis |
|
|
Statistics |
-0.0796 |
|
df |
199 |
|
p |
0.937 |
|
Mean difference |
-0.00225 |
|
SE difference |
0.0283 |
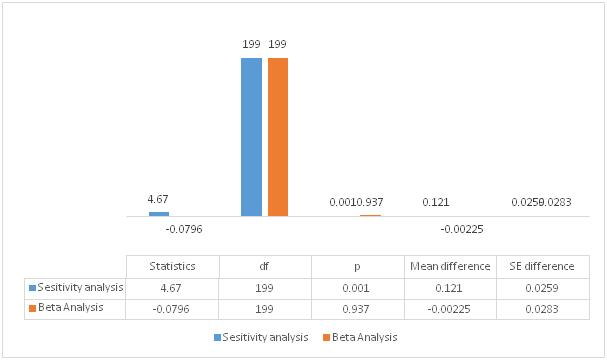
Figure 6: Comparative t-test
(Source: Generated by the researcher)
Based on the available data, there are some alarming aspects that have been observed through the analysis. This could serve as the primary base of understanding associated with the t-test analysis. While the observed data is vividly similar, the changes in some observations could be related to similar or different prospects of biasness for distinct age groups. Here the age groups are associated with “Group A and Group B.”
- Group A and B are two groups with varied parameters. This could be related to the idea which relates to their reliability with the photos of the individual. Therefore, it will be critical to compare the similarity and difference index for various age photos to observe the possibilities of “false positives.” This can be similarly stated for an instance of “false negative" as the potential error-index is unknown.
- Paired t-test reveals essential details related to the appreciation of various ideas. This can be further accounted for with the theoretical theories that demonstrate similar age groups based on bias analysis. This cannot be mentioned for sensitivity analysis as this is a widely different approach from the mentioned. Hence, the possibility of determining an actual or valid passport from a fake one is relatively high.
- The consideration of an independent t-test will be somewhat high as this will be associated with observing different group comparisons. This can be related to the idea that an independent t-test is related to addressing both groups with relation to group behaviour and conditions. However, such data needs to be assumed as the comparison with photographs could be accounted for with the same vs different comparison with 5% error possibilities.
Conclusion
It can be widely summarised that this study is widely based on the hypothetical dataset. This dataset is based on the possibility of comparing and observing real to fake passports through critical analysis. However, it is essential to note that the lack of error index could be associated with the ongoing 95% confidence through all statistical analyses. Hence, considering the idea that such analytical processes will be effective.
Reference
Amrhein, V., Trafimow, D., & Greenland, S. (2019). Inferential statistics as descriptive statistics: There is no replication crisis if we don’t expect replication. The American Statistician, 73(sup1), 262-270. https://www.tandfonline.com/doi/pdf/10.1080/00031305.2018.1543137
Jernberg, S., Lehtiniemi, M., & Uusitalo, L. (2017). Evaluating zooplankton indicators using signal detection theory. Ecological Indicators, 77, 14-22. https://www.researchgate.net/profile/Susanna-Jernberg/publication/313683124_Evaluating_zooplankton_indicators_using_signal_detection_ theory/links/5996e6400f7e9b91cb174bbc/Evaluating-zooplankton-indicators-using-signal-detection-theory.pdf
Kaur, P., Stoltzfus, J., & Yellapu, V. (2018).Descriptive statistics. International Journal of Academic Medicine, 4(1), 60.https://www.ijam-web.org/article.asp issn=2455-5568;year=2018;volume=4;issue=1;spage=60;epage=63;aulast=Kaur Lee, J., & Penrod, S. D. (2019). New signal detection theory-based framework for eyewitness performance in lineups. Law and human behavior, 43(5), 436.https://par.nsf.gov/servlets/purl/10139642
Mishra, P., Pandey, C. M., Singh, U., Gupta, A., Sahu, C., & Keshri, A. (2019).Descriptive statistics and normality tests for statistical data. Annals of cardiac anaesthesia, 22(1), 67.https://www.ncbi.nlm.nih.gov/pmc/articles/PMC6350423/
Ranganathan, P., Pramesh, C. S., & Aggarwal, R. (2017). Common pitfalls in statistical analysis: logistic regression. Psychology assignmentPerspectives in clinical research, 8(3), 148.https://www.ncbi.nlm.nih.gov/pmc/articles/pmc5543767/
Tsikandilakis, M., & Chapman, P. (2018). Skin conductance responses to masked emotional faces are modulated by hit rate but not signal detection theory adjustments for subjective differences in the detection threshold. Perception, 47(4), 432-450. https://nottingham-repository.worktribe.com/preview/923034/Perception.pdf
Wixted, J. T. (2020). The forgotten history of signal detection theory. Journal of experimental psychology: learning, memory, and cognition, 46(2), 201. http://wixtedlab.ucsd.edu/publications/wixted2019/The_Forgotten_History_of_Signal_Detection_Theory.pdf
Xia, Y., & Sun, J. (2017).Hypothesis testing and statistical analysis of microbiome. Genes & diseases, 4(3), 138-148.https://www.sciencedirect.com/science/article/pii/S2352304217300351


