
(BM533) Economics assignmenton microeconomics and behavioural economics with reference to FamilyDollar Groceries
Question
Task: In your economics assignment explain the law of Demand, movement along the same demand curve (with the aid of table and diagram) and changes in demand curve with influencing factors (with the aid of diagram). Explain the law of Supply, movement along the same supply curve (with the aid of table and diagram) and changes in supply curve with influencing factors (with the aid of diagram). Select two (2) emerging theories or models of 21st century contemporary economics of your choice and two 20th century theories or models of your choice. You are to compare and contrast and relate both to modern business practices.
Answer
TASK 1 of the economics assignment
1.1 Law of demand and its movement along the same demand curve
The law of demand highlights that the demanded quantity of goods has an inverse relationship with its price when all the other relevant factors are kept constant (ceteris paribus). It indicates that the increasing price leads to the decreasing demand for the goods and services offered by any business (Mazurek et al. 2019). The law of demand mentioned in the economics assignmentis considered one of the most important and fundamental principles in macroeconomics and is usually implemented with the law of supply for the efficient allocation of resources in an economy. The grocery store might implement the learnings from the law of demand and supply into their stores in order to bring consistency to their sales value and increase their business. According to the comments of Martin (2019), diminishing marginal utility is considered an integral part that follows the law of demand and is able to explain the demand for the product and services available in the market. As per the economics assignmentthe diminishing marginal utility explains the fact that customers usually purchase the first unit of any economic goods in order to serve their most important needs. The purchase of each of the additional units of any product or service by the customer diminishes as its value ends.
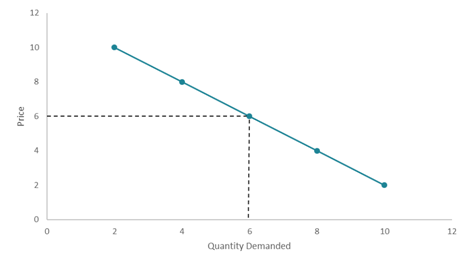
Figure 1: Demand Curve
(Source: Corporatefinanceinstitute.com, 2022)
It is found in the economics assignmentthat the market demand is able to portray the sum of quantity that is demanded at each of the different prices across all the customers in the market. The changes in the prices of any product or services easily available in the market are usually reflected in the movement along the demand curve. According to the views of Buechner (2018), the law of demand and supply primarily focuses on the most urgent needs and demand over the less urgent requirements in the economic behaviour of the customers. Moreover, the shape of the demand curve depicted in the economics assignmentvaries according to the different goods and services that are available in the market and in most cases; the shape is usually concave in nature. FamilyDollar groceries can increase the sales of some of the products that are available in the store which are of the immediate need to the customers in the market. However, it is important to distinguish the difference that is present between the quantity that is demanded and the demand for the product. The demand usually represents the relationship that is available between the quantity demanded and the prices of the goods (Cho et al. 2019). On the other hand, the quantity demanded is usually the number of products that a customer is willing to pay for at a particular price point in the market.
As per the economics assignmentanalysis the quantity demanded of particular commodity changes due to the changes in its price in the market by keeping all the other factors constant is considered as the change in the quantity demanded. This particular scenario is usually represented or expressed as a form of movement along the same demand curve. The moment in the demand curve can either be upward (contracted demand) or downward movement (expanded demand) along the same curve. Considering the movement along the demand curve from figure 2
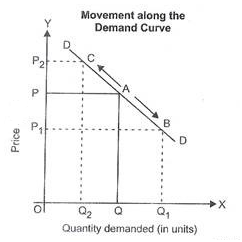
Figure 2: Movement along the demand curve
(Source: Yourarticlelibrary.com, 2022)
A. The expansion in the demand curve seen in the economics assignmenthas a downward movement while moving from A to B. Under these circumstances, it can be seen that the quantity that is being demanded has increased from OQ to OQ1, due to the decrease in price from OP to OP1.
B. The contraction in the overall demand can be seen in the upward movement from A to C. The quantity that is being demanded has decreased from OQ to OQ1. As per the economics assignmentthe decrease in demand is due to the increase in price from OP to OP2.
The quantity OQ is the price that is being demanded of OP.
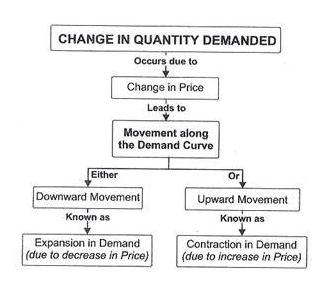
Figure 3: Changes in the demand
(Source: Yourarticlelibrary.com, 2022)
Expansion in demand
Downward movement can be seen in the demand curve mentioned in the economics assignment
Also known as an increase in quantity that is being demanded or an extension in demand.
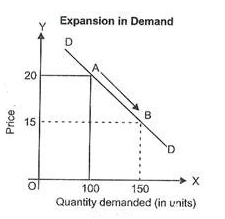
Figure 4: Expansion in the demand
(Source: Yourarticlelibrary.com, 2022)
|
Price |
Demand(units) |
|
$50 |
100 |
|
$25 |
150 |
|
$20 |
200 |
It can be clearly seen from the table mentioned in the economics assignmentthat a decrease in the price of the product leads to an increase in demand for the product in the market.
Contraction in demand
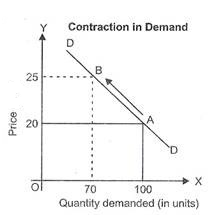
Figure 5: Contraction in demand
(Source: Yourarticlelibrary.com, 2022)
|
Price |
Demand(units) |
|
$20 |
100 |
|
$25 |
70 |
FamilyDollar groceries have to understand the concept of demand and supply curve and have to work on providing the best deals at lower prices of the essential products to the customers in order to increase the sales figure of the company.
Factors influencing the changes in the demand curvementioned in the economics assignment
Price of the product
The price of a related product can create changes in the demand curve. For instance, it can be seen in the economics assignment that an increase in the number of members in a family can increase the demand for clothing. The increase in economic resources of a country can lead to an increase in consumption of the customers which can be seen in the demand curve associated with a particular product in the country (Bulturbayevich and Ismatullayevich, 2021).
Figure 6: Shift in the demand curve due to income of the people
(Source: Khanacademy.org, 2022)
According to figure 6 in the economics assignment, it can be ascertained that higher income levels shift the demand curve towards right D1. The citizens of a country have more money at their disposal on average, therefore, their purchasing power of the products increases at a particular price therefore increasing the demand in the quantity (Styhreet al. 2022). On the other hand, the decrease in income of the citizens leads to an opposite effect causing the demand curve to move towards the left D2. Therefore people having less disposable income tend to purchase less from the market therefore decreasing the demand for the quantity.
Changes in the preferences or taste
It is found in this economics assignmentthat the changes in the preferences or taste of a particular product or a service can create or influence some changes in the demand curve. According to the views of Khaloieet al. (2021), an increase in demand for a particular product or a service in a market can be linked to the change in preferences or tastes of the customers of that particular market segment. According to the department of agriculture USA (USA), chicken conjunction by Americans increase from 48 pounds to 85 pounds per year as compared to the consumption of beef decreased from 77 pounds to 54 pounds per year (Ibisworld.com, 2022). The data mentioned in the economics assignment clearly suggest that a shift in the demand curve can be a reason because of the change in preferences and tastes of the customers in the market.
Changes in the composition of the population
As per the economics assignmentfindings, the changes in the composition of the population will increase or decrease the demand for certain products in the market according to the need. For instance, an increase in the number of children in a particular demographic location will lead to an increase in the demand for products associated with children such as care facilities or tricycles. Similarly, changes in the demographics of a population such as an increase in elderly individuals will lead to an increase in demand for nursing homes (Basso and Rachedi, 2021).
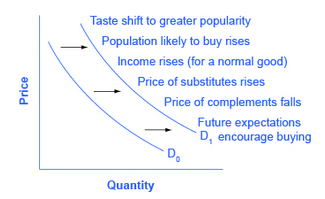
Figure 7: Factors that increase the demand
(Source: Khanacademy.org, 2022)
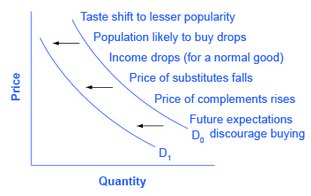
Figure 8: Factors that decrease the demand
(Source: Khanacademy.org, 2022)
1.2 Law of supply and its movement along the same supply curve
As per the economics assignmentthe law of supply states that the price of services or goods increases the quantity of the services are offered by the supplier will either increase or decrease keeping all the other factors constant. The law also highlights the fact that suppliers of a particular product will try to maximize profits by increasing the number of items for sale if the price of that particular product increases (Otero, 2022).
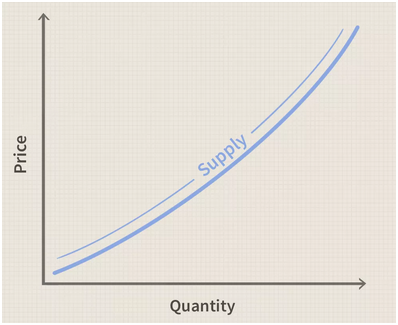
Figure 9: Supply curve
(Created by the author)
The shift in the supply of the movement along the supply curve helps in explaining the changes in the supply of a product due to the change in its price or the availability of the quantity in the market. The classifications of the movements of the supply curve are mentioned in the economics assignment
Extension of supply
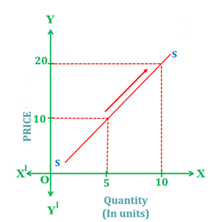
Figure 10: Extension of supply
(Source: Created by the author)
The quantity of supplied commodity increases with the increase in price and can be considered as the extension of supply while other things are constant.
|
Price |
Quantity supplied |
|
$10 |
5 |
|
$20 |
10 |
Contraction of supply
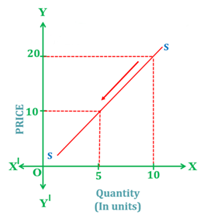
Figure 11: Contraction of the supply
(Created by the author)
The quantity of supply commodity can be seen in the economics assignmentdecreases with the decrease in price is known as the contraction of the supply by keeping the other factors constant.
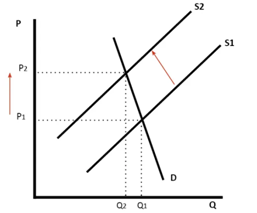
Figure 12: A left shift in the supply curve
(Created by the author)
According to figure 12 in the economics assignment, the factors that have influenced the supply curve and have reduced the overall supply of the goods are
Reduction in the number of suppliers in the market
Bad weather for agriculture
Higher taxes
Decrease of productivity of the workers
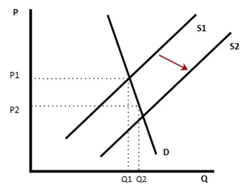
Figure 13: Right shift in the supply curve
(Created by the author)
According to figure 13 in thev, the factors that have influenced the supply curve and have increased the supply of the goods are
Increase the number of producers
Improvement of the technology in therefore reduction in the cost of production
Lower tax rates
Increase of subsidies of the government
TASK 2 of the economics assignment
Introduction
The modern day economy is quite complex in nature and requires limited allocation of resources to generate output or a large number of individuals. It is found in the economics assignmentthat economic models usually consist of various types of mathematical equations that are suitable for explaining economic behaviour and help in building clues about the functioning of an economy in general. There are various models and theories that function to provide a detailed analysis of their impact on the modern-day economy and the functioning of the various economic institutions.
Solow swan model and Cobb Douglas production function discussed in the economics assignment
The Solow-Swan model also known as the exogenous growth model is one of the long-running economic growth models of the 20th century and it attempts to explain economic growth by undertaking population growth, capital accumulation and increasing productivity which are largely driven by technological progress (Li and Li, 2022). On the contrary, Cobb Douglas's production function only takes into consideration the technological relationship between two or more two inputs that are used for receiving the output in the production factory or a manufacturing plant (Zhang et al. 2020). According to the economics assignmentfindings, present-day businesses and manufacturing units are able to increase their productivity through technological progress and the use of capital resources to improve the quality of manufacturing machines. Mathematically the Solow- Swan model can be considered a nonlinear system that comprises only one differential equation for the evolution of the capital of the per capita stock. This particular model is able to protect long-running economies and is also able to highlight the fact that permanent growth for a modern-day business enterprise is only achievable with the help of technological progress. However, the Cobb-Douglas model mentioned in the economics assignmenthas a utility function that often avoids natural units like the production function. According to the views of Britto et al. (2021), the maximisation of consumer utility in terms of budget constraints can be achieved if the cost of goods is much lower than the wealth gathered by that particular customer. Modern-day businesses are able to utilise the findings from both models and create a long-term positive impact on the growth and development of the business. The efficient allocation of capital resources can be considered an important factor that ensures the growth and development of businesses in the long term. The model mentioned in the economics assignmenthas been developed in the 20th century to analyse the situation of the market in those areas. However, in recent times, there have been multiple changes in the manner the current economics of large countries function which makes it obsolete for these theories to analyse the current situation.
DSGE model-based estimation of Keynesian Phillips curve and loanable funds model
The DSGE or dynamic stochastic general equilibrium model is an important price-setting equation for business enterprises that helps in the adjustment of nominal prices of costly items. This particular equation helps in the development of a link between inflation for the future and current marginal cost which is also known as NKPC or New Keynesian Phillips model (McKnight et al. 2020). On the contrary, the loanable funds model addressed in the economics assignmentuses supply and demand for showing the rate of interest which is determined by the interaction between the suppliers of money and the investors who are borrowing the money from the market. According to this particular theory the savers or investors are responsible for funding the economic growth of a country. The borrowers utilise the money that has been provided by the savers to provide funding for their own compensation and needs. According to the comments of Gudgeonet al. (2020), the supply of loanable funds is the key factor that helps in the overall growth and development of the economy. Modern-day businesses are running on investments coming from investors and help them in converting their money to profitable outcomes in the market. On the other hand, NKPC parameters addressed in the economics assignmentare usually estimated with the help of regression of the inflation which is based on the addition of the future expected marginal costs that have been discounted. These two models of contemporary economics have been quite beneficial for businesses.
Loanable funds are considered the largest supplier of financial resources to businesses that are trying to sustain themselves in the volatile market of the current scenario. According to the comments of Lee and Lee (2019) in the economics assignment, the investments that are coming into the market directly have an impact on the demand and supply of a particular product or service within that particular period of time. For instance, the sudden availability of funds for a business that is involved in a manufacturing sector can increase its production and reduce the prices of the product in the market which in turn will significantly increase the demand for the product within a very short span of time. Moreover, the surplus in the supply of funds from the savers according to the loanable funds model increases the area of operation of the businesses that are operating in the current market, therefore it is found from the economics assignment, increasing the scope of performance of all the companies that are running their business operations with the help of the investors.
Recommendation
The models mentioned in the economics assignmenthave been estimated to provide all the necessary details that will highlight and analyse the current scenario of the economy in the United Kingdom. There are many aspects that take into consideration the Cobb Douglas production function for the development of technology relationships between more than two inputs in a production or manufacturing plant. According to the views of Rahim et al. (2019), the manufacturing units of the United Kingdom have faced numerous problems due to the current economic state of the country. It is recommended in the economics assignmentthat the current economic situation will be able to mostly benefit from this particular economic theory from the 21st century. The manufacturing unit of an economy of a country takes into consideration a linear system that is completely based on the manner manufacturing units are able to comprehend their performance in the market. Therefore it is recommended in the economics assignmentthat this particular theory will be beneficial for the overall growth of the current economic condition of the United Kingdom.
Conclusion
It can be concluded from the economics assignmentthat economic models are considered the heart of economic theory and provide a logical and abstract template for organising the thoughts of economic analysts. These models are quite helpful and beneficial for economists to think logically and isolate the complicated causes and effects that have the capability of influencing various other interactive elements of the economy. It was further found out in the economics assignment, economic models provide an experimental ground for different scenarios in an attempt to evaluate the impact of alternative options that are being developed to manage the economies of large countries around the world with the help of different scenarios and arguments. The models of contemporary economics are quite useful for presenting economic arguments in a manner that is visually pleasing to the eyes.
References
Basso, H.S. and Rachedi, O., (2021). The young, the old, and the government: Demographics and fiscal multipliers. American Economic Journal: Macroeconomics, 13(4), pp.110-41.
Britto, A., Dehler-Holland, J. and Fichtner, W., (2021). Optimal investment in energy efficiency as a problem of growth rate maximisation (No. 56). Working Paper Series in Production and Energy.
Buechner, M.N., (2018). A comment on the law of supply and demand. Journal of Philosophical Economics, 11(2), pp.67-80.
Bulturbayevich, M.B. and Ismatullayevich, S.I., (2021). THE IMPORTANCE OF THE IMPLEMENTATION OF VERTICAL INTEGRATION PROCESSES IN THE DEVELOPMENT OF INNOVATIVE ACTIVITIES IN INDUSTRIAL ENTERPRISES. Web of Scientist: International Scientific Research Journal, 2(06), pp.220-228.
Cho, S.J., Chung, C.Y. and Young, J., (2019). Study on the Relationship between CSR and Financial Performance. Sustainability, 11(2), p.343.
Corporatefinanceinstitute.com, (2022).Law of Demand.Available at:https://corporatefinanceinstitute.com/resources/knowledge/economics/law-of-demand/[Accessed on 20th October 2022]
Gudgeon, L., Werner, S., Perez, D. and Knottenbelt, W.J., (2020, October). Defi protocols for loanable funds: Interest rates, liquidity and market efficiency. In Proceedings of the 2nd ACM Conference on Advances in Financial Technologies (pp. 92-112).
Ibisworld.com, (2022).Per Capita Poultry Consumption.Available at:https://www.ibisworld.com/us/bed/per-capita-poultry-consumption/42/[Accessed on 20th October 2022]
Khaloie, H., Anvari-Moghaddam, A., Hatziargyriou, N. and Contreras, J., (2021). Risk-constrained self-scheduling of a hybrid power plant considering interval-based intraday demand response exchange market prices. Journal of Cleaner Production, 282, p.125344.
Khanacademy.org, (2022).What factors change demand.Available at:https://www.khanacademy.org/economics-finance-domain/microeconomics/supply-demand-equilibrium/demand-curve-tutorial/a/what-factors-change-demand[Accessed on 20th October 2022]
Lee, H. and Lee, S.H., (2019). The impact of corporate social responsibility on long-term relationships in the business-to-Business market. Sustainability, 11(19), p.5377.
Li, B. and Li, Y., (2022). On a chemotaxis-type Solow-Swan model for economic growth with capital-induced labor migration. Journal of Mathematical Analysis and Applications, 511(2), p.126080.
Martin, S., (2019). The Kaldor–Hicks potential compensation principle and the constant marginal utility of income. Review of Industrial Organization, 55(3), pp.493-513.
Mazurek, J., García, C.F. and Rico, C.P., (2019). The law of demand and the loss of confidence effect: An experimental study. Heliyon, 5(11), p.e02685.
McKnight, S., Mihailov, A. and Rumler, F., (2020). Inflation forecasting using the New Keynesian Phillips Curve with a time-varying trend. Economic Modelling, 87, pp.383-393.
Otero, S., (2022). The law of supply and demand rules monolignol transport.
Styhre, A., Brorström, S. and Gluch, P., (2022). The valuation of housing in low-amenity and low purchasing power city districts: social and economic value entangled by default. Construction Management and Economics, 40(1), pp.72-86.
Yourarticlelibrary.com, (2022).The Movement along the Demand Curve (Change in Quantity Demanded) | Economics.Available at:https://www.yourarticlelibrary.com/economics/the-movement-along-the-demand-curve-change-in-quantity-demanded-economics/8926[Accessed on 20th October 2022]
Zhang, Q., Dong, W., Wen, C. and Li, T., (2020). Study on factors affecting corn yield based on the Cobb-Douglas production function. Agricultural Water Management, 228, p.105869.
Rahim, A., Hastuti, D.R.D., Firmansyah, F., Sabar, W. and Syam, A., (2019). The Applied of Cobb-Douglas Production Function with Determinants Estimation of Small-Scale Fishermen's Catches Productions. International Journal of Oceans and Oceanography, 13(1), pp.81-85.


