
How to identify the impact of income and equality on the economy of the UK using income and equality assignment research principles?
Question
Task: How to identify the impact of income and equality on the economy of the UK using income and equality assignment research principles?
Answer
Chapter 1: Introduction
1.1 Background of research
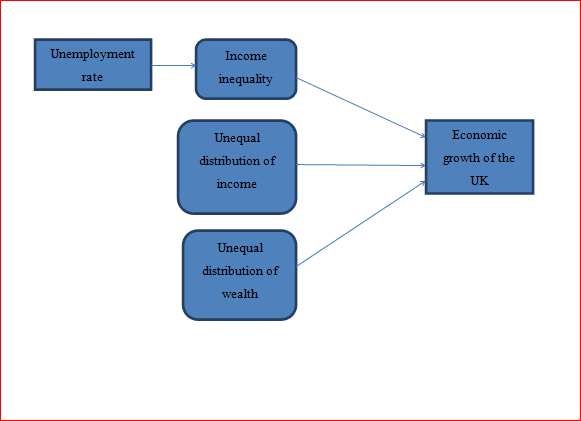
Economic growth is one of the major factors of success for a country, and economic growth is influenced by several economic indicators such as income distribution, wealth distribution, GDP, income/household, etc identified on this income and equality assignment. The relationship between inequality and economic growth is a matter of concern as to whether the inequality is related positively to the economic growth or there is a negative relation between the both. Economic growth can minimise inequality only in the case if the country has reached development at an advanced level. The unemployment rate is another factor that influences inequality, as an increased unemployment rate means more income inequality (Bouincha and Karim, 2018). The inequality in a country not only occurs by income or wealth but also occurs in terms of the distribution of other sources such as employment structure and other resources. There are various aspects identified on this income and equality assignment in which inequality and economic growth are related to each other such as savings, imperfection of credit markets, socio-political unrest, and level of technological and economic development (Mdingi and Ho, 2021).
The difference in income between males and females is one of the sides of income inequality in the UK. The income inequality measurement is mainly based on disposable income and household incomes. The income inequality in recent years has increased compared to the 1960s and 70s. The share of income for the top 1% of individuals increased in the 2000s. The impact of housing costs is also prominent in income inequality, as the Gini coefficient that illustrates income inequality is 39% after the housing cost and 35% before the housing cost(Harari and McGuinness, 2019). The income distribution in the UK is different in terms of retired households and non-retired households. The top fifth income earners have 40% of the total income in the UK, whereas the bottom fifth has 8% of the total income. The effect of redistribution of benefits and taxes is experienced mainly by the retired households, and the inequality of disposable income is lower for retired households than the non-retire households. Compared to income distribution, wealth is more unequally distributed in the UK. As per the calculations in 2016, 44% of the total wealth in the UK hold by the richest 10% of households. On the contrary, 50% of the poorest households hold only 9% of the total wealth (Equality Trust, 2019).
1.2 Theoretical importance
The income and equality assignment research topic has great theoretical importance as there are several theoretical views that support the relationship between income inequality and economic growth and inequality of other resources and economic growth. The income distribution theory of Kalecki is one of the crucial theories for the research. As per his theory, the wages and share of profits in the national outcomes are based on the monopoly degree in the economy. Most of the income distribution theories are based on the determination level of remuneration and employment. In the context of Ricardo, the income distribution is highly influenced by the political economy and their income distribution theory by Ricardo has meaningful significance. The theory of income distribution by Ricardo also focused on the conflict between profit and rent. But later, the focus shifted to wages and profits (Gallo, 2002). The revolutionary theory by Kuznets is another theory that is relevant to the research.
1.3 Practical importance
The income and equality assignment findings from the research will help to reflect on the extent income inequality, and other inequality influences the economic growth of the UK. The findings of the research will be helpful for future researchers and policymakers to understand the impact of income inequality and unequal distribution of resources on economic growth in the long term.
1.4 Personal importance
The findings of the research, as well as the reviewed literature, helped me to understand the impact of income inequality and unequal opportunity and their impact on economic growth. The findings also reflected the importance of equality and equal distribution of resources and opportunities to ensure better economic growth. The different factors that influence income distribution and lead to income inequality are also identified in the context that has provided an in-depth understanding of how income distribution works for economic growth.
1.5 Aim and Objectives
The aim of the income and equality assignment research is to evaluate the factors influencing income inequality and the impact of income inequality on the economic growth of the UK. The research also aims to reflect on how different factors of inequality have a different impact on economic growth.
The objectives of the research are the following:
• To evaluate the impact of unemployment rate on income inequality in the UK.
• To assess the impact of income distribution and wealth distribution on the economic growth of the UK.
• To evaluate the impact of income inequality on economic growth of the UK.
1.6 Summary of the overall structure
The income and equality assignment research mainly includes five chapters apart from the introduction chapter, and they are a literature review, methodology, research and findings, discussion and conclusion and recommendations. The second chapter reviews the existing literature related to the research topic that reflects how the existing literature demonstrates the impact of income and equality on economic growth. The third chapter is the methodology that indicates the way the research is being conducted, the instruments of data collection and the method of data analysis. The fourth chapter is research and findings that presents the analysis of collected data and results of the research. The fifth chapter is the discussion that discusses the results of the research along with the objectives of the research and hypotheses developed. The discussion part also indicates whether the results of the research agree with the developed hypotheses or deny them. The last chapter is the conclusion and recommendations, where the overall income and equality assignment findings of the research and limitations are portrayed, and recommendations to minimise the income inequality and unequal distribution of other resources are reflected.
1.7 Hypotheses
H1: Increasing the unemployment rate is positively related to income inequality in the UK.
H2: Income inequality has a negative relationship with the economic growth of the UK.
H3: Inequal distribution of income is negatively related to the growth of the economy in the UK.
H4: Unequal distribution of wealth is negatively related to the growth of the economy in the UK.
Chapter 2: Literature Review
According to Wajeetongratana (2020), economic growth is a chief criterion for any nationwide social welfare system. Growth is a key consequence of a government's nationwide effort and the primary indicator of the well-being of a nation. Economic growth, to some extent, can be seen as a safeguard of a nation's autonomy. Economic development is primarily produced by two chief factors: an upsurge in aggregate supply and an upsurge in aggregate demand. Three main aspects accelerating economic growth are increases in labour inputs such as hours or workers worked, technological advancement and accumulation of capital stock(Chien, 2015).
As per Araujo, Marinho and Lima (2017), there is a significant relationship between poverty reduction and economic growth, which can be calculated by the growth elasticity and income elasticity equations. When the elasticity is high, policies of anti-poverty based on economic progress tend to be more competent. When elasticity is low, strategies of poverty reduction must comprise economic growth amalgamated with some kind of redistribution of income.
Income distribution refers to the statistical calculation of the total population's earning or receiving varying income. As per (Levy, 2018), the distribution of income is concerned with an individual's income, saving and investment while interacting with the market economy of a country. It is significant for a nation's growth since it detects the extent of the poverty rate of that country and negatively impacts the health of the citizens. It reflects the inequality of income, which means the uneven distribution of wealth across the population. The Gini coefficient is used to measure income inequality. It is a measure of the total share of income in a given population. Income distribution and income inequality are inversely proportional to each other. When the equal distribution of income is less, higher is the income inequality and vice versa.
According to income and equality assignment research, the Economic system of the UK was characterised by high levels of income inequality in the 19th century. However, after 1978, there was a reduction in inequality levels and a decrease in poverty. This was due to several factors such as higher income tax levied on high earners, increased employment opportunities, increase in wages, removal of class benefits and an improvement in education and health care systems (Kamalvanshi, 2021). In the post-1980s, the UK economy was marked by a rise in income inequality all over again. This was an outcome of the decreased power of the UK's trade unions. There was a spike in service industry jobs and a decline in income tax rates. The UK has one of the top levels of inequality among various countries in the European Union (EU). There are varying reasons for the increased levels of inequality, such as an increase in the number of people receiving state benefits like sickness benefits. The increasing value of properties across the UK has deduced expendable income for the younger population. A rise in part-time, contractual basis work is not safeguarded by the policies of the trade unions leading to unequal income distribution and low wages for the working class. Unemployment levels have increased in society because of the rise in indirect taxes on commodities such as fuel. The inflation rate in the country is higher than the CPI rates contributing to income inequality. The Gini coefficient measuring income equality in the UK in 2019 was 35%. With the emergence of the global Coronavirus pandemic, the situation worsened for the country. The wages of the working-class people were negatively impacted by the fallout in UK's economy.
As stated by Atkinson and Jenkins (2018), the conservative wisdom holds that a slight change can be seen in the overall income inequality in the UK throughout the past century. This information has been derived from a study wherein the projected value for the Gini coefficient for the disposable household income in FY2014-15 has been indistinguishable from FY1990-91. Thus the changes in recent years have been insignificantly associated with the ten percentage point upsurge in the Gini coefficient, which happened between 1978-1990. According to income and equality assignment investigations, over recent decades, there have been substantial changes in the income distribution in the UK, which has placed significant pressures on government budgets. Stagnant wages and declining employment have impacted the country at different times to different extents, which has translated into abridged tax collections and increased generosity and eligibility for social insurance. Dabla-Norris et al.(2015) state inequality in income tends to dampen investment along with growth by fuelling financial, political and economic instability. Inequality within most emerging and advanced markets and developing countries has been increasing. The inequality discourse often makes a differentiation between inequality of opportunities which are attributed to circumstances differences, and inequality of outcomes which can be measured by expenditure, wealth or income. It is crucial to see that the UK is not unaccompanied in witnessing rises in income disparity since most developed nations have witnessed an upsurge in income inequality from the mid-1980s to the late 2000s. The changes in welfare policy and government tax can be among the reasons for increased inequality in incomes in the UK. The main impact of income inequality is that it tends to include higher rates of social and health issues and a lower rate of social goods. Apart from that, it also significantly lowers the happiness and satisfaction of the population while consecutively lowering the economic growth.
It has been stated by Qureshi (2016) typically; income equality is higher in emerging and developing countries than in economies that are advanced. Income inequality in major advanced economies declined for the most part of the post-war period until 1980. It has, however, risen since then, especially from 1990. The primary reasons for the rise in income inequality since the 1990s in the UK can be attributed to a reduction in higher income tax rates, decline in manufacturing, reduced power of trade unions, and upsurge in service sector jobs which is often categorised by flexible hours and temporary contracts, growth in the financial sector and high paying manual labour. In the developed world, the UK has the highest level of inequality. Hein (2015) reflected that Kalecki did not elaborate on the financial and monetary system of a capitalist economy in a systematic way. Kalecki’s theory of distribution stated that the relative share of wages and profits in the domestic output is dependent on the degree of monopoly in the nation’s economy. The basic idea of the theory is that the structure of distribution in an economy is dependent on the structure of imperfections of the market and of the market power. The marginal costs, according to Kalecki, contain the cost of labour (wages) and the cost of raw materials. Sandmo (2013) states Ricardo characterised income distribution as a chief issue of economics. The main significance of Ricardo's theory is that it was one of the initial models used in Economics, which aimed at explaining the distribution of income in society. His most astounding proposition is an increase in wage does not necessarily increase prices. It was further held by Ricardo that landlords would receive a greater part of the national income and capitalists would receive a lesser part, and this shift in distribution could lead to economic stagnation.The revolutionary theory on the other hand indicates the relationship between economic development and income inequality, and based on the theory, it has believed that income inequality increases along with the stage of development in the economy and decreases as the economy develops. In the case when income level increases at a higher level, the rate of income inequality rises again (Acemoglu and Robinson, 2002).
The degree of a country’s income distribution is measured by the total income generated by varying segments of the society. Equal distribution of income allows every member of society the opportunity to fair and equitable possession of wealth. The disadvantages of economic inequality identified on this income and equality assignment can country lead to an increased and uncontrollable degree of power in the hands of the richer population (Dabla-Norris et al., 2015). The tax revenue is distributed by the Government to ensure equal income distribution. The people belonging to the lower strata in a society can gain an opportunity to enhance their quality of life and increase wealth accumulation. It provides assistance to bear the financial pressure. In an economy wherein there is equal distribution of income, social harmony thrives. The UK Government can contribute to achieving equitable income distribution by incorporating a cumulative tax system indicating people with higher income are required to pay the larger tax amount. Educational grants can be provided with lower interest rates on loans. The Government can provide welfare and income assistance to low wage earners. Compensation on the gross service tax (GST) for these people will also contribute to decreasing income inequality. Income distribution can be equal in a country only if every citizen earns the same amount of money. If the rich keep becoming richer, and the poor get poorer, the economic equilibrium of the country is negatively impacted.
As per (Kyroglou, 2018), Equal income distribution facilitates the economic development of a country and economic stability. It will ensure the fairness of political entities, and their requirements from the society will be represented fairly. It will create equal employment opportunities, which will enhance productivity levels. This will contribute to improving the overall performance of the country and yield higher benefits. According to(Shah et al., 2020), equal wealth distribution will ensure economic growth leading to higher profitability for the business, improved facilities for citizens, improved infrastructure, higher employment rates, better access to health and educational centres and overall development for the country. The income and equality assignment research also shows that Economic growth will minimise poverty rates and promote a happy and peaceful economic scenario in the country.
Theoretical framework
Chapter 3: Research Methodology
3.1 Research philosophy
It is the central system of assumptions and beliefs about knowledge development. The philosophy includes three types of assumptions and they are epistemological, ontological and axiological assumptions. The research is based on epistemological assumptions as this assumption is based on knowledge, and the way things include valid, legitimate and acceptable knowledge is communicated to others. While carrying out the research on the epistemological assumption, the objectivism extreme is suitable for the research as it is based on numbers, facts, generalisations, and observable phenomena(Saunders et al., 2019). The present research aims to evaluate the impact of income and equality on the economic growth of the UK; in such cases, rather than personal opinion and individual thoughts, facts and numbers that can provide supportive evidence are more suitable. In terms of philosophical beliefs, positivism philosophy is suitable for the present research as this philosophy adheres to the factual knowledge that is gained through measurement and observation. In this philosophy, the role of the researcher is limited in terms of interpretation and data collection and acts as an objective analyst. The philosophy is mainly based on quantifiable an observation that is suitable in the context of the research.
3.2 Research approach
It is the procedure of research that includes the board assumptions of detailed collection of data, analysis of data and interpretation methods. The research approaches are of two types, inductive and deductive. In the case of qualitative research requires an inductive approach to carry out the research, analyse the collected data and derive results. If the income and equality assignmentresearch aimed to collected and conduct a qualitative research, then inductive approach was suitable. Quantitative research needs a deductive approach to extract the results. The deductive approach is suitable for the present research study as the quantifying facts need to be included and analysed in the research to assess how income and equality have affected the economic growth of the UK over time. To measure the exact impact, the inclusion of quantitative data is important. Another reason behind selecting the deductive approach is deriving more specific results than general results, and it helps the research to develop hypotheses based on a theoretical framework that will lead to specific conclusions(Woiceshyn and Daellenbach, 2018). The hypotheses that are developed in the income and equality assignment research will lead to specific conclusions, which will eliminate other generalisations of the results.
3.3 Research strategy
It is the stepwise plan to conduct and carry out research, and a specific instrument for data collection is selected. The strategy of research allows a researcher to carry out the research in a systematic way. Archival research is the strategy selected for the present research as this strategy allows a researcher to collect data from existing sources. For the present research, rather than collecting data from outside and collecting raw data, data from the existing records is more relevant and valid. Archival research is the strategy of data collection from the sources that have existence, such as survey data, census records, and other data that are collected in the past. In the present context of research, the archival research is suitable as the research aims to reflect on the impact o income and equality on the UK's economic growth, which means valid data is required to show how the income and other trends had fluctuated over time. Another research strategy that is suitable for present research if the research aimed conduct a primary research is survey, in which participants could have selected randomly.
3.4 income and equality assignment Research Design
The research design for the present research is based on a cross-sectional design, in which data is collected for a specific time period. Cross-sectional studies are mainly observational, and this type of study design is mainly used to describe the characteristics that already exist in the population. Another benefit of this study design is different characteristics can be considered from the same population to assess different aspects of impact on the population(Wang and Cheng, 2020). For the present research, the impact of income and equality on economic growth needs to be assessed on several characteristics of unequal distribution in the population. There are different aspects based on which the income and equality impact need to be analysed to reflect on how these aspects influence the growth of the UK economy. The cross-sectional design will help to reflect on the aspects of the same time period.
3.5 Data collection
The data collected for the income and equality assignment research are mainly quantitative in nature and are collected from UK based statistics. To collect valid and relevant data, government sites are used as they provide accurate data, which does not affect the validity and reliability of the research. The key aspects based on which the data are collected income inequality, income distribution, wealth distribution, unemployment rate and GDP. The data are collected based on these aspects for five years (2017-2021). The data collected for five years helps to compare the data and reflects the change in the trend over time. The government sites are mainly selected as sources of data as the government sites include valid and detailed data about the identified aspects. The data are collected mainly based on the UK scenario, and specific population-based data are not included. In certain areas, gender-based differences and state-based differences are included to provide more in-depth data. If the research was a primary research then data could have collected either from face to face survey or an open online survey.
3.6 Data analysis
The collected data are presented in table format in which each aspect has reflected in terms of five years and comparison of income inequality and other unequal distribution with economic growth of the UK. After analysing the collected data with graphs, the results are discussed along with the hypotheses developed for the research.
3.7 Reliability and validity
The data collected for the research are based on government sites and reliable sources, which means the data used are valid and reliable. The collected data may not provide exact estimation as the data collected from a large number of populations that have diverse characteristics.
Chapter 4: Results and Findings
4.1 Unemployment rate in the UK
|
Unemployment rate |
2017 |
2018 |
2019 |
2020 |
2021 |
|
Male |
4.7% |
4.2% |
3.9% |
4.2% |
5.1% |
|
Female |
4.4% |
4.1% |
3.7% |
3.8% |
4.6% |
|
Total |
4.4% |
4.1% |
3.8% |
4.6% |
4.5% |
The table above indicates the fluctuations in the unemployment rate in the UK in 2017-2021, and the unemployment rate and its differences for males and females are also illustrated in the context to reflect on how gender-based inequalities also have a significant impact on the economy. The total unemployment trend for five years indicates that the unemployment rate was following a declining rate till 2019, but in 2020, it increased. Compared to the female unemployment rate, the male unemployment rate is more, which indicates that inequality exists in terms of gender-based unemployment.
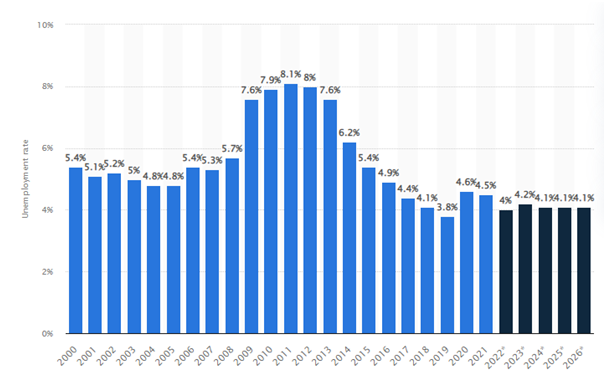
Figure 1: Annual unemployment rate in the UK in 2000-2026
Source:(Clark, 2022)
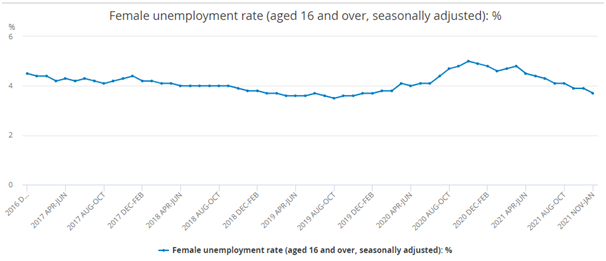
Figure 2: Female unemployment rate
Source: (Ons.gov.uk, 2022)
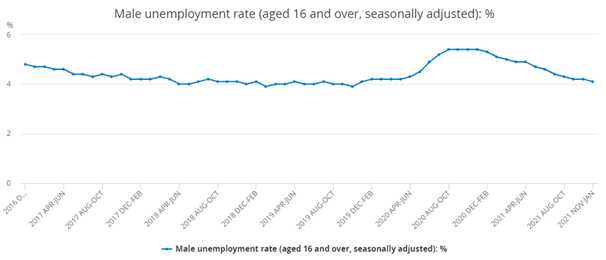
Figure 3: Male unemployment rate
Source: (Ons.gov.uk, 2021)
4.2 Income inequality
|
Income inequality |
2017 |
2018 |
2019 |
2020 |
2021 |
|
Gross income |
38.5 |
40.1 |
40.9 |
40.0 |
39.1 |
|
Disposable income |
33.4 |
35.0 |
36.0 |
35.4 |
34.4 |
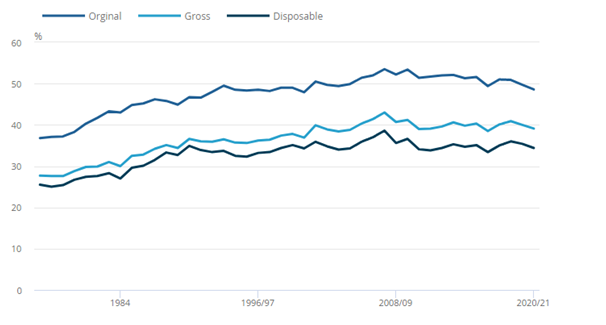
Figure 4: Income inequality in the UK
Source: (Ons.gov.uk, 2021a)
The income inequality table shown above indicates the fluctuations in gross income and disposable income in 2017-2021. The measurements are based on the Gini coefficient, and the gross income of the UK decreased in 2021, and the disposable income also decreased in 2021 compared to previous years. Before 2020, both gross income and disposable income were following an increasing trend. It indicates in the year 2020 and 2021 major economic impact on the growth of the economy have experienced in the UK.
4.3 Economic growth
|
Economic growth |
2017 |
2018 |
2019 |
2020 |
2021 |
|
GDP/capita(pounds) |
33043 |
33388 |
33763 |
30504 |
32555 |
|
Annual growth |
-1.81% |
6.67% |
-1.49% |
-4.89% |
7.4% |
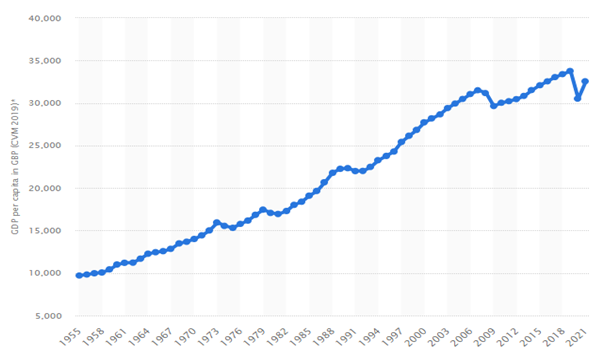
Figure 5: GDP/capita in the UK
Source: (Clark, 2021)
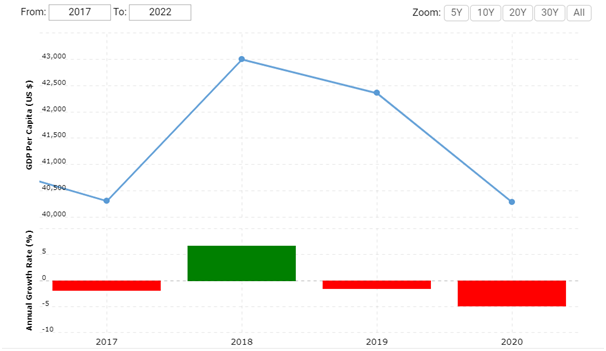
Figure 6: GDP annual growth in the UK
Source: (Macrotrends, 2020)
The economic growth of the UK is mainly analysed using two factors GDP/capita and annual growth of GDP. While collecting the data on economic growth, data for 2017-2021 is collected for GDP/ capita and GDP annual growth. The table, as well as figures 5 and 6, indicates different trends of economic growth over time. The annual growth of GDP in 2017 had a negative trend, 2018 had a positive trend, 2019 and 2020 followed the negative trend on a continuous growth basis, and in 2021, a positive trend in annual growth of GDP was experienced in the UK. A similar trend is followed in the case of GDP/capita. It indicates even due to the continuous decline in economic growth in the UK, positive growth can be expected in upcoming years.
4.4 Inequal distribution of income
|
Income distribution |
2017 |
2018 |
2019 |
2020 |
2021 |
|
Top 1% |
7.0 |
7.7 |
8.0 |
8.2 |
7.4 |
|
P90/P10
|
3.9 |
4.2 |
4.6 |
4.3 |
4.3 |
|
S80/S20
|
5.2 |
5.8 |
6.2 |
5.8 |
5.9 |
|
Palma ratio
|
1.3 |
1.4 |
1.5 |
1.4 |
1.4 |
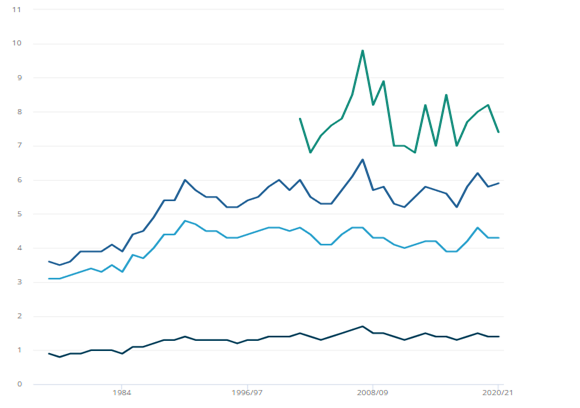
Figure 7: Inequality in income distribution in the UK
Source: (Ons.gov.uk, 2021a)
The inequality in income distribution has been presented in the context, and it indicates how the income distribution and inequality related to it have changed over time. The table above indicates the income distribution and its trends for different income earners. P90/P10 ratio indicates the individual income of the bottom of the top 10% and top of the bottom 10%. The S80/S20 ratio indicates the 20% of highest income earners to that 20% of lowest income earners, and the Palma ratio indicates the share of 10% of richest people and 40% of poorest people. The income of the top 1% shows an increasing trend, but it decreased in 2021. The other three rations show an increasing trend till 2019 but have decreased in 2020 and 2021. It indicates except top 1% earners; the other income earners faced a decline in income in 2020 and 2021.
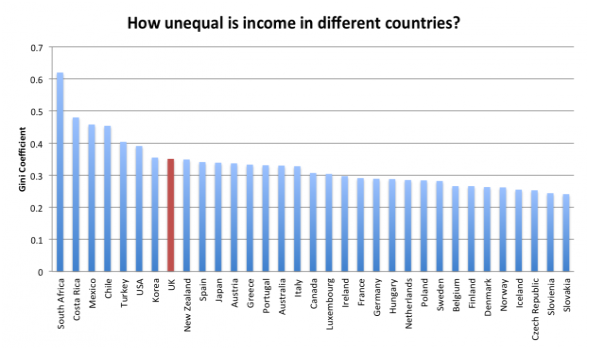
Figure 8: Income inequality in the UK and in other countries
Source: (The Equality Trust, 2019)
Figure 8 indicates the comparison of income inequality between countries, where the income inequality of the UK has compared with developed and developing economies. In the figure, it has clearly shown that the UK has an unequal distribution of income compared to other developed countries.
4.5 Unequal distribution of wealth
The inequality in wealth distribution is another major problem in the UK, and the figure below indicates how there is a large gap in wealth distribution between the top income earners and poorest income earners. The poorest income earners have less than £15,400 on average, whereas the top 1% of income earners have £3.6m wealth on average. The huge gap in wealth distribution between the different levels of income earners indicates that even if there is an economic crisis or other condition, it mainly affects the low-income earners rather than having an equal impact on all income earners.
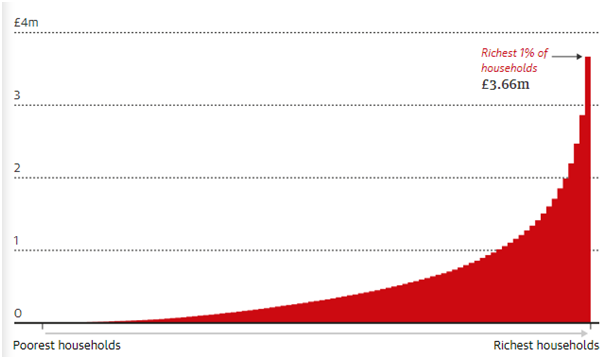
Figure 9: Inequality in wealth distribution in the UK
Source: (Neate, 2022)
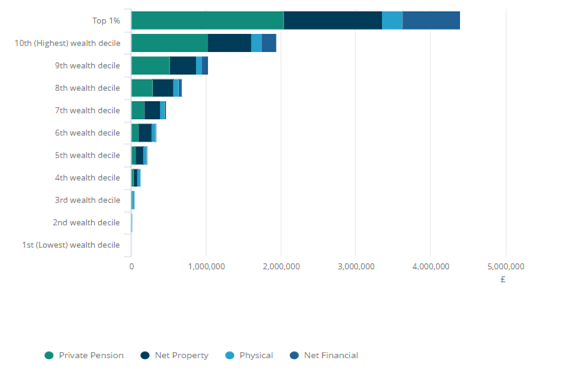
Figure 10: Wealth components and their distribution among different income earners
Source:(Ons.gov.uk, 2020)
The figure above indicates different components of wealth and their unequal distribution among different levels of income earners. The wealth components are largely categorised into four types, and they are private pension, physical wealth, net property and net financial. For top earners, the private pension and net property are major sources of wealth, whereas physical wealth is a major source of wealth for the lowest income earners. It means the earnings they get from the regular income they are not able to convert the income into wealth due to a minimal level of income. For mid wealthy households, the net property is more of a source of wealth. The wealth distribution also differs based on the age factor, as illustrated in figure 11. As shown in figure 11, the most wealthy holders are the 45-54 age group of people and the 55 and above the age group of people. The people from 16-24 years are the lowest wealth holders. For the 45-54 age and 55 and above age group, private pension is the major wealth source, whereas for 25-34 years and 35-44 years age group holds more physical wealth.
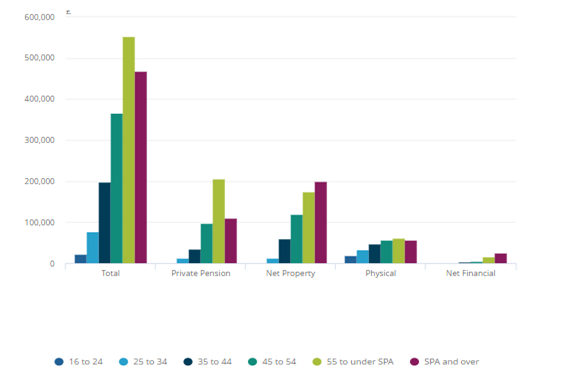
Figure 11: Wealth distribution based on age
Source: (Ons.gov.uk, 2020)
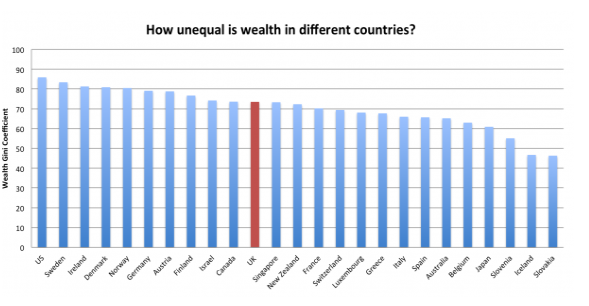
Figure 12: Wealth distribution inequality in the UK and other countries
Source: (The Equality Trust, 2019)
The figure above indicates the inequality of wealth distribution in the UK and its comparison with other countries. Rather than in other OCED countries, the wealth distribution inequality in the UK is average. In the case of lower-income earners, the wealth distribution inequality is lower than the world average, but in terms of high-income earners, the wealth distribution inequality in the UK is high than the world average.
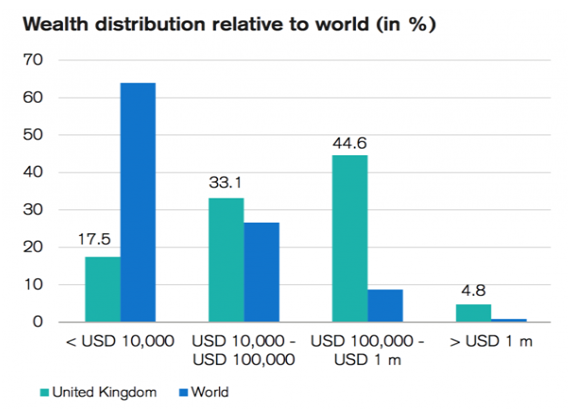
Figure 13: Wealth distribution inequality for different income earners in the UK and world average
Source: (The Equality Trust, 2019)
Chapter 5: Discussion of Findings
H1: Increasing unemployment rate is positively related to the income inequality in the UK
The first hypothesis developed in the income and equality assignment research aimed to assess the relationship between the unemployment rate and income inequality in the UK. Compared to 2017,18, and 19, the unemployment rate has increased in 2020 and again declined in 2021, but compared to the three previous years (2017-19), it has increased, which means more people are unemployed in the UK. Both gross income and disposable income inequality have declined from 2017 to 2021, which indicates there has been a decline in income inequality in the UK over time. The income inequality fell a little in the recent years, but there was an average trend followed in previous years, which indicates there is no such significant decline in income inequality. Based on this fat, it can be said that the unemployment rate of the UK does not share a positive relationship with income inequality as the change in the unemployment rate have no significant impact on income inequality. The results of the income and equality assignment research deny the hypothesis.
H2: Income inequality has a negative relationship with the economic growth of the UK
The income inequality and its trends discussed in the above section indicate there is no such significant decline in income inequality in the UK. The annual growth of the UK's economy has declined in 2019 and 2020 and again increased in 2021, which means, currently, the economic growth of the UK is following a positive trend. The income inequality has decreased, but the decline is not significant, which means there are no major changes in terms of income inequality, whereas the economic growth has rapidly changed over the years. Based on this fact, it can be said that income inequality is in a negative relationship with the economic growth of the UK, which means even the economic growth of the UK is not majorly affected by income inequality. The results of the research accept the hypothesis. Income distribution theory explained by Ricardo can be justified in the context of the study results as distribution of income is the major problem for the economy (Sandmo, 2013).
H3: Inequal distribution of income is negatively related to the growth of the economy in the UK
The result of theincome and equality assignment research indicates that the income distribution in the UK is highly unequal, and compared to other developed countries, inequality of income distribution is high in the UK. While assessing the income distribution among different levels of income earners, it has been found that there is a huge gap between the income of top earners and the lowest earners. Even with the huge gap in income among the top and lower-level income earners, the economic growth of the UK is not significantly affected. The reviewed literature indicates that income distribution is significantly related with the economic growth (Levy, 2018), but the results of the research indicates the distribution of income has no significant related with the economic growth.The inequality in the income distribution in the UK hardly affects the economic growth of the UK, and even if it affects, the impact is not significant. Based on this fact, it can be said that the unequal distribution of income in the UK is negatively related to economic growth and the results of the research accept the hypothesis.
H4: Unequal distribution of wealth is negatively related to the growth of the economy in the UK
Along with the income distribution, there is a huge gap in wealth distribution found in the UK. Compared to the inequality of income distribution, the wealth distribution is on the average level in the UK compared to OECD countries. For the high-income earners, the wealth distribution is unequal in the UK compared to the world average. The wealth distribution among the top 1% is more than £3.6m, whereas, for the lowest income earners, the wealth distribution is £15,400, which indicates a huge gap in the wealth distribution in the UK. The pension is the major wealth resource for top wealth holders, whereas physical wealth is the major source of wealth for the lowest wealth holders in the UK. It indicates the top wealth holders have both wealth sources as well as sufficient income sources. The lowest wealth holders have limited wealth and limited sources of income. Kalecki’s theory explained that the wages and income earned by an individual is highly influenced by the monopoly in the economy (Hein, 2015), which indicates the distribution of income and wealth is influenced due to monopoly in the economy not because of the individuals are unable to earn more. Based on the reviewed literature, it can be said that result of the study is relatable to the reviewed literature at certain extent.The unequal wealth distribution negatively reacted to the UK's economic growth as even if there is a huge gap in wealth distribution, the economy has not been significantly affected and thus, the hypothesis is accepted.
The finding of the income and equality assignment research indicates that the relationship between income and equality and economic growth is negative in overall as the change in income inequality, unequal wealth and income distribution and the unemployment rate have no significant impact on the economic growth. The findings also indicate that even if the inequality in income, its distribution and wealth distribution increases, it may not affect the growth of the UK's economy significantly. One of the key factors that influence income inequality is the unemployment rate, which has increased in recent years even after a declining trend till 2019. The unemployment rates for males and females are different, which indicates that inequality in employment also exists based on gender. Income inequality has been controlled in the UK over the time, and even if the income inequality has been controlled over the time, the economic growth of the UK has experienced a declining trend in 2019 and 2020, which indicates the economic growth does not accurately change along with the similar change in income inequality. Even if the impact of income inequality on economic growth cannot be denied totally, there is no such significant impact resulting from the findings of the study.
The income and wealth distribution which are crucial indicators of equality in the UK indicates the huge gap in income and wealth distribution has no significant impact on the economic growth. The findings of the study reflect that the distribution of income and wealth distribution is highly unequal in the UK compared to other developed countries, and even if a huge gap in income and wealth distribution exists, the impact on economic growth is not significant. Based on the findings related to the H3 and H4, it is clear that both hypotheses are acceptable as a their negative relationship between the income and wealth distribution inequality with the economic growth of the UK as the decrease in inequality in terms of these two factors dose, not infancy the economic growth. The unequal distributions of wealth and income, which are major problems in the context of the UK, have no such significant impact on economic growth. Even if there is a huge gap in the distribution of wealth and income in the UK, the economic growth in 2021 is still positive compared to previous years. The findings related to the first hypothesis met the first objective of the research as the findings reflect the impact of the unemployment rate on income inequality. The findings related to the first hypothesis deny the hypothesis as the increasing unemployment rate has no positive relationship with the income inequality, and even if the unemployment rate decreases, the income inequality may not decrease at the same pace as the distribution of income is different. The findings related to the third and fourth hypotheses have met the second objective of the income and equality assignment research, and findings related to these hypotheses indicate the impact of wealth and income distribution on the UK's economic growth. The findings related to the second hypothesis have met the third objective of the research.
Chapter 6: Conclusion and recommendations
6.1 Conclusion
The income and equality assignment research reflects and discusses several aspects of income and equality in the context of the UK and how unequal distribution of income and wealth can affect the economic growth of the UK. Based on the overall findings of the research, it has been found that neither income inequality nor unequal income and wealth distribution significantly affect economic growth. Even though there is a positive trend of economic growth faced by the UK, there is still a huge gap in the distribution of income and wealth, which means the inequality of income and wealth distribution cannot affect economic growth directly. The research is based on a deductive approach, which helped to develop the hypotheses based on theoretical aspects (income distribution theory and revolutionary theory) and the previous literature on the research area. The data collected in the research is based on secondary sources, and quantitative data are collected. The research is carried out in a valid and reliable way, and the data collected for the research are from reliable sources, which indicates the findings of the research does not only based on certain assumptions but the facts that support the hypotheses. The reviewed literature in the research has certain differences from the findings of the research as reviewed literature has illustrated a mixed view on the relationship between income inequality and wealth and income distribution with the economic growth. The income and equality assignment findings clarify the fact that even if the income inequality and unequal distribution of wealth and income may seem to influence the economic growth on a large scale, in actual there, the impact is not significant. The extent the inequality in the UK is affecting the population is not comparable to the relationship with economic growth because even if the economic growth reflects positive growth, inequality is still a major problem in the UK.
While discussing the findings and validity of the research data, it can be said that the research is limited to a certain extent as only the income inequality, unemployment rate, wealth, and income distribution are focused on the context, but there are other factors also that influences the economic growth of the UK. The unemployment rate has shown gender-based differences, but in terms of income inequality, wealth distribution or income distribution, there is no such comparison made based on gender-based or racial differences. It indicates the research has the future scope to explore those areas.
6.2 Recommendations
Based on the overall income and equality assignment findings, it can be said that even if the inequality of income and inequality in terms of wealth and income distribution have no significant impact on economic growth, for sustainable growth of the economy, those areas need to be focused on. The findings indicate that the unemployment rate has no significant impact on income inequality, but addressing the unemployment rate is important to improve the individual household income. The role of education is crucial in such a context, and better educational policies can improve the skills and knowledge of individuals and can increase their chance of employment opportunities (OECD, 2012).
Another thing that needs to focus on for addressing income inequality is well-designed policies for the labour market. Equal distribution of earnings can minimise income inequality in the UK. Job protection reforms in the form of temporary and permanent job contracts are more prominent and increase employment opportunities.
Another thing that is helpful to minimise inequality is the tax and transfer system. The redistribution impact significantly affects the inequality. Richer households pay more taxes compared to the poorest households, but they also get tax benefits and tax returns. Excessive taxation on products and services also increases the burden on low-income households as they have to pay more for consumed products and services. Better taxation policies can address income inequality to a certain extent (OECD, 2012).
The findings of the income and equality assignment research have provided a clear indication that income inequality in the UK is a serious problem as the inequality is much higher than the other developed countries. Rather than focusing only on the pace of economic growth, the UK needs to focus more on sustainable economic growth. There are factors that the government need to focus on, such as the gender pay gap and the racial pay gap, to improve the economy-wide and regional productivity. More investment in infrastructure is needed to address the issues (Mustafa, 2021).
References
Acemoglu, D. and Robinson, J.A. (2002). The Political Economy of the Kuznets Curve. Review of Development Economics, [online] 6(2), income and equality assignment pp.183–203. Available at:https://wcfia.harvard.edu/files/wcfia/files/908_jr_kuznets.pdf
Araujo, J., Marinho, E. and Lima, G. (2017). Economic growth and income concentration and their effects on poverty in Brazil. [online] Available at: https://repositorio.cepal.org/bitstream/handle/11362/43457/1/RVI123_Araujo.pdf [Accessed 9 Jun. 2022].
Atkinson, A.B. and Jenkins, S.P. (2018). A Different Perspective on the Evolution of UK Income Inequality. SSRN Electronic Journal. [online] Available at: https://onlinelibrary.wiley.com/doi/full/10.1111/roiw.12412
Blundell, R., Joyce, R., Norris Keiller, A. and Ziliak, J.P. (2018). Income inequality and the labour market in Britain and the US. Journal of Public Economics, [online] 162, pp.48–62. Available at: https://www.ucl.ac.uk/~uctp39a/JPubE_Atkinson_Volume_paper.pdf
Bouincha, M. and Karim, M. (2018). Income Inequality and Economic Growth: An Analysis Using a Panel Data. International Journal of Economics and Finance, [online] income and equality assignment 10(5), p.242. Available at: https://www.researchgate.net/publication/324724846_Income_Inequality_and_Economic_Growth_An_Analysis_
Using_a_Panel_Data [Accessed 8 June. 2022].
Chien, Y. (2015). What Drives Long-Run Economic Growth? [online] Stlouisfed.org. Available at: https://www.stlouisfed.org/on-the-economy/2015/june/what-drives-long-run-economic-growth [Accessed 9 Jun. 2022].
Clark, D. (2021). GDP per capita in the UK 2018 | Statista. [online] Statista. Available at: https://www.statista.com/statistics/970672/gdp-per-capita-in-the-uk/.
Clark, D. (2022). Unemployment rate forecast UK 2022. [online] Statista. Available at: https://www.statista.com/statistics/374800/unemployment-rate-forecast/#:~:text=Annual%20unemployment%20rate%20in%20the%20UK%202000%2D2026&text=In%202022
%2C%20the%20unemployment%20rate.
Dabla-Norris, E., Kochhar, K., Suphaphiphat, N., Ricka, F. and Tsounta, E. (2015). Causes and Consequences of Income Inequality: A Global Perspective. Staff Discussion Notes, [online] 15(13), p.1. Available at: https://www.imf.org/external/pubs/ft/sdn/2015/sdn1513.pdf
Equality Trust (2019). The Scale of Economic Inequality in the UK | The Equality Trust. [online] equalitytrust.org.uk. Available at: https://equalitytrust.org.uk/scale-economic-inequality-uk#:~:text=Over%2050%25%20of%20UK.
Gallo, C. (2002). Economic Growth and Income Inequality: Theoretical Background And Empirical Evidence. [online] Available at: https://www.ucl.ac.uk/bartlett/development/sites/bartlett/files/migrated-files/WP119_0.pdf.
Harari, D. and McGuinness, F. (2019). Income inequality in the UK.income and equality assignmentcommons library.parliament.uk. [online] Available at: https://commonslibrary.parliament.uk/research-briefings/cbp-7484/ [Accessed 9 Jun. 2022].
Hein, E. (2015). A Service of zbw Leibniz-InformationszentrumWirtschaft Leibniz Information Centre for Economics The principle of effective demand: Marx, Kalecki, Keynes and beyond. [online] Available at: https://www.econstor.eu/bitstream/10419/122151/1/839366493.pdf [Accessed 9 Jun. 2022].
Kamalvanshi, V. (2021). Economic Inequality: Measures and Causes. [online] ResearchGate. Available at: https://www.researchgate.net/publication/352376373_Economic_Inequality_Measures_and_Causes [Accessed 9 Jun. 2022].
Kyroglou, G. (2018). ‘The Importance of Income Inequality at the Top End of the Distribution as Opposed to the Bottom End as Determinant of Growth’. [online] ResearchGate. Available at: https://www.researchgate.net/publication/328939517_The_Importance_of_Income_Inequality_at_the_Top
_
End_of_the_Distribution_as_Opposed_to_the_Bottom_End_as_Determinant_of_Growth [Accessed 9 Jun. 2022].
Levy, F. (2018). Distribution of Income - Econlib. [online] Econlib. Available at: https://www.econlib.org/library/Enc/DistributionofIncome.html [Accessed 9 Jun. 2022].
Macrotrends (2020). U.K. GDP Per Capita 1960-2020. [online] Macrotrends.net. Available at: https://www.macrotrends.net/countries/GBR/united-kingdom/gdp-per-capita.
Mdingi, K. and Ho, S.-Y. (2021). Literature review on income inequality and economic growth. MethodsX, [online] 8, p.101402. Available at: https://reader.elsevier.com/reader/sd/pii/S2215016121001953token=33E5489E8A655C9627958AAF977A
38282001A950C7AD87423DBA4DA5EABD895BBE807BE146B74193361767B1BB06CA7C&originRegion=eu-west-1&originCreation=20220608081246 [Accessed 8 June. 2022].
Mustafa, G. (2021). Levelling up by tackling rising income inequality in the UK. [online] www.derby.ac.uk. Available at: https://www.derby.ac.uk/blog/levelling-up-by-tackling-rising-income-inequality-in-the-uk/.
Neate, R. (2022). Richest 1% of UK households are worth at least £3.6m each. [online] the Guardian. Available at: https://www.theguardian.com/money/2022/jan/07/richest-uk-households-worth-at-least-36m-each.
OECD (2012). Economic Policy Reforms 2012 Going for Growth PART II Reducing income inequality while boosting economic growth: Can it be done? [online] Available at: https://www.oecd.org/economy/labour/49421421.pdf.income and equality assignment
Ons.gov.uk (2020). Household total wealth in Great Britain - Office for National Statistics. [online] www.ons.gov.uk. Available at: https://www.ons.gov.uk/peoplepopulationandcommunity/personalandhouseholdfinances/incomeandwealth/
bulletins/totalwealthingreatbritain/april2018tomarch2020.
Ons.gov.uk (2021). Male unemployment rate (aged 16 and over, seasonally adjusted) - Office for National Statistics. [online] Ons.gov.uk. Available at: https://www.ons.gov.uk/employmentandlabourmarket/peoplenotinwork/unemployment/timeseries/mgsy/lms.
Ons.gov.uk (2021a). Household income inequality, UK - Office for National Statistics. [online] www.ons.gov.uk. Available at: https://www.ons.gov.uk/peoplepopulationandcommunity/personalandhouseholdfinances/incomeandwealth
/bulletins/householdincomeinequalityfinancial/financialyearending2021.
Ons.gov.uk (2022). Female unemployment rate (aged 16 and over, seasonally adjusted) - Office for National Statistics. [online] Ons.gov.uk. Available at: https://www.ons.gov.uk/employmentandlabourmarket/peoplenotinwork/unemployment/timeseries/mgsz/lms.
Qureshi, Z. (2016). Kemal Dervi? Senior Fellow Global Economy and Development at the Brookings Institution INCOME DISTRIBUTION WITHIN COUNTRIES: RISING INEQUALITY. [online] Available at: https://www.brookings.edu/wp-content/uploads/2017/12/income-inequality-within-countries_august-2016.pdf [Accessed 9 Jun. 2022].
Sandmo, A. (2013). The Principal Problem in Political Economy: Income Distribution in the History of Economic Thought. SSRN Electronic Journal. [online] doi:10.2139/ssrn.2337488.
Saunders, M., Lewis, P., Thornhill, A. and Bristow, A. (2019). ‘Research Methods for Business students’ Chapter 4: Understanding Research Philosophy and Approaches to Theory Development. [online] ResearchGate. Available at: https://www.researchgate.net/publication/330760964_Research_Methods_for_Business_Students_Chapter_4
_Understanding_research_philosophy_and_approaches_to_theory_development.
Shah, Q., Zubair, S. and Hussain, S. (2020). The impact of institutions on economic growth in selected developing countries: An analysis based on Bayesian panel estimation. [online] ResearchGate. Available at: https://www.researchgate.net/publication/350179129_The_impact_of_institutions_on_economic_growth_in_
selected_developing_countries_An_analysis_based_on_Bayesian_panel_estimation [Accessed 9 Jun. 2022].
The Equality Trust (2019). The Scale of Economic Inequality in the UK | the Equality Trust. [online] equalitytrust.org.uk. Available at: https://equalitytrust.org.uk/scale-economic-inequality-uk.
Wajeetongratana, P. (2020). Economic growth and its key factors: an alternative view on the factors stimulating agriculture growth. E3S Web of Conferences, [online] 175, p.13028. Available at: https://www.researchgate.net/publication/342528827_Economic_growth_and_its_key_factors_an_alternative_
view_on_the_factors_stimulating_agriculture_growth
Wang, X. and Cheng, Z. (2020). Cross-Sectional Studies Strengths, Weaknesses, and Recommendations. [online] reader.elsevier.com. Available at: https://reader.elsevier.com/reader/sd/pii/S0012369220304621?token=307B87A00AA9E702906BCA9E1F61BCCD78769CCE1E9823AC1C50D75336D00AD5AB497AAAB46CA307
42520AFC51EA816D&originRegion=eu-west-1&originCreation=20220610122747.
Woiceshyn, J. and Daellenbach, U.S. (2018). (PDF) Evaluating Inductive versus Deductive Research in Management Studies: Implications for Authors, Editors, and Reviewers | Qualitative Research in Organizations and Management An International Journal. income and equality assignment[online] ResearchGate. Available at: https://www.researchgate.net/publication/324596659_Evaluating_Inductive_versus_Deductive_Research_in_
Management_Studies_Implications_for_Authors_Editors_and_Reviewers.


