
Business Economics Assignment: Macroeconomic Analysis of Johnson & Johnson in Japan and India
Question
Task:
A. Project question examined in the business economics assignment
A major multinational corporation has appointed you as an economic advisor. You are requested to compile a report regarding the macroeconomic environment in two countries where the firm operates and explain how it might affect the company’s economic activity.
B. Project specifications
1. You may choose to focus your analysis on any existing firm with an international activity that can be of different types in the two countries.
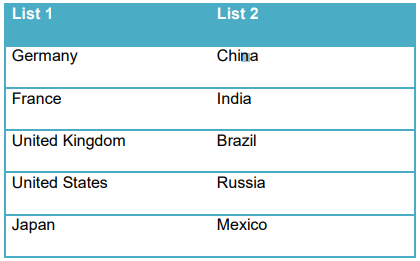
2. The two countries must be chosen from section C below as follows: one country from List 1 and one country from List 2.
3. Your report must include:
a. A brief description of the company and the product/market it operates in for both countries.
b. An analysis of the market structure in which your company operates for the two countries.
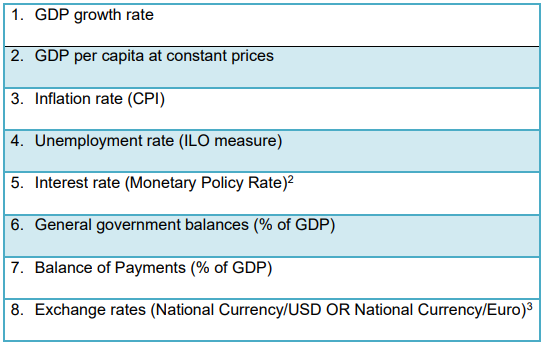
c. A comparative analysis of all major macroeconomic indicators (see section D below, excluding 5 and 8) for the two countries and their overall impact on firm’s economic activity.
d. An analysis of the monetary and fiscal policy (instruments) for the two countries and their impact on the firm’s economic activity. You must include here an analysis of the interest rates (Section D, indicator 5).
e. An analysis of the foreign trade policy instruments (international trade agreements) for the two countries and their impact on firm’s economic activity. You should include here an analysis of the exchange rates (Section D, indicator 8).
C. Country Lists
D. Macroeconomic indicators1 to be analysed (the last available 10 years):
Answer
Introduction:
This report on business economics assignment is prepared by the economic advisor appointed by the pharmaceutical giant, Johnson & Johnson to have a macroeconomic analysis in its operating countries. For this purpose, two distinctive countries – Japan and India are chosen to run a study on the market structure it follows there along with comparison of its macro-economic indicators. It is to evaluate its influence on the economic activities based on various macro-economic indicators of the countries on Johnson & Johnson.
a. Brief description of the company and its operating countries:
Johnson & Johnson –
Johnson & Johnson (J&J) is the New Jersey based American pharmaceutical organisation engaged in developing medical devices, consumer packaged goods, and pharmaceutical drugs. J&J has its presence across 60 countries globally and selling its products in more than 175 countries. In 2015, it earned global sales worth $70 billion and has around 250 subsidiaries which are popular in first-aid and medication supplies(jnj, 2020). The company is known across the world for Band-Aid for first-aid and bandages, baby merchandises, Tylenol prescriptions, Neutrogena skin and beauty merchandises, Clean & Clear face wash, and Acuvue contact lens among others. J&J earned revenue worth $82 billion in 2019 making it as amongst the most valuable organisations on the earth. It ranked 37th on the 2018 Fortune 500 list as one of the biggest American companies in terms of revenue. The 130-years old company along with its 130,000 global employees work round the clock to provide better healthcare facilities to mankind.
Japan –
Japan is an island nation situated in the eastern coats of Asia covering 1,500 miles in the western part of the North Pacific Ocean. Japan is considered as a literate country with 99% of its population is educated and the East Asian archipelago has a penchant for advanced technologies. Japan is the 3rd biggest economy across the world with a GDP of $5 trillion(Austin, 2020). The island nation is the biggest manufacturer of steel, automobiles, and electronic components. The service sector constitute the biggest share in the Japanese economy with 72.31% employing 60% of the 126 million indigenous population(JapanGov, 2020). Japan is a big name on the economic front having coveted membership of international organisations like the United Nations, World Bank, and the Asian DevelopmentBank. It has the most number of old people in the world terming it as an aged economy and diminishing birth rates(Latz, 2020).
India –
India is the biggest republic on earth and with a population of 1.3 billion which is one-sixth of the global populationmaking it the 2nddensely inhabited country after China(Dikshit, 2020). Agriculture is the mainstay of the Indian economy but as the population acquired technical and language skills, say English, it opened up new avenues in software, business process outsourcing, and information technology-enabled services. India has a GDP of $2.9 trillion in 2019 making it the 5th largest economy. The country has a GDP growth rate of 5.8% establishing it as the fastest growing economy globally(BBC News, 2019). India has a wide resource of workforce numbering unto 514 million which is 2nd largest on the global platform. The Indian service sector is growing at a fast pace and constitute 55.6% of the GDP, the industrial sector at 26.3% and agriculture at 18.1%(India.gov.in, 2020).
b. Market structure of J&J in Japan and India:
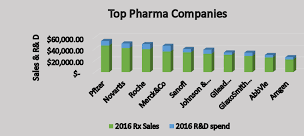
Figure 1: R&D expenses of global pharmaceutical companies
Source: (Malmendier, 2018)
The chart above shows the extent of research and development expenses incurred by the renowned global pharmaceutical companies like J&J, Pfizer, Roche, Novartis, Merck and others to create a differentiation in their products. This sort of model is followed by the major pharmaceutical giants like J&J and others on the global platform taking consideration of the Japanese and Indian market. In 2019, J&J earned revenue worth $42.2 billion globally from its pharmaceutical segment which constitute 50% of its total revenue, followed by the medical devices and diagnosis segment and the consumer health segment(jnj, 2020). The efficient R&D wing of J&J enabled the pharmaceutical giant to have core expertise in immunology, and oncology carving a niche in the operating markets like India and Japan. So J&J to survive undertakes the monopolistic competitive market structure which dwells in an imperfect market condition (Malmendier, 2018). Monopolistic competition is effective when there are large number of sellers in the market having distinctive market share based on product, pricing, and market composition.
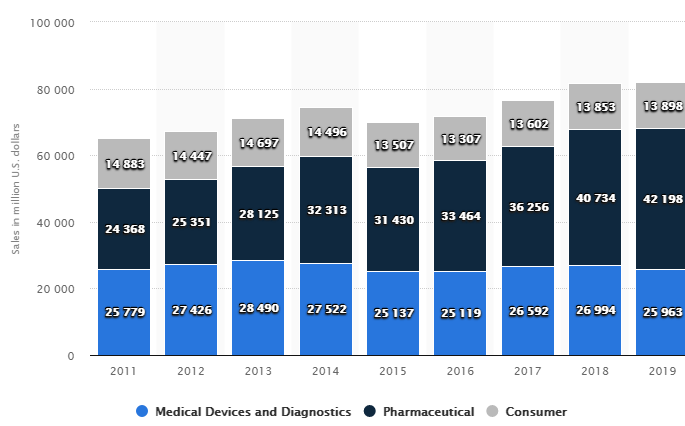
Figure 2: Global sales of J&J, segment wise
Source: (jnj, 2020)
The above chart shows the gradual rise of the pharmaceutical revenue of J&J over the years from $24 billion in 2011 to $42 billion in 2019(Redonda, et al., 2019). The higher relevance of the R&D in its business process enabled to have a phenomenal growth and raising hopes for innovative drugs in the pharmaceutical fields. Currently, J&J precedes only Novartis in terms of innovating drugs having the 2nd position in terms of number of originated drugs. So the monopolistic competition market structure is well executed by J&J to carve out a distinctive market identity and attain sustainability amidst intense competition.
c. Comparative analysis of macroeconomic indicators:
1. GDP growth rate –
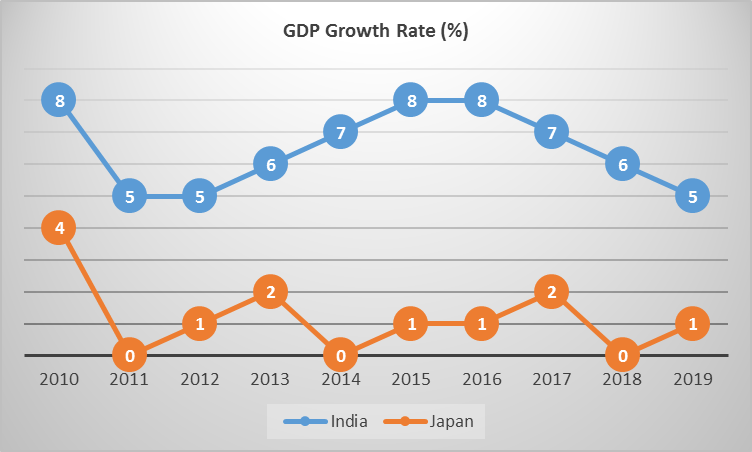
Figure 3: GDP growth rate of India and Japan
Source:(Data.worldbank.org, 2020)
The GDP growth rate of India represented through the blue-coloured line while the figures of Japan is represented through the orange-coloured line. The Indian figure for the GDP growth was 8.5% in 2010 which after a range of turbulence came down to 5% in 2019(Data.worldbank.org, 2020). Contrarily, the GDP growth rate of Japan fluctuates from 4.2% in 2010 to 0.65% in 2019 (Data.worldbank.org, 2020). Initially, it might seems that India is more promising than Japan but the GDP growth rate for India is normal for a developing country like India, while Japan is a developed state.
In both the case, J&J has its business opportunities to explore as India is a developing country having diversified needs. Such things could be facilitated by the pharmaceutical company by offering its various product segments to the growing needs of the Indians, especially the baby-care products and pharmaceutical items(Malmendier, 2018). Though the Japanese has lower GDP growth rate than India but it is a developed country and would provide a stable demand for the pharmaceutical drugs owing to its aged population. Therefore, J&J has to cater different segments of customer in India and Japan but in both the cases has suitable business opportunities to explore.
2. GDP per capita –
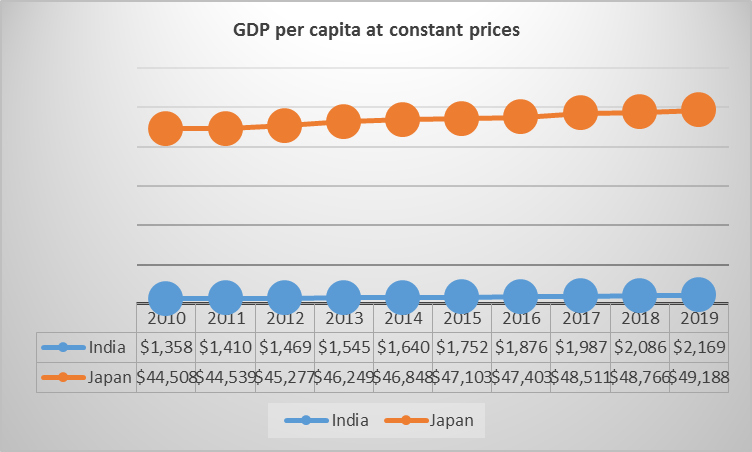
Figure 4: GDP per capita at constant prices for India and Japan
Source:(Data.worldbank.org, 2020)
The GDP per capita at constant prices refer to the GDP level shown through the price of a base year, say annually(Croitoru, Robescu, Oprisan, Duica, & Manolache, 2018). The above chart shows the progress that India has attained in the 10-year period from $1,357 in 2010 to $2,169 in 2019. It is a phenomenal stride attained by India as its GDP per capita near about doubled indicating developing affordability of the general Indians. It shows that the Indian side of J&J has huge possibilities of improvement owing to its developing economic activities and gigantic population. Both these elements provide huge business scope to encase by the pharmaceutical giants like J&J.
GDP per capita of Japan at constant prices has been progressive from $44,508 in 2011 to $49,188 in 2019(Data.worldbank.org, 2020). The figures show a marginal rise as compared to India but it is quite higher than the Indian figures. It indicates that the Japanese economy has fared well which could be exploited by J&J to promote its products to the fellow population to lead quality and better lifestyle. There is definitely a steep rise in the GDP figures in both the countries as the growing phenomenon of the Indian economy is evident but ought to cover miles to beat the Japanese figures.
3. Inflation rate –
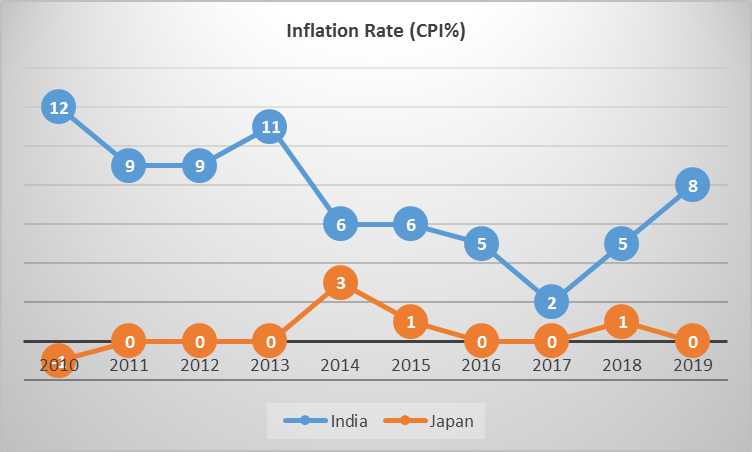
Figure 5: Inflation rate of India and Japan
Source:(Data.worldbank.org, 2020)
The inflation rate in India stood at approximately 12% in 2011 but came down to 7.66% in 2019 after witnessing certain fluctuations in 2017 when the figure dropped to 2.5% (Data.worldbank.org, 2020). So it is clear that India has experienced a higher level of inflation that it’s Japanese counterpart.The higher inflationary state of the Indians show that the cost of living is getting higher as its economy is getting stronger. Such phenomenon is also indicative of a higher level of consumption by the countrymen and it is definitely in favour of J&J.It shows that the Indians are in a stage where they would be able to buy the different kinds of products offered by J&J due to an improved consumerism state.
The Japanese scenario is little different as in 2010, the inflation rate was -0.72% reaching to its peak in 2014 at 2.76% but declining to 0.47% in 2019 (Data.worldbank.org, 2020). It indicates that the inflation rate is not at a bothering state in Japan unlike India as it is a developed nation. So the Japanese besides their pharmaceutical needs could be interested in the consumer healthcare products and other products and services offered by J&J as they possess much better affordability than the Indians.
4. Unemployment rate –
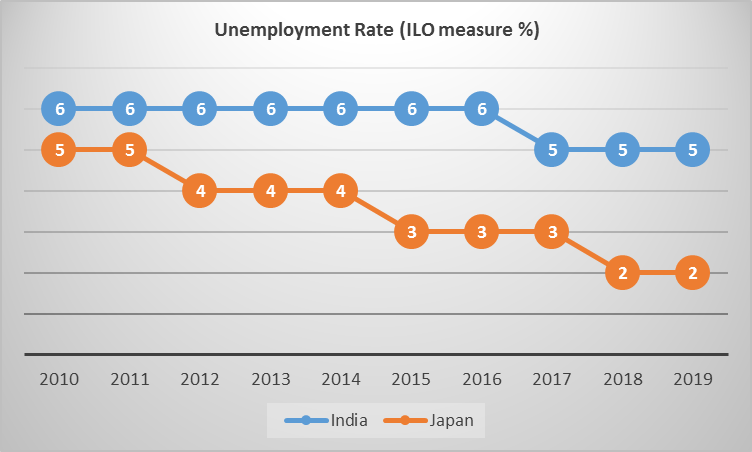
Figure 6: Unemployment rate in India and Japan
Source:(Data.worldbank.org, 2020)
The unemployment rate in Japan fell from 5.1% in 2010 to 2.4% in 2019 showcasing wide improvement in the 10-year gap (Data.worldbank.org, 2020). It indicates that majority of the Japanese are employed and able to sustain their livelihood delving an opportunity for J&J to offer sorts of products and enhance its business proposition. It definitely pose an effective situation wherein J&J could exploit an effective business scenario as majority of the Japanese are in a situation to buy the products that would be offered to them.
The chart above shows the alarming state of unemployment in India which was 5.63% in 2010 but remained the same in 2019 as well with a figure of 5.35%. It shows that the Indian authorities were not successful in bringing any new measures to curb the unemployment level while it stayed the same during the 10-year period(BBC News, 2019). But for businesses like J&J, India with a gigantic population and its poverty level could be utilised to promote its corporate social responsibilities. It would earn J&J a reputation in serving the unprivileged and strengthen the brand among the Indians posing for effective business opportunities.
5. General government balances –
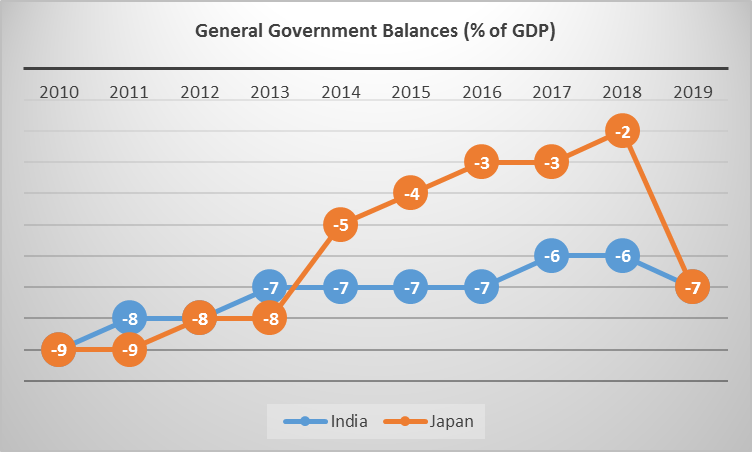
Figure 7: General government balances of India and Japan
Source: (Imf.org, 2020)
The above chart on general government balances for both the countries has negative percentage of government balances off GDP or net borrowings. Japan has a negative figure of 9.15% in 2010 while it was 7.4% in 2019 and for India it was 8.63% in 2010 reaching to 6.80% in 2019 stating that neither of the country is debt-laden(Imf.org, 2020).So J&J could explore the business opportunities available in those countries as Japan has a number of aged population who would be in dire need of its pharmaceutical drugs. The same is applicable for India having a billion strong population in need of the J&J various product segments.
6. Balance of payments –
The balance of payment (BoP) for India stood at -3.25% in 2010 but came down to -0.93% in 2019 indicating that the country has been more import-intensive than export. It is a natural phenomenon for a growing economy like India indicating that it needs to import goods for its needs, so J&J could fill the void in this scenario saving the country’s foreign reserves. Contrarily, Japan is blessed with a stable scenario with a figure of 3.88% in 2010 while it was 3.63% in 2019(data.imf.org, 2020). It shows that Japan would be able to provide a stable business scenario to J&J as the country is efficient in managing its foreign reserves and has its own pharmaceutical demands to be fulfilled by the company.
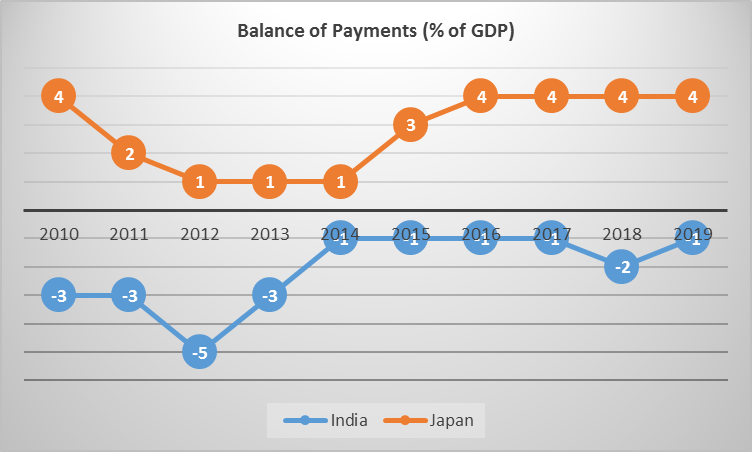
Figure 8: BoP for India and Japan
Source: (data.imf.org, 2020)
d. Monetary and fiscal policies of Japan and India:
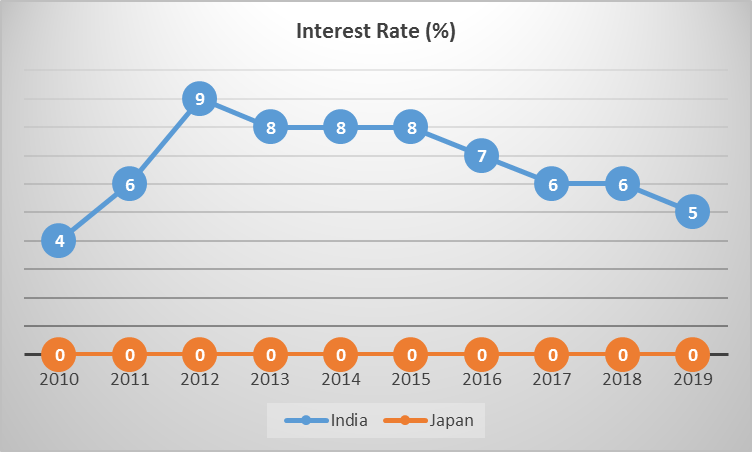
Figure 9: Interest rate in India and Japan
Source: (Boj.or.jp, 2020)
The central bank – Bank of Japan has a flat interest rate which declined from 0.1% in 2011 to -0.1% in 2020 (Boj.or.jp, 2020). The country has a negative interest rate of 0.1% indicating the fact that the lenders, say the banks and other financial institutions pay interest to the borrowers for taking loans. It stands for the fact that the Bank of Japan is striving to stimulate the economy making it an attractive proposition for the domestic and international business houses(The Japan Times, 2019). It gives the impression of the due support it provides to the business facilitiesin the country and J&J could also get aid in strengthening its commercial activities or running an advanced R&D facility.
The rate of interest in the Indian context is comparatively higher than Japan at 4% in 2020. The figure has been brought down from its height at 8.5% in 2012 gradually to the current state by its central bank, the Reserve Bank of India (RBI) (Rbi.org.in, 2020). The policymakers are striving for a cautionary move in terms of modifying its monetary policies as the interest rates would not only affect the borrowers but the depositors as well. India has a culture of keeping their savings in banks to grow for their retirement, so the RBI could not take to massive interest cuts affecting millions of Indians. Therefore, J&J could find it difficult to expand its business in India owing to the higher interest expenses.
e. Foreign trade policies for Japan and India:
Both Japan and India are liberal countries entering into a number of Free Trade Agreements (FTAs) like the ASEAN-India Trade in Goods Agreement, Japan-Australia Economic Partnership Agreement.The phenomenon would help businesses like J&J to have free flow of goods and services manufactured in those countries to reach out the global customers.
US$ is a highly traded currency in Japan and American organisations like J&J owing to its home currency could make out good deals in Japan (Croitoru, Robescu, Oprisan, Duica, & Manolache, 2018). The Japanese Yen is weaker than the US$ making it an attractive trade options with different countries as a weaker currency is affordable to most of the parties. So the Japanese authorities has kept the exchange rate lower enabling the business houses like J&J to get a competitive edge in the international trade scenario.
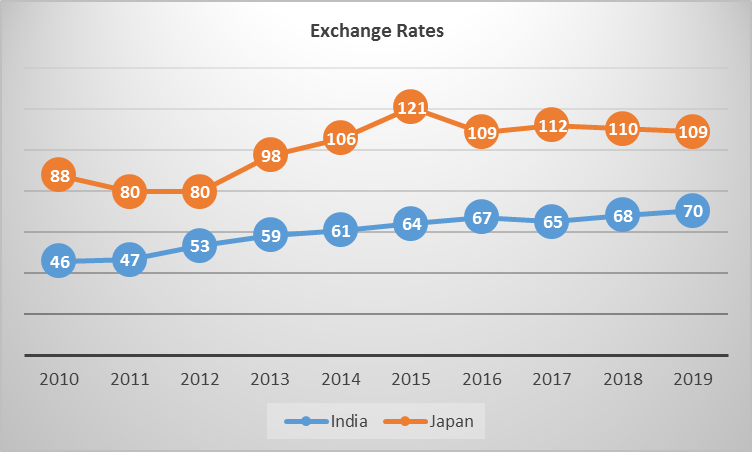
Figure 10: Exchange rates of India and Japan
Source: (Data.worldbank.org, 2020)
Japan stands a better exchange rate than India in terms of US$. Still the Indian currency alike its Japanese counterpart is attractive having a lower denomination in terms of the exchange rate in the international market. But Japan is a developed nation and stands a better scope in terms of business opportunity or economic fundamentals. Simultaneously, India with a billion strong population could render huge number of customers for the J&J products(BBC News, 2019). So the company ought to make distinctive choice like focusing on the healthcare of aged population in Japan while India is a young population focusing on its monopolistic competition.
References
Austin, S. (2020, January 15). Japan #3 in Overall Ranking. Retrieved from U.S.News.com: https://www.usnews.com/news/best-countries/japan
BBC News. (2019, February 18). India country profile. Retrieved from BBC News: https://www.bbc.com/news/world-south-asia-12557384
Boj.or.jp. (2020, July 13). The Basic Discount Rates and Basic Loan Rates (Previously Indicated as "Official Discount Rates") : ???? Bank of Japan. Retrieved from Boj.or.jp: https://www.boj.or.jp/en/statistics/boj/other/discount/index.htm/
Croitoru, G., Robescu, V. O., Oprisan, O., Duica, M., & Manolache, D. C. (2018). The prediction of managing change in the contemporary economy by using simulation and mathematical modeling. Journal of Science & Arts, 18(1), 139-158.
data.imf.org. (2020, July 13). Balance of Payments. Retrieved from data.imf.org: https://data.imf.org/?sk=7A51304B-6426-40C0-83DD-CA473CA1FD52&sId=1484255756662
Data.worldbank.org. (2020, July 13). GDP growth (annual %) - India | Data. Retrieved from Data.worldbank.org: https://data.worldbank.org/indicator/NY.GDP.MKTP.KD.ZG?locations=IN
Data.worldbank.org. (2020, July 13). GDP growth (annual %) - Japan | Data. Retrieved from Data.worldbank.org: https://data.worldbank.org/indicator/NY.GDP.MKTP.KD.ZG?locations=JP
Data.worldbank.org. (2020, July 13). GDP per capita (constant 2010 US$) - Japan, India | Data. Retrieved from Data.worldbank.org: https://data.worldbank.org/indicator/NY.GDP.PCAP.KD?end=2019&locations=JP-IN&start=2010&view=chart
Data.worldbank.org. (2020, July 13). Inflation, consumer prices (annual %) - India | Data. Retrieved from Data.worldbank.org: https://data.worldbank.org/indicator/FP.CPI.TOTL.ZG?end=2019&locations=IN&start=2010&view=chart
Data.worldbank.org. (2020, July 13). Inflation, consumer prices (annual %) - Japan | Data. Retrieved from Data.worldbank.org: https://data.worldbank.org/indicator/FP.CPI.TOTL.ZG?end=2019&locations=JP&start=2010&view=chart
Data.worldbank.org. (2020, July 13). Official exchange rate (LCU per US$, period average) - Japan, India | Data. Retrieved from Data.worldbank.org: https://data.worldbank.org/indicator/PA.NUS.FCRF?end=2019&locations=JP-IN&start=2010
Data.worldbank.org. (2020, July 13). Unemployment, total (% of total labor force) (national estimate) - Japan | Data. Retrieved from Data.worldbank.org: https://data.worldbank.org/indicator/SL.UEM.TOTL.NE.ZS?end=2019&locations=JP&start=2010
Dikshit, K. (2020, July 08). India | History, Map, Population, Economy, & Facts. Retrieved from Encyclopedia Britannica: https://www.britannica.com/place/India
Imf.org. (2020, July 13). General government net lending/borrowing: Percent of GDP. Retrieved from Imf.org: https://www.imf.org/external/datamapper/GGXCNL_NGDP@WEO/JPN/IND
India.gov.in. (2020, February 18). Economy | National Portal of India. Retrieved from India.gov.in: https://www.india.gov.in/topics/finance-taxes/economy
JapanGov. (2020, July 13). Find your Japan | The Government of Japan - JapanGov -. Retrieved from JapanGov: https://www.japan.go.jp/japan/findyourjapan/
jnj. (2020, July 13). About Johnson & Johnson. Retrieved from Content Lab U.S.: https://www.jnj.com/about-jnj
Latz, G. (2020, July 09). Japan | History, Flag, Map, Population, & Facts. Retrieved from Encyclopedia Britannica: https://www.britannica.com/place/Japan
Malmendier, U. (2018). Behavioral corporate finance. In Handbook of Behavioral Economics: Applications and Foundations 1 (pp. 277-379). London: North-Holland.
Rbi.org.in. (2020, July 13). Reserve Bank of India - Data Releases PR. Business economics assignment Retrieved from Rbi.org.in: https://www.rbi.org.in/Scripts/Pr_DataRelease.aspx?SectionID=369&DateFilter=Year
Redonda, A., de Sarralde, S., Hallerberg, M., Johnson, L., Melamud, A., Rozemberg, R., . . . von Haldenwang, C. (2019). Tax expenditure and the treatment of tax incentives for investment. Economics: The Open-Access, Open-Assessment E-Journal, 13(2019-12), 1-11.
The Japan Times. (2019, August 14). How does a negative rate policy work? | The Japan Times. Retrieved from The Japan Times: https://www.japantimes.co.jp/news/2019/08/14/business/negative-rate-policy-work/#.Xw1GlqEzbIU


