
Economic Analysis Assignment Exploring Australian Economy
Question
Task: You are a part of the elite team working with the Governor of the Reserve Bank of Australia, Dr Philip Lowe. You and your team headed by the Governor are mainly responsible for steenng the Australian economy towards growth. You hear there are indications that Dr Lowe s leaning towards a further fall in the cash rate from the current 1.5%. In addition, talks are that Australia’s GDP will fall bekw 3% in 2019. Some members in your team claim Australia’s slow growth is not only because of a slow growth in the domestic housing market but also because of Chinas economic slowdown. Some others have a different view. What is your finding? Dr Lowe is currently overseas attending an Economists Conference. He would prefer for you to present your findings as a video presentation. Your report must be 3000 words long and shouki be addressed to the Governor of Reserve Bank of Australia. You are meant to use all the relevant economic concepts that you may have covered in class and that you have researched to support your answer.
Answer
Executive Summary:
Australia is one of the major economies of the world. In recent times, it is seen that the growth rate of Australia has fallen significantly and such slowdown has been seen after the Great financial Crisis. The main two reasons for the slowdown in growth has been seen due to the slowdown in the real estate or property industry and the slowdown in Chinese growth rate and thus the export sector of Australia. In this economic analysis assignment study both the export and real estate sectors of Australia are presented and their impact on the economy has been highlighted. The probable recommendations and conclusion are also drawn in this context.
Introduction:
In present economic scenario it can be said that there is interdependence among various countries and this relationship helps in the growth and development in the long-run. Australia is a major economy is recent times and one of the sustained developed countries. It has continuously maintained its growth rate and has stabilised its economy through proper policy implementation. The standards of living for the county are maintained at a high level and it has achieved their economic goals. However, in recent times there has been a slump in the growth rate for Australia in 2018-19. Australia has registered the slowest growth rate since the Great Financial Crisis of 2008-09 (Www2.deloitte.com, 2019). In the March of 2019, the growth rate of Australia was 1.8%, which is the weakest growth rate after the GFC. The two main reasons for such slowdown in the growth rate of Australia has been identified as the slowdown in the housing and property sector of Australia and the slowdown in the Chinese economy. The assumption is also made that the growth rate Australia will be below 3% in 2019. The main aim of this economic analysis assignment report is to present the economic scenario of Australia in the past and recent times and identifying and analysing the main reasons for the slowdown in the growth rate. This report is prepared for the Governor of the Reserve Bank of Australia Dr Philip Lowe. According to Dr Lowe the present cash rate in 1.5% and in order to recover from the slowdown, the cash rate needs to be reduced ever further. In this report, that aspect has been highlighted as well. Finally, conclusion and recommendations are drawn.
How GDP Growth of Australia contributes to economic analysis?
The GDP or the Gross Domestic Products are the marketed value for all the goods and services that are produced in a specific time period. It is one of the elite measures of the well-being and health of the economy. It is very important for a nation to maintain its GDP growth rate. Australia has balanced it GDP growth rate in the past decades. However in recent times it has slowed down. In 2017, Australia had registered 2.34% growth rate and in 2018, it was 2.84%. Australia has faced recession for the 3rd consecutive quarter as the GDP per capita has also fallen. The slowdown had started from the last quarter of 2018 and it is continuing in 2019 (Deloitte Insights, 2019). The slowdown has been according to the seasonally adjusted terms and the market expectations. In December the growth rate has also accelerated which continued till the first quarter of 2019. It can be assumed that the recovery can be due to policy implementations and government intervention. In the following table, GDP growth rate of Australia in various quarters since 2009 can be shown (Deloitte Insights, 2019).
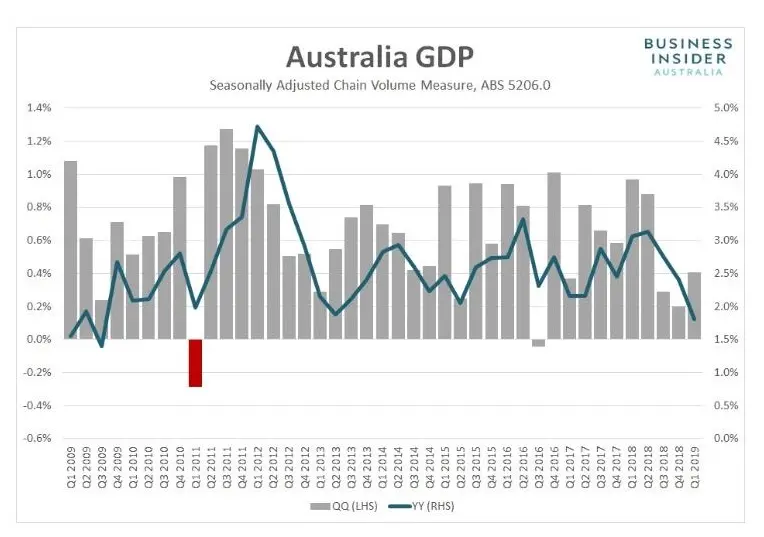
Source: (Scutt, 2019)
Share of Housing and Property Sector in Australian economic analysis:
Housing and property sector is one of the major contributing sectors in the GDP of the country. It has been estimated that the sector contributes around 6.6 trillion dollars in the Australian economy. The Property Council had estimated in 2018 that the property sector has the strongest footprint in this economy and no other economy has such stronghold of the property sector. Thus it can be said that if the property sector is affected then that will also affect the GDP growth of the economy as a large amount and percentage of the GDP comes from the property and housing sector in Australia. In the report by the Property Council, they had not included the ownership of dwellings (Australian Financial Review, 2019). However, the operations related with property development like business, financial service, the construction of non-residential and residential properties were included in the definition. Thus it can be stated that the property and housing sector is an important factor of growth. Now some of the statistics outlining the economic analysis can be shown to identify the contribution of property sector and the housing sector in the Australian economy (Wickens, 2012).
In the year 2015-16 the housing sector contributed 13% in the total GDP and the estimated contribution was around $202.9 billion. The housing sector additionally contributed to $254 billion through the flow-in of goods and services (Australian Financial Review, 2019). In the following diagram the direct contribution of several sectors in the GDP of the economy is shown. It can be seen in the diagram that the contribution of the property sector is much larger than any other industry in the economy (Robinson, Nguyen and Wang, 2017).
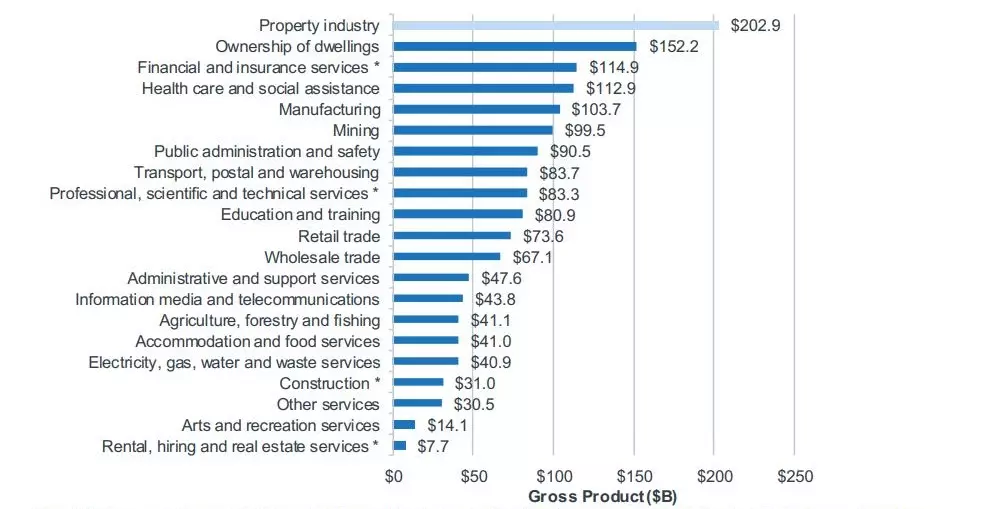
Source: (Cdn2.hubspot.net, 2019)
Apart from the value creation, it also contributed significantly to the employment sector as well as a large sum of people are employed in the industry. In the year 2015-16, 13.8% people were employed in the property sector and the estimated numbers were around 1.43 million people. Apart from that there is also creation of Full Time Employment (FTE) jobs through low-in activities. In 2015-16, 1.62 million FTE jobs were created through such flow-in activities in the sector. In the following table the contribution of the employment by industries can be illustrated (Cdn2.hubspot.net, 2019).
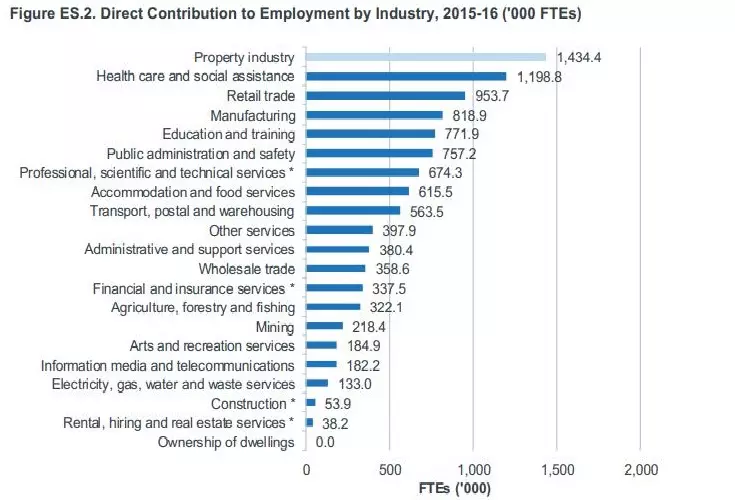
Source: (Cdn2.hubspot.net, 2019)
Thus it can be seen that the contribution of the property sector is significant. It can also be highlighted that 26.9% of the salaries and wages that are paid to the workers come from the property sector in Australia. The housing sector is the main contributor of the property sector in Australia (Cdn2.hubspot.net, 2019). In the following diagram the direct flow-in of the property sector can be highlighted. In the diagram below the gross product, the incomes and the employment in each property component is highlighted in absolute figure and in percentage terms. Thus the total of all these contributions is close to 30% and thus slowdown in this sector can significantly affect the growth of the nation (Scutt, 2019).
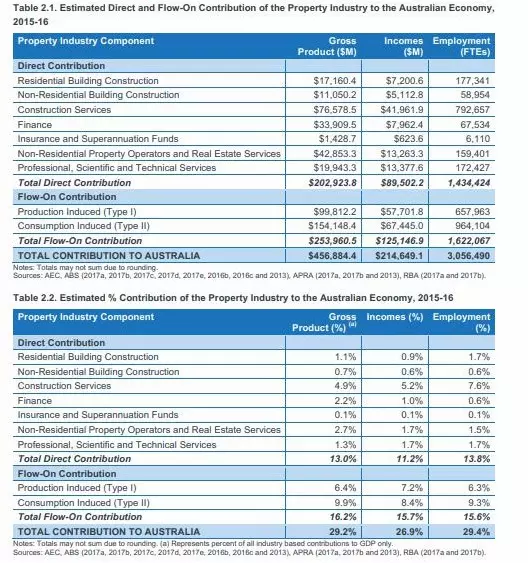
Source: (Cdn2.hubspot.net, 2019)
After analysing the diagram provided in this economic analysis task, it can also be stated that the contribution of the housing sector is significant for both central and state government. In 2015-16, the property related tax revenue amounted to $28.1 billion. The biggest contributor was the capital gains tax which was $11.2 (39.7%). After that the major contributor was the income tax ($9.1 billion or 32.2%) and GST ($7.8 billion or 27.8%). The property sector contributes through tax from residential and non-residential sector plus additional rates, fees and charges. The rates, fees and charges contributed $87.9 billion in 2015-16. In the following table the property taxes paid to the Australian government can be shown (Wickens, 2012).
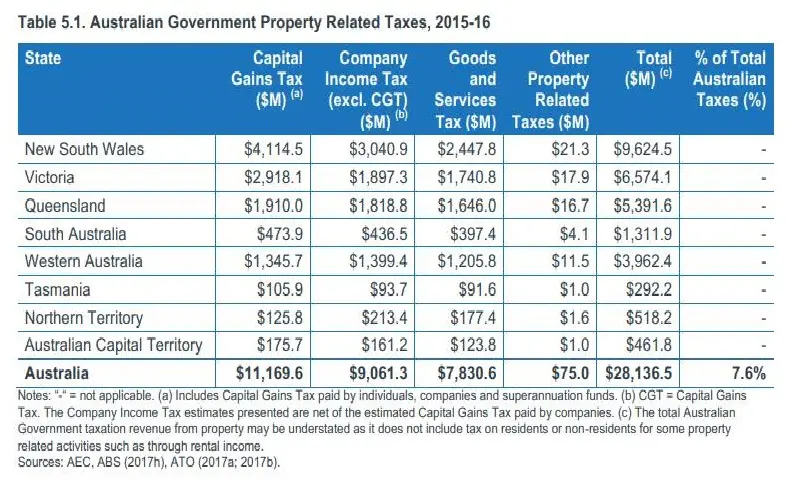
Source: (Cdn2.hubspot.net, 2019)
In the residential and the non–residential domain the properties are developed in order to meet the needs of the consumers. It can also be said that importance of property sector has significantly increased over the years. It has been established that its contribution is the highest in the economy. In the following table the continuous increase in the property sector can be shown since 20106-07 to 2015-16. The forecast is also made regarding increasing contribution towards the property sector (Robinson, Nguyen and Wang, 2017).
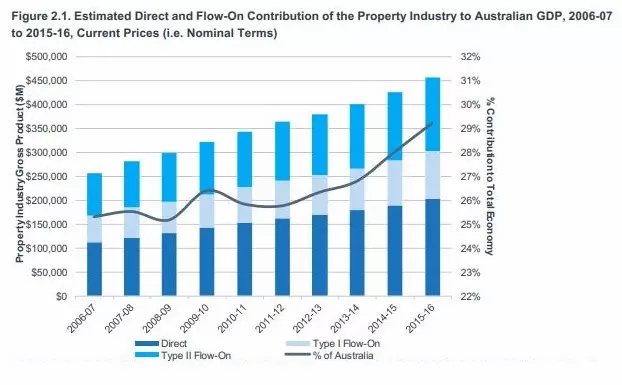
Source: (Cdn2.hubspot.net, 2019)
In the following table the trend of annual growth in the employment industry in both direct and flow-in employment is shown from 2006-07 to 2015-16.
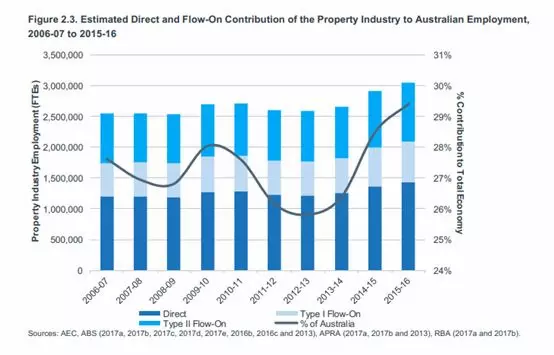
Source: (Cdn2.hubspot.net, 2019)
Thus it can be said that the property sector has significant stronghold in the Australian economy. Recent slowdown in this sector has thus affected the growth of the Australian economy. In the last 5 years the housing prices had increased significantly. However, after 2017, there has been a decline in the housing prices. In the following diagram, the housing price trend is shown (Cdn2.hubspot.net, 2019).
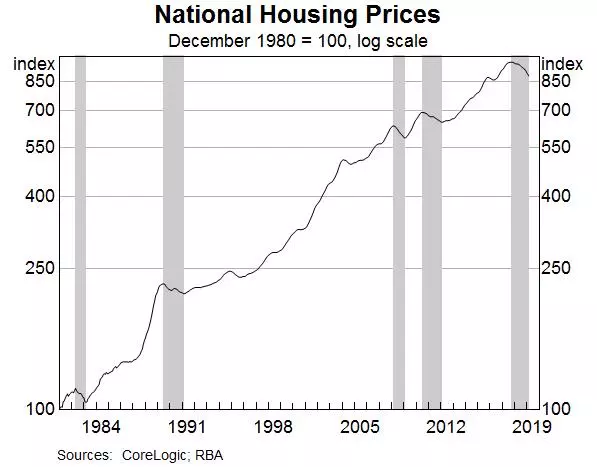
(Lowe[*] Governor, 2019)
In this regards it can be said that when the prices are falling, then people fear for capital loss in the market and they stay away and wait for the valuation to get better and thus the market cannot attract investors (Renne, 2018). In the following diagram the foreign investment in the residential sector can be shown from 2001 to 2018. It can be seen in the in the middle of 2014-1018, there was a significant increase in the foreign direct investment, mainly from China in the property sector. However that has reduced in recent times. Similarly there has been a slump in housing credit growth rate, and housing loan approvals (Lowe[*] Governor, 2019).
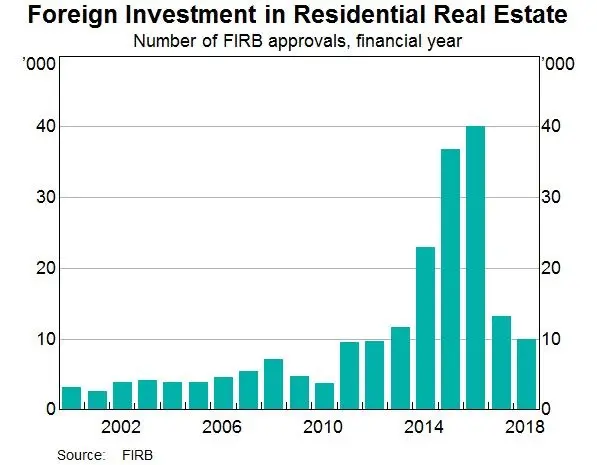
(Lowe[*] Governor, 2019)
Now in the present Economic analysis task, the export sector of Australia can be discussed and its impact on the growth and recent slowdown can be elaborated.
Export sector share in Australia GDP
Trade is one of the important vehicles of growth and development of a nation especially in global perspective. In recent times, international relationships are strengthened through trade (imports and exports). Australia also shares good relationships with its neighbouring countries and other major global giants. A country can have trade deficit if its imports are larger than its export and it can have trade surplus if the exports are greater than imports. Exports can be referred as the market value of goods and services that are produced within a nation and then sold to another nation. Thus exports are positive contributors towards the GDP of a nation. In 2016, the contribution of the contribution of the export sector in the GDP of the country was around 18.87% (TheGlobalEconomy.com, 2019). In the following table the contribution of the export sector in the GDP of Australia can be shown from 1960 to 2016 (Poon and Brownlow, 2014).
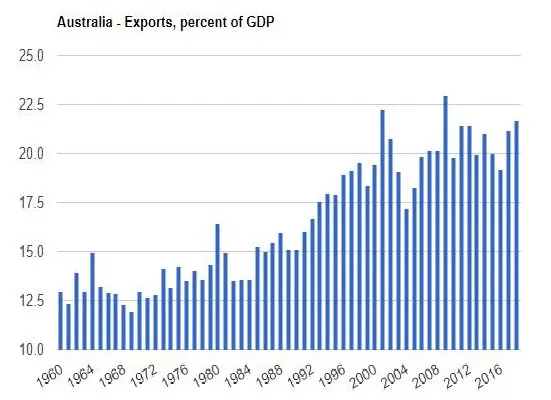
Source: (TheGlobalEconomy.com, 2019)
From the diagram presented in this Economic analysis assignment, it can be seen that the percentage contribution of the export sector has increased over the years in Australia. The maximum contribution of 1969 the sector was achieved at 23% in the year 2019. The minimum contribution was gained in at 11.95%. The average contribution of the sector is 16.5% for this time period. It can be viewed that the export sector has grown in 2-3 folds due to globalisation. In the last few years, it was viewed that the average export was around 21% which means one-fifth of the goods and services that are produced within the country are exported internationally (Aph.gov.au, 2019). It can also be stated that Australia is better than some of the major economies in the world but it is also behind many other nations. In the following diagram the exports, imports and trade balance as a proportion of the GDP are shown. In the diagram, it can be seen that the trade balance has been positive and negative in different time period (Meng and Deng, 2013).
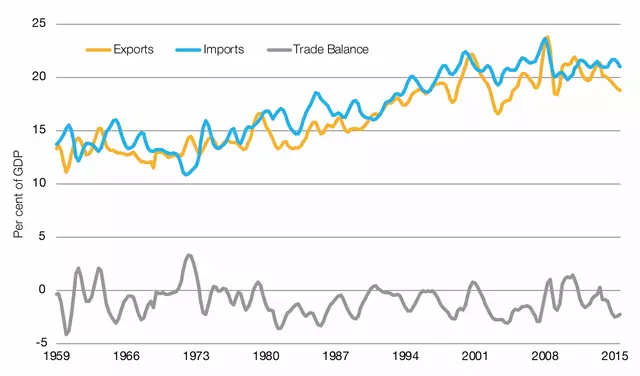
Source: (Aph.gov.au, 2019)
In the following diagram, the export, import and trade balance of other G20 countries can be shown.
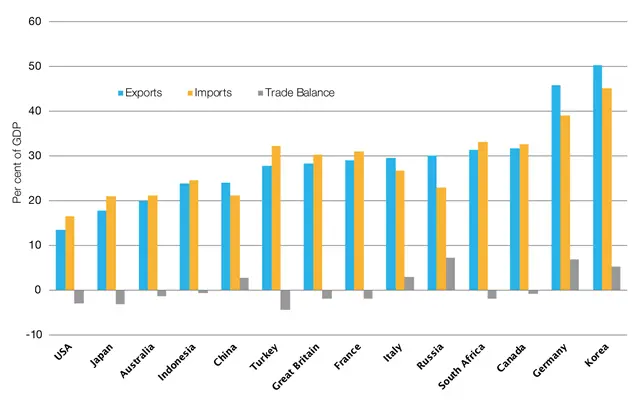
Source: (Aph.gov.au, 2019)
In the above table it can be seen that Australia has performed better than USA and Japan in terms of trade balance and import and export. However, Australia is behind economies like Korea, Germany and Canada. However, it is also evident that a significant part of Australian GDP is composed of export earnings. Thus impact of a slowdown in the export sector can be felt in the growth rate as well. Now the relationship between the export sector slowdown mainly due to Chinese economy slowdown and the recent growth slump of Australia can be discussed (Aph.gov.au, 2019).
Economic Slowdown of China and Impact on Australian Growth;
Australia has been long dependant on Chinese money as they have a strong trade relationship. However, such relationship can also cause distress for the economy if there is slowdown in either of the economies. Such interdependence thus has its own drawbacks. It is also evident that China is the second largest economy of the world and thus the slowdown of the economy can impact many other interdependent economies. The slowdown can also cause a ripple effect in related economies all over the world (Groenewold, 2018). Australia exports to various economies but one-third of its exports go to China. It is evident that Chinese economy has slowed down in 2018-19, mainly due to its ongoing tariff war with USA. Such tariff rates are unfavourable for trade relations and earnings. Due to such tariff war, there is a slowdown in the Chinese growth rate as well as it impacted the trade relations with other countries including Australia. In December 2018, the exports of China decreased by 4.4% and imports increased by 7.7% (Groenewold, 2018). The growth rate of China also lowered in the 4th quarter of 2018 to the record lowest rate of the decade at 6.5%. Such slowdown of economic growth, as a result has affected various other economies as well as global organisations like Apple and many other which has mass consumer or suppliers in China. As a result, Australian economy has been affected as well. In the following table top export economies of Australia are shown in various years since 2000 to 2015. Their share of total growth from Australia is also featured (Garnaut, Johnston and Song, 2017).
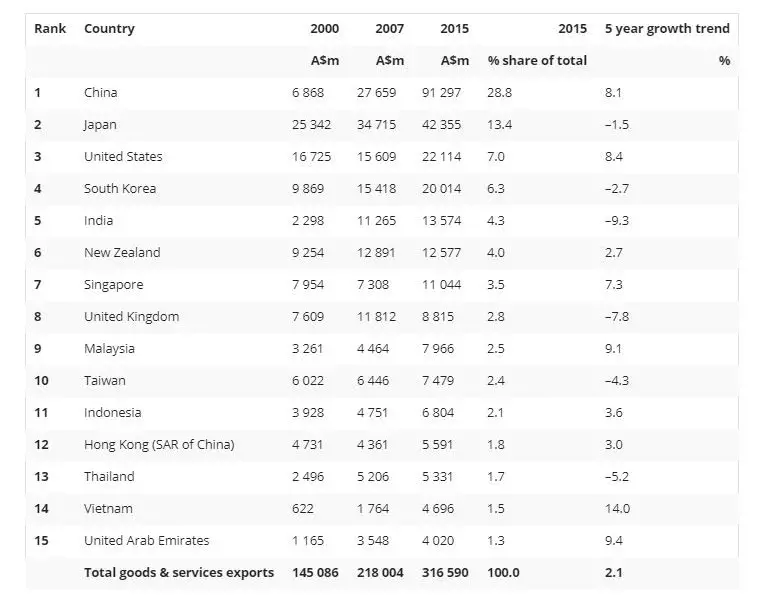
Source: (Aph.gov.au, 2019)
In the table above, it can be seen that China is the major exporter of Australian goods and services. In 2018, the percentage share of Chinese exports was 28.8% and after that comes Japan and USA with 13.4% and 7.0% share respectively. Thus it is clear that China is the biggest market for Australian exportable. The main export goods from Australia to China are Iron Ore and Coal (Aph.gov.au, 2019). These two products accounts for 30% of the entire exports to china and it is worth $120 billion. The education service comes next and contributes $32.4 billion. In 2017-18, the contribution of exports from China to the Australian GDP was $192.6 billion. In the following table the Australia’s both ways trading with other economies is shown (Di Fatta et al., 2018).
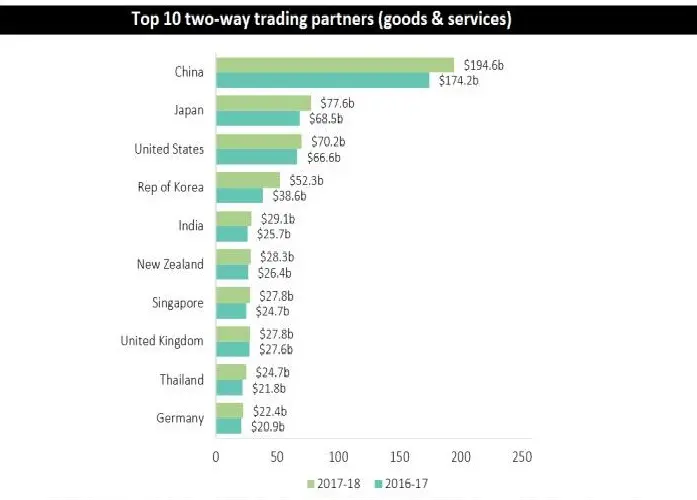
Source: (ABC News, 2019)
In the table above, the share and contribution of Chinese exports are seen in recent years. They are twice the size of Japan and USA. Thus recent slowdown in the growth of China and its probable trade war scenario has also affected the growth rate of Australia and it is one of the major reasons for the recent trend in Australian growth rate (Chan, 2019).
Results and Analysis:
From the tables and discussions illustrated in this Economic analysis assignment, it can be established that the slowdown in the Housing market and the slowdown of the Chinese economy are major contributors towards recent slowdown of the Australian economy. The housing prices have decreased in recent years, Such decline is not unprecedented even though the magnitude of the decline is unusual. Such fall in the housing prices were seen in 2008 and 2010 during the GFC. It is also evident that in CPI inflation adjusted terms the rate of decline was much higher in those years than it is now (JONES, 2019). There has also been a reduction in the growth rate of rent. It has also been established that reducing prices has made investors less hopeful about the capital losses. However, it can also be expected that at some point the reduced prices may attract buyers in the market and that can create additional demand. In turn such creation of demand in the market can lead to increase in the prices in future (Yardney, 2019). When the buyers find it easy to buy houses, then investors can be attracted again in the market. It is a housing cycle where the momentum and the sentiment always shift and such cycles have been seen in the past. On the other hand, in terms of trade it can be said that Australian dependence on the Chinese economy is a major reason for the growth slump. It has also be established the extent of resources that are exported to China. Thus if share of exports of Australia to its GDP is 22% and the share of China is 29%, then the share of Chinese exports to GDP will be 5.25%. This has impacted the economy and thus measures are required (Beeson and Zeng, 2017). So it can be assessed that less dependence on the economy and more diversified trade relation with other stable economies can help in recovering from the situation.
Recommendations and Solutions:
In such scenario it is very important to implement various stabilisation policies like Fiscal and Monetary policies in order to induce growth rate in the economy. Taxation and government expenditure are Fiscal measures. On the other hand, money supply and interest rates are monetary measures. The government can increase the government expenditure generate more GDP in the economy. Increase in tax rates can have other negative impact on the businesses and the investors. So, tax rates should not be increased (Mozo.com.au, 2019).
Cash rate is another instrument that can be used in order to tackle the present situation. Cash rates are the interest rates that are charged by the central banks to the commercial banks on their lending. Thus the cash rate also impacts the rate o interest prevailing in the economy. At present, the cash rate is 1.5%. The cash rate should remain at 1.5% and it should not be reduced further. In this context it can be said that 1.5% cash is historically low as it is and it also has stimulatory impact (Beeson and Zeng, 2017). This rate is supporting the job creation and it has also helped in reaching the targeted inflation rate. Low unemployment and interest rate has allowed people to repay their loans and it is estimated that only less than 5% household which are owner-occupied has negative equity and they are meeting their obligations of mortgage. Thus, reducing the cash rate further will not serve its purpose. Thus the cash rate should remain at 1.5% (Lowe[*] Governor, 2019).
Conclusion
After analysing the aspects of Economic analysis assignment study it can be said that Australia being the major economy has fared well in the past. The paper the Chinese slowdown in the growth impacting the export sector and the slowdown in the housing market has been identified as the major contributors in the slowdown. It is very important to achieve full employment in the industry. If the labour market is flourished then it will increase the wage rate and the household incomes will increase further generating household consumption. The fall in the housing prices will also create demand in the economy. The slump in the housing prices is one of the cycles that has been seen previously and it is proven historically that the economy recovers eventually through creation of demand and thus it can attract back the investors (Bagnall, 2017). It has been seen that the economic indicators are showing signs of recovery in 2019 with strong employment growth and wage rate pick up. Thus it can be concluded that the economy will recover itself. However, the monetary policies instruments can be implemented if required in future.
Economic analysis assignment assignments are being prepared by our economics assignment help experts from top universities which let us to provide you a reliable best assignment help service.
Reference List
Aph.gov.au. (2019). Australia’s trade in figures – Parliament of Australia. Economic analysis assignment [online] Available at: https://www.aph.gov.au/About_Parliament/Parliamentary_Departments/Parliamentary_Library/pubs/BriefingBook45p/AustraliaTrade [Accessed 27 Aug. 2019].
Australian Financial Review. (2019). Australia's growth rate slowing at twice the speed of peers, says IMF. [online] Available at: https://www.afr.com/policy/economy/australia-s-growth-rate-slowing-at-twice-the-speed-of-peers-says-imf-20190409-p51c74 [Accessed 27 Aug. 2019].
Bagnall, K. (2017). A new perspective on Australia and China. History Australia, 14(4), pp.666-667.
Beeson, M. and Zeng, J. (2017). Realistic Relations? How the Evolving Bilateral Relationship is Understood in China and Australia. Pacific Focus, 32(2), pp.159-181.
Cdn2.hubspot.net. (2019). ECONOMIC SIGNIFICANCE OF THE PROPERTY INDUSTRY TO THE AUSTRALIAN ECONOMY. [online] Available at: https://cdn2.hubspot.net/hubfs/2095495/_Industry%20Campaign/REPORTS/ECONOMIC%20SIGNIFICANCE%20OF%20THE%20PROPERTY%20INDUSTRY%20TO%20THE%20AUSTRALIAN%20ECONOMY%20-%20FULL%20REPORT.pdf [Accessed 27 Aug. 2019].
Chan, A. (2019). Silent Invasion: China’s Influence in Australia, by Clive Hamilton. Richmond, Australia: Hardie Grant Books, 2018. ix+356 pp. A$33.99 (paper). The China Journal, 81, pp.236-238.
Deloitte Insights. (2019). Australia. [online] Available at: https://www2.deloitte.com/us/en/insights/economy/asia-pacific/australia-economic-outlook.html [Accessed 27 Aug. 2019].
Di Fatta, D., Gera, N., Tyagi, L. and Grisold, T. (2018). Export knowledge. Kybernetes.
Garnaut, R., Johnston, L. and Song, L. (2017). Where Is the Chinese Economy Going? A Forum on Contemporary Policy and Performance. Australian Economic Review, 50(4), pp.441-449.
Groenewold, N. (2018). China's ‘New Normal’: How will China's Growth Slowdown Affect Australia's Growth?. Australian Economic Papers, 57(4), pp.435-445.
JONES, C. (2019). MACROECONOMICS. [S.l.]: W W NORTON.
Lowe[*] Governor, P. (2019). The Housing Market and the Economy | Speeches. [online] Reserve Bank of Australia. Available at: https://www.rba.gov.au/speeches/2019/sp-gov-2019-03-06.html [Accessed 26 Aug. 2019].
Meng, X. and Deng, X. (2013). Interest Rate and Foreign Exchange Sensitivity of Bank Stock Returns: Evidence from China. Multinational Finance Journal, 17(1/2), pp.77-106.
Mozo.com.au. (2019). What is the cash rate and how does it affect you?. [online] Available at: https://mozo.com.au/interest-rates/articles/what-is-the-cash-rate-and-how-does-it-affect-you [Accessed 27 Aug. 2019].
Poon, J. and Brownlow, M. (2014). Competency expectations for property professionals in Australia. Journal of Property Investment & Finance, 32(3), pp.256-281.
Renne, J. (2018). Transportation and land development in Australia and North America: Property values, the private sector, housing and travel behavior. Research in Transportation Economics, 67, pp.1-2.
Robinson, T., Nguyen, V. and Wang, J. (2017). The Australian Economy in 2016-17: Looking Beyond the Apartment Construction Boom. Australian Economic Review, 50(1), pp.5-20.
Scutt, D. (2019). Australia's economic slowdown could be about to get even worse. [online] Business Insider Australia. Available at: https://www.businessinsider.com.au/australia-economy-gdp-growth-rba-cash-rate-2019-2 [Accessed 27 Aug. 2019].
TheGlobalEconomy.com. (2019). Australia Exports, percent of GDP - data, chart | TheGlobalEconomy.com. [online] Available at: https://www.theglobaleconomy.com/Australia/Exports/ [Accessed 27 Aug. 2019].
Wickens, M. (2012). Macroeconomic Theory. Princeton: Princeton University Press.
Www2.deloitte.com. (2019). 2018 Real Estate Outlook: The Australian Perspective. [online] Available at: https://www2.deloitte.com/content/dam/Deloitte/au/Documents/Real%20Estate/deloitte-au-dre-real-estate-outlook-2018-australian-perspective-150218.pdf [Accessed 27 Aug. 2019].
Yardney, B. (2019). Do you understand the significance of the property industry in Australia?. [online] Property Update. Economic analysis assignment. Available at: https://propertyupdate.com.au/do-you-understand-the-significance-of-the-property-industry-in-australia/ [Accessed 27 Aug. 2019].


