
Economics Assignment Case Analysis Based On Microeconomic Concepts
Question
Task:
Answer the following questions through this economics assignment:
Question 1
Assume that Canada is an importer of smartphones and that there are no trade restrictions. Canadian consumers buy 1 million smartphones per year, of which 300 000 are produced domestically and 700,000 are imported.
a. Suppose that a technological advance among Japanese smartphone manufacturers causes the world price of smartphones to fall by $50. Draw a graph to show how this change affects the welfare of Canadian consumers and Canadian producers and how it affects total surplus in Canada.
b. After the fall in price, consumers buy 1.5 million smartphones, of which 200,000 are produced domestically and 1.3 million are imported. Calculate the change in consumer surplus, producer surplus, and total surplus from the price reduction.
c. If the government responded by putting a $50 tariff on imported smartphones, what would this do? Calculate the revenue that would be raised and the deadweight loss. Would it be a good policy from the standpoint of Canadian welfare? Who might support the policy? Who might oppose it
d. Suppose that the fall in price is attributable not to technological advance but to a $50 per smartphone subsidy from the Japanese government to Japanese industry. How would this affect your analysis?
Question 2
A local drama company proposes a new theatre in Ottawa. Before approving the building permit, the city planner completes a study of the theatre’s impact on the surrounding community.
a. One finding of the study is that theatres attract traffic, which adversely affects the community. The city planner estimates that the cost to the community from the extra traffic is $7 per ticket. What kind of an externality is this? Why?
b. Graph the market for theatre tickets, labelling the demand curve, the socialvalue curve, the supply curve, the social-cost curve, the market equilibrium level of output, and the efficient level of output. Also show the per-unit amount of the externality.
c. On further review, the city planner uncovers a second externality. Rehearsals for the plays tend to run until late at night, with actors, stagehands, and other theatre members coming and going at various hours. The planner has found that the increased foot traffic improves the safety of the surrounding streets, an estimated benefit to the community of $5 per ticket. What kind of externality is this? Why?
d. On a new graph, illustrate the market for theatre tickets in the case of these two externalities. Again, label the demand curve, the social-value curve, the supply curve, the social-cost curve, the market equilibrium level of output, the efficient level of output, and the per-unit amount of both externalities.
e. Describe a government policy that would result in an efficient outcome. (3 marks)
Question 3
Any Income tax schedule embodies two types of tax rates—average tax rates and marginal tax rates.
a. The Average Tax rate is defined as the total taxes paid divided by income. For the proportional tax system (see Table 12.8, p. 274) what are the average tax rates for people earning $25,000, $50,000 and $100,000. What are the corresponding average tax rates in the regressive and progressive tax systems?
b. The marginal tax rate is defined as the extra taxes paid on additional income divided by the increase in income. Calculate the marginal tax rate for the proportional tax system as income rises from $25,000 to $50,000. Calculate the marginal tax rates from the regressive and progressive tax systems.
Question 4
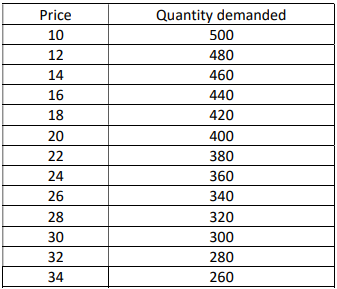
The market for chicken pie in Ottawa is competitive and has the following demand schedule:
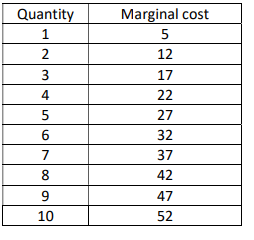
Each producer in the market has fixed cost of $24 and the following marginal cost:
a. Compute each producer’s total cost and average total cost for 1-10 pies.
Hint: Find the first variable cost when Q=1, and then TC using MC.
b. The price of a pie is now $26. How many pies are sold in the market? How many pies does each producer make? How many producers are there? How much profit does each producer earn? Hint: Find Q when P=MC; Market demand is a summation of all individual firms’; profit=TR-TC
c. Is the situation described in part (b) a long-run equilibrium? Why or why not? Hint: Conditions for long-run equilibrium
d. Suppose that in the long run there is free entry and exit. How much profit does each producer earn in the long-run equilibrium? What is the market price and number of pies each producer makes? How many pies are sold? How many pie producers are operating? Hint: Part (a) result; may not get exact number, an approximation is acceptable, but show steps.
Question 5:
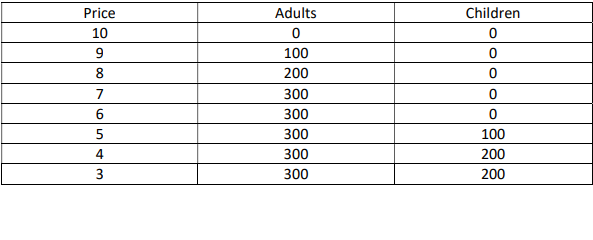
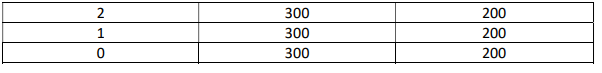
Ottawa is a town with 300 adults and 200 children, and you are thinking about putting on a concert to entertain your community and make some money. This type of concert has a fixed cost of S2,000, but selling an extra ticket has zero marginal cost. Here are the demand schedules for adults and children in your community:
a. To maximize profit, what price would you charge for an adult ticket? For a child's ticket? How much profit do you make? Explain.
b. The town council passes a law prohibiting you from charging different prices to different customers. What price do you set for a ticket now? How much profit do you make? Hint: Explain with a diagram and/or complete the table.
c. Who is worse off because of the law prohibiting price discrimination? Who is better off? Hint: Quantify the changes in welfare.
d. If the fixed cost of the play was $3,000 rather than $2,000, how would your answers to parts (a), (b), and (c) change?
Answer
Answer to question 1 of economics assignment:
a.To explain the situation of the Canadian smartphones, supply and demand framework can be considered. Underpinning the demand and supply framework, figure 1 has been drawn where the X axis has presented the output (Q) and price (P) has been presented in the Y axis. It is assumed that initial equilibrium takes place at E0 where the price is P0 and output is domestically produced. Here the consumer surplus is A portion and producer surplus is B+D+H. Now, when the trade occurs, price fall to P1 and the consumer surplus become A+B+C whereas, producer surplus become D+H only as the producers earns less revenue through price reduction (Condorelli and Szentes 2020). Hence, the total surplus due to the trade is A+B+C+D+H. Now, when the technological development takes place, then consumer surplus become A+B+C+D+E+F+G and the producer surplus become H. Hence, through the development in the technology, there will be increase in the consumer surplus become D+E+F+G and producer surplus reduces by -D. Hence, after change in the technology total surplus become A+B+C+D+E+F+G+H. Hence, through the development in the technology, there will be rise in the total surplus by E+F+G amount.
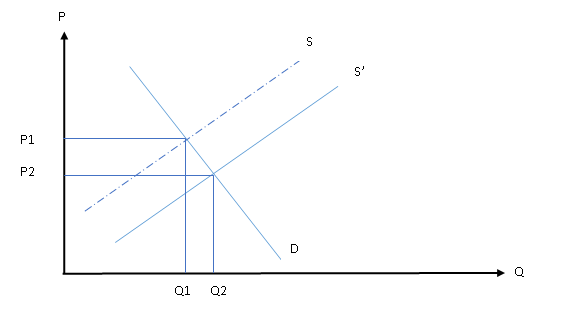
Figure 1: Demand and supply framework
Hence, consumer surplus increase by area D+E+F+G.
Producer surplus reduced by area D
Total surplus increase by area of E+F+G
b.
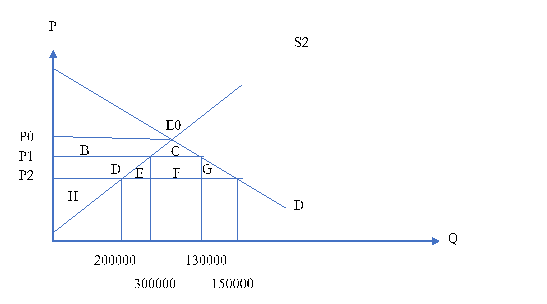
Figure 2: Supply and demand situation
Consumer surplus change = area of D+E+F+G = Area of (D+E+F) + Area of G
Area of D+E+F = length * breadth = 130000 * 50 = 6500000
Area of G = ½ * Base * Height = ½ * 200000 * 50 = 5000000
Hence, consumer surplus = 6500000 + 5000000 = $11500000
Producer surplus change = area of D = Area of D+E – Area of E
Area of D+E = lengths * breadth = 300000 * 50 = 15000000
Area of E = ½ * Base * Height = ½ * 100000 * 50 = 2500000
Hence, producer surplus is = $15000000 - $2500000 = $12500000
Change in total surplus = Area of E+F+G = Area of E + Area of F + Area of G
Area of E = $2500000
Area of F = ½ * Base * Height = ½ * 130000 * 50 = $3250000
Area pf G = ½ * Base * Height = ½ * 150000 * 50 = $3750000
Hence, total surplus = $2500000 + $3250000 + $3750000 = $9500000
Thus, due to the change in the technology, consumer surplus increase by $11500000, producer surplus falls by $12500000 and total surplus increase by $9500000.
c.
If the government impose tax of $50, then the price of the smartphones become same as pre-technological development situation. With the price returning to initial situation, demand of the phones will also return to initial situation where total demand will be 1million phones where 700000 will be imported and 300000 will be produced domestically.
Hence, government will earn $50 tax revenue against each smartphone import.
Total tax revenue = $50 * 700000 = $35000000
Thus, with the imposition of the tax government will earn $35 million as tax revenue that can be used in infrastructural development for economic growth of the state. However, there will be deadweight loss due to the transaction. Amount of deadweight loss will be equal to area of E+G. Hence total deadweight loss due to the transaction will be ($2500000 + $3750000) = $6250000. Total tax revenue is much higher than the deadweight loss and thus it total social welfare will surpass the loss (Graham 2020). Thus, the tax will be a good policy from Canadian welfare standpoint.
Government and producers might support the policy, whereas, consumers might oppose the same as it will reduce the consumer surplus.
d.If the price of smartphones is attributed not by the technological advancement but by subsidy from Japanese government, then it will not influence the world price. As the price is domestically influenced by the subsidy and not by the technological development, price in world market will not reduce rather reduce in domestic market only.
Answer to question 2:
a.As per the given information, due to the theatre in Ottawa, people of the community will be adversely affected due to the extra traffic. Hence, this type of externality is negative externality as cost suffered by the community is a consequence of the operation by the theatre. Hence, the operation of the theatre leads to negative impact on the community through increasing traffic and thus it can be termed as the negative externality.
b.The event of negative externality can be explained with the following figure:
As per the figure above it can be seen that X axis has presented the quantity output and Y axis has presented the price. Marginal Private Benefit (MPB) and Marginal Social Benefit (MSB) has been drawn which are negatively sloped straight line as with rise in output both MSB and MPB tends to rise as the output increases (Ludema and Wooton 2017). On the other hand, Marginal Social Cost (MSC) has been drawn as an upward sloping straight line as MSC tends to increase with the rise in output and it is same as Marginal Personal Cost (MPC). Difference between the MSB and MPB is the externality represented as the Marginal External Cost (MEC) which is $7 in monetary terms as per given information. If there is government intervention, then output will be Q1 as society will produce at socially beneficial point which is E1 and the price will be P1 but charged S1; otherwise, it output would be E0, which is private beneficial point where output will be Q0 and price will be P0.
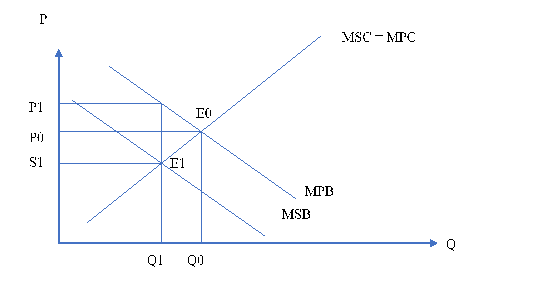
Figure 3: Negative externality of theatre
c.As per the given information, it can be seen that with the introduction of the theatre, member of the theatre will be coming and going at various hours leading to increase in the foot traffic. This increase in the foot traffic will eventually result in safety of the surrounding streets that would cost $5 per ticket. Hence, it can be stated that the externality will be positive externality as the operation of the theatre will lead to positive impact on the social benefit. As per Ludema and Wooton (2017), if an operation of the one person leads to positive impact on the society, then the externality produced is of positive type. So, in the words of xxx, the theatre would lead to positive externality on the society.
d.Underpinning the new situation, it can be seen that society achieves both positive and negative externality through the theatre. This situation can be explained through the following figure:
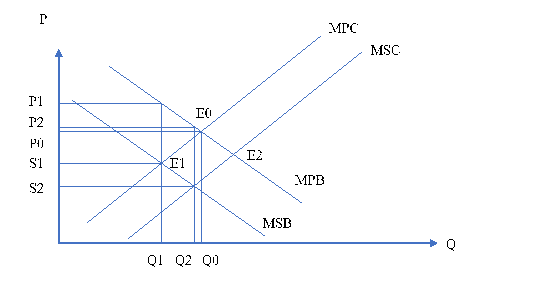
Figure 4: Impact of externality on society
As per the figure 4 like figure 1, X axis demonstrates output (Q) and Y axis demonstrates price (P). Here, MSB and MPB has been negatively sloped straight line and MPC, MSC are positively slope straight line (Nieuwland and Van 2020). There is negative externality, which has been depicted by the difference between MSB and MPB and valued at $7. On the other hand, there is positive externality leading to fall in cost causing MPC to shift to MSC and the difference between MSC and MPC is positive externality valued at $5. Now, if there is no government intervention, then initial equilibrium will take place at E0, where MPB and MPC equates. At this point, output will be Q0 and the price to the society will be P0. With the government intervention, output initially would shift to Q1 as new equilibrium would be at E1. At this point, society will face price of S1 whereas, theatre will face price of P1. Now, when the positive externality comes in, then new equilibrium comes at E2 where output become Q2 and price will be P2, which is lower than S1. Hence, in total the there will be rise in output from Q1, which is socially optimised output, however, output will be lower than personal beneficial output level. In terms of price, total negative externality will be ($7 - $5 = $2) and the price to society will be S2.
e.Society due the operation of the theatre would face a negative externality of $2. In order to allow the theatre, operate, government need to impose a tax of $2. Through the tax, government can modernise the transportation that will reduce the traffic. On the other hand, through the tax, theatre can operate and allow enhanced road safety.
Answer to question 3:
a.Average tax is defined as the total tax paid divided by income. Following the same rule, proportional, regressive and regressive tax has been calculated for three different income level and divided by total income.
Table 1: Tax in different tax system
|
Income |
Proportional tax system |
Regressive tax |
Progressive tax |
|||
|
Amount |
tax % |
Amount |
tax % |
Amount |
tax % |
|
|
$ 25,000.00 |
$ 6,250.00 |
25% |
$ 8,750.00 |
35% |
$ 3,750.00 |
15% |
|
$ 50,000.00 |
$ 12,500.00 |
25% |
$ 15,000.00 |
30% |
$ 10,000.00 |
20% |
|
$ 1,00,000.00 |
$ 25,000.00 |
25% |
$ 25,000.00 |
25% |
$ 25,000.00 |
25% |
|
Sum of income |
Sum of tax |
|||||
|
$ 43,750.00 |
$ 48,750.00 |
$ 38,750.00 |
||||
|
Average tax |
||||||
|
|
0.25 |
0.28 |
0.22 |
|||
As per the above table it can be seen that average tax rate is 25% in proportional tax system, which become 28% in regressive tax system and 22% in progressive tax system.
As per the given information people earning $25000, $50000 and $100000 comes under 25% tax in case of proportional tax system. For regressive tax system it becomes 35% and 30% and 25% respectively which become 15%, 20% and 25% for progressive tax system.
b.Marginal tax rate is calculated as the extra tax paid on additional income divided by the increased income.
Marginal tax rate = (extra tax paid / additional income) * 100
Income increased from $25000 to $50000. Hence, enhance income = $50000 - $25000 = $25000
At $50000, proportional tax is $12500 as per the given information and it is $6250 for $2500.
Hence, increase in the tax = $12500 - $6250 = $6250
Putting the values, marginal tax = ($6250/$25000) * 100 = 25%
Hence, marginal tax at proportional tax system is 25%
In case of the regressive tax system, tax rate at $25000 is $8750 and for income of $50000, tax is $15000
Increase in the tax = $15000 - $8750 = $6250
For the regressive tax system, marginal tax = ($6250/$25000) * 100 = 25%
Hence, marginal tax at regressive tax system is 25%
In case of the progressive tax system, tax rate at $25000 is $3750 and for income of $50000, tax is $10000
Increase in the tax = $10000 - $3750 = $6250
For the progressive tax system, marginal tax = ($6250/$25000) * 100 = 25%
Hence, marginal tax at progressive tax system is 25%
Thus, marginal tax rate for progressive, regressive and proportional tax system is 25%.
Answer to question 4:
a. In order to calculate the Total Cost (TC) and Average Total Cost (ATC), Total Variable Cost (TVC) and Total Fixed Cost (TFC) has been calculated. Total Cost is the sum of TVC and TFC and ATC is cost incurred based in production per unit (Q).
Hence,
TC = TVC + TFC
ATC = TC/Q
On the other hand, TVC is calculated by sum of Marginal Cost (MC) and MC at preceding level. TFC is provided that fixed at $24. Considering the formula of TVC, TFC, TC and ATC, following table has been developed:
Table 2: Calculation of TC and ATC
|
Quantity |
Marginal cost (MC) |
TVC |
TFC |
TC |
ATC |
|
1 |
5 |
5 |
24 |
29 |
29.00 |
|
2 |
12 |
17 |
24 |
41 |
20.50 |
|
3 |
17 |
34 |
24 |
58 |
19.33 |
|
4 |
22 |
56 |
24 |
80 |
20.00 |
|
5 |
27 |
83 |
24 |
107 |
21.40 |
|
6 |
32 |
115 |
24 |
139 |
23.17 |
|
7 |
37 |
152 |
24 |
176 |
25.14 |
|
8 |
42 |
194 |
24 |
218 |
27.25 |
|
9 |
47 |
241 |
24 |
265 |
29.44 |
|
10 |
52 |
293 |
24 |
317 |
31.70 |
As per the table above, Total Cost and Average Total Cost has been presented.
b.Given demand schedule:
Table 3: Quantity demand schedule
|
Price |
Quantity demanded |
|
10 |
500 |
|
12 |
480 |
|
14 |
460 |
|
16 |
440 |
|
18 |
420 |
|
20 |
400 |
|
22 |
380 |
|
24 |
360 |
|
26 |
340 |
|
28 |
320 |
|
30 |
300 |
|
32 |
280 |
|
34 |
260 |
As per the given demand schedule, at $26 price, quantity demanded is 340 unit.
As the firm is competitive in nature, hence, profit maximisation takes place where price equates with MC; thus, firm will produce till such point where MC equates with the price.
As per table 2, output is 4.81 at MC of $26. Hence, firm will either produce 4 unit of output or 5 unit of output. However, if the output is 5 unit, then MC will surpass the price. Hence, as per the profit maximisation theory of perfect competition, firms will produce 4 unit of output.
Thus, the number of firms will be: Total quantity demand/ supply by each firm
Hence, number of firms: 340/4 = 85
ATC at 4 unit of output is $20
Thus profit: Total revenue – Total cost
Profit: (4 * $26) – (4 * $20) = $104 – $80 = $24
Hence, as per the analysis, 340 units of pies will be sold in the market and each producer will make 4 pies each. In the market there is 85 producers and the profit of each producer will be $24.
c.In long run equilibrium firms earn normal profit where revenue and cost of production is equal. Thus, in the long run no new firm enters into the market and firms earn zero profit. As per the above situation, it can be seen that firms are earning supernormal profit. Hence, the situation explained above is not long run equilibrium.
d.Long run equilibrium takes place where the marginal cost is equal to the price and the long run ATC curve. Hence, in the long run firms will produce at such point where the ATC is minimum. The minimum point of ATC as per the table 1 is $19.33. Thus, the long run equilibrium price will be $19.33.
At this price, output will be as per table 2, 386.6[As per table 2, at price $20, output is 400; hence through unitary method at $19.33, output will be 386.6]
As per the outcome, number of firms = total demand / supply by each firm = 386.6 / 3 = 128.86
Profit = total revenue – total cost = (3 * 19.33) – (3* 19.33) = 0
Hence, as per the analysis it can be seen that if long run equilibrium prevails, then each producer will earn 0 profit. Market price of the pies will be $19.33 and each producer will make 3 pies. At equilibrium price, 386.6 pies will be sold and the market will have 128.86 operators.
Answer to question 5:
a.
Table 4: Marginal revenue output for adult
|
Price |
Adult ticket |
Revenue |
Marginal revenue |
|
10 |
0 |
0 |
|
|
9 |
100 |
900 |
9 |
|
8 |
200 |
1600 |
3.50 |
|
7 |
300 |
2100 |
1.67 |
|
6 |
300 |
1800 |
-1 |
|
5 |
300 |
1500 |
-1 |
|
4 |
300 |
1200 |
-1 |
|
3 |
300 |
900 |
-1 |
|
2 |
300 |
600 |
-1 |
|
1 |
300 |
300 |
-1 |
|
0 |
300 |
0 |
-1 |
As per the above table it can be seen that revenue is maximised at $7. As per the theory of profit maximisation, profit is maximised where the marginal cost (MC) equates with the marginal revenue (MR). As per the given information, marginal cost for the event is $0. Hence, at $7 MR is close to MC and revenue is maximised here. Thus, for profit maximisation, price charged would be $7 per ticket.
Table 5: Marginal revenue output for children
|
Price |
Children ticket |
Revenue |
Marginal revenue |
|
10 |
0 |
0 |
0 |
|
9 |
0 |
0 |
0 |
|
8 |
0 |
0 |
0 |
|
7 |
0 |
0 |
0 |
|
6 |
0 |
0 |
0 |
|
5 |
100 |
500 |
5 |
|
4 |
200 |
800 |
1.5 |
|
3 |
200 |
600 |
-1 |
|
2 |
200 |
400 |
-1 |
|
1 |
200 |
200 |
-1 |
|
0 |
200 |
0 |
-1 |
As per the above table it can be seen that revenue is maximised at $4. As per the theory of profit maximisation, profit is maximised where the marginal cost (MC) equates with the marginal revenue (MR). As per the given information, marginal cost for the event is $0. Hence, at $4 MR is close to MC and revenue is maximised here. Thus, for profit maximisation, price charged would be $4 per ticket.
As per the given information, as the fixed cost is $2000, thus at profit maximisation price of ticket, profit
will be: ($2100 + $800) - $2000 = $900
Hence, total profit will be $900
b.
Table 6: Total marginal revenue
|
Price |
Adults |
Children |
Total ticket sale |
Total revenue |
Marginal revenue |
|
10 |
0 |
0 |
0 |
0 |
|
|
9 |
100 |
0 |
100 |
900 |
9 |
|
8 |
200 |
0 |
200 |
1600 |
3.50 |
|
7 |
300 |
0 |
300 |
2100 |
1.67 |
|
6 |
300 |
0 |
300 |
1800 |
-1.00 |
|
5 |
300 |
100 |
400 |
2000 |
0.67 |
|
4 |
300 |
200 |
500 |
2000 |
0.00 |
|
3 |
300 |
200 |
500 |
1500 |
-1.67 |
|
2 |
300 |
200 |
500 |
1000 |
-1.67 |
|
1 |
300 |
200 |
500 |
500 |
-1.67 |
|
0 |
300 |
200 |
500 |
0 |
-1.67 |
As per the above table it can be seen that if the price discrimination is prohibited then both adult and children need to be charged at same price level. At price of $7, total revenue is maximised and marginal profit is positive. Hence, if the price discrimination is not allowed, then price charged will be $7.
If the price of ticket is set at $7, then profit will be: $2100 - $2000 = $100
Hence, total profit will be $100 if the price discrimination is not allowed.
c.If the price is set at $7, then though all adult in the Ottawa town could afford tickets, however, no children can purchase tickets. Moreover, organiser of the concert would make profit of $100 only due to prohibition of price discrimination, which otherwise would have been $900. Hence, if price discrimination is prohibited, then both the organiser and the children would be worse off. If the price discrimination is prohibited, then no one would better off as with the fall in marginal revenue with price $7, there will be rise in deadweight loss resulting fall in overall social welfare.
d.If the fixed cost become $3000 instead of $2000, then though the revenue would remain same, profit would fall largely.
As per the initial revenue of $2900, there would be a loss of $3000 - $2900 = -$100 due to rise in fixed cost from $2000 to $3000.
On the other hand, if the price discrimination is prohibited and fixed cost become $3000, then organiser would face a loss of $3000 - $2100 = -$900. Thus, there will, a fall in profit by $900 due to rise in fixed cost.
However, as the fixed cost changes, no change in social welfare can be observed leading to no change in the situation of the organiser and children and they will remain worse off.
Reference:
Condorelli, D. and Szentes, B., 2020. Surplus Bounds in Cournot Monopoly and Competition. University of Warwick, Department of Economics. https://www.condorelli.science/SBCC.pdf
Graham, E.G., 2020. An Optimal Rice Policy for Sierra Leone: Balancing Consumer and Producer Welfare. World Bank Policy Research Working Paper, 9369. https://openknowledge.worldbank.org/bitstream/handle/10986/33643/Bumps-in-the-Road-Challenges-to-E-bus-Implementation.pdf?sequence=1
Ludema, R.D. and Wooton, I., 2017. Cross-border externalities and trade liberalization: the strategic control of pollution (pp. 407-424). Economics assignment Routledge. https://ir.lib.uwo.ca/cgi/viewcontent.cgi?article=1514&context=economicsresrpt
Nieuwland, S. and Van Melik, R., 2020. Regulating Airbnb: how cities deal with perceived negative externalities of short-term rentals.
Current Issues in Tourism, 23(7), pp.811-825. https://www.tandfonline.com/doi/pdf/10.1080/13683500.2018.1504899?needAccess=true&


