
Economics Assignment On Real Life Scenarios
Question
Task:
SCENARIO ONE:
COVID-19 Outbreak: Video Conferencing Demand Rises due to Social-Distancing
Video conferencing software and video chat applications have seen a huge surge in demand as a result of the COVID-19 pandemic. In March, video conferencing apps saw a record 62 million downloads. Much of the growth is due to increasing adoption of platforms like Google Hangouts Meet, Microsoft Teams and Zoom as businesses switched to remote working to limit the spread of the virus. Zoom was the most downloaded video conferencing app globally in February and March and it continues to see a high number of downloads across the US, EU and UK.
Social-distancing has also meant that people have had to move their social lives online. There has been an increase in the numbers using video conferencing software to connect with friends and family as well as to attend virtual quizzes and exercise classes. The Houseparty app has seen massive growth from users looking to connect with friends. Downloads have been particularly high in European countries affected by lockdowns. In Spain, Houseparty downloads during the week ending March 21st, increased by 2,360 times the average weekly number for Q4 2019.
Read the above scenario and prepare a report on economics assignment answering the following questions:-
- Define demand and supply. Use the example of video conferencing software to distinguish between movements.
- Use the example of video conferencing software to distinguish between a movement along and a shift of the demand function. Use appropriate diagrams to explain your answer.
- As indicated in the above scenario, ‘video conferencing software and video chat applications have seen a huge surge in demand as a result of the COVID-19 pandemic’. By using an appropriate diagram explain this statement.
- By referring to the diagram presentation for the above question explain the main effects on the equilibrium price of video conferencing software following the COVID-19 pandemic.
- After carrying out research, identify and explain by the use of diagram/s another scenario which experienced changes in demand and consequently equilibrium price due to COVID-19 pandemic.
SCENARIO TWO:
COVID-19 Outbreak: The Malta International Airport and Air Malta
In March Malta suspended all inbound flights but the ban did not apply to ferry flights, cargo flights, humanitarian flights and repatriation flights.
"As of 21 March 2020, Malta International Airport will remain operational to facilitate the arrival and departure of cargo, humanitarian, and ferry flights until further notice," it said.
It urged people to refrain from visiting the airport unless they are travelling in order to limit crowding and allow for social distancing to be observed.
Read the above scenario and answer the following questions:-
- Identify the market structures which the Malta International Airport and Airmalta operate in.
- Justify the above answer by explaining the features of each market structure.
- Distinguish between the two market structures.
- After carrying out research depict a diagram for each market, indicating the type of profits gained in the short run.
- Compare these two market structures to perfect competition.
SCENARIO THREE:
COVID-19 Outbreak: Unemployment
“Jobless people registering for work increased by 353 last month as the first tangible impacts of COVID-19 started being felt on the economy. The number of people registering for work with Jobsplus, a government agency stood at 2,125 in March, an increase of 20% over the previous year.”
Read the above scenario and answer the following questions:-
- By using local references define the term ‘Unemployed’.
- The COVID-19 pandemic led to an increase in unemployment. Explain whether this was an increase in Equilibrium or Disequilibrium Unemployment. Justify your answer by defining these two types of unemployment.
- Present a diagram for each of the two types of unemployment.
- Explain TWO main measures implemented by government in order to reduce the type of unemployment identified in part (b) above.
SCENARIO FOUR:
COVID-19 Outbreak: The effects on GDP and Government Deficit
The pace of economic activity decelerated sharply in the first three months of this year on the back of the COVID-19 pandemic, the Central Bank of Malta said on Friday. Real gross domestic product rose by just 0.5% in annual terms, after increasing by 4.8% in the preceding quarter, according to its quarterly review. However, this annual growth in Malta fared well when compared to the euro area, where GDP contracted by 3% during the same period. Malta reported its first coronavirus case on March 7 and by the end of that month many parts of the economy had been effectively shut down. The strong decline in domestic demand as a result of weaker activity in COVID-19-hit sectors was the key cause for the slowdown in growth. At the same time, the contribution of net exports also declined but remained positive. When it comes to public finances, the government deficit widened significantly compared to the corresponding period a year earlier, as revenue fell and expenditure rose.
Read the above scenario and answer the following questions:-
- Define ‘Gross Domestic Product’.
- By referring to the expenditure method of measuring Gross Domestic Product, explain the main reasons for a decline in Malta’s economic growth rate following COVID-19.
- The above scenario refers to the real Gross Domestic Product. Distinguish this measure with the nominal Gross Domestic Product and explain why the former is a more realistic measure than the other measure.
- In the scenario it is indicated that the government deficit widened. By carrying out research fill in the following table and comment on the trends of each of the Malta government deficit and government debt over the years.
- By using the answers to question 4 above explain how this abides to the European Union Maastricht Criteria.
Answer
Scenario One of Economics Assignment
- Demand is defined in economics as the desire of the consumer to purchase and consumer goods and services backed up by their willingness to pay a price for that goods and services in a given time period. According to the law of demand, with an increase in price of commodity, the quantity demanded of the commodity will fall and vice versa, keeping all other factors constant.
Supply is defined as the willingness of the producer to make the amount of goods and services available to the consumers at a given price in a given time (Hall and Lieberman 2012). According to law of supply, as the price for commodity increases the supply of that commodity or availability of that commodity increases in the market and vice versa, keeping other things constant.
- Movement along and shift in the demand curve distinguishes from each other because each of these is effected by different factors. When there is a change in the price of the commodity, there is a movement in the demand curve from one point to another. Whereas, when the quantity demanded for commodity changes due to changes in other non-price factors then there is a shift in demand curve and price stays constant or same (Hall and Lieberman 2012). This can be seen from the example of demand for video conferencing software in the market.
From figure 1(a), it is seen that with a decrease in the price for video conferencing software in the market from P to P1, the demand for such software has increased from Q to Q1. This shows the downward movement along the demand curve for video conferencing software, which is caused by changes in demand. Similarly, with increase in price of video conferencing software then will be upward movement along the demand curve, as quantity demanded will fall, other factors remaining constant.
Figure 1(b) represents a shift in the demand curve for video conferencing software where a change in other factors leads to a change in quantity demanded, where price remaining constant. For example, with rise in covid-19 pandemic the preferences for video conferencing software increases because of social distancing need. Such a change in non-price factors such as preferences towards a certain behavior lead to an upward shift in the demand curve for video conferencing software from D to D1. With shift in demand the price remains constant and quantity demanded for video conferencing software increases from Q to Q1.
- With the increase in covid-19 pandemic it is seen that preferences of people towards video conferencing and video chat software has increased. This surge in demand is due to the non-price factor that is changing preferences or needs. This is because the pandemic has increased the need for social distancing where people has moved their social lives online. These software and application help in implementing the online social interactions effectively. Thus, with the rise in covid-19 pandemic it is seen that the demand for video conferencing software has shifted the demand curve upward from D to D1. This has changed the quantity demanded for such software and application from Q to Q1 (Hall and Lieberman 2012). Price remains constant at that point that is at P. however, as the demand for such software will increase further the price for such software will increase from P to P1 and demand for video conferencing software will reduce from Q1 to Q2. However, the overall demand for video conferencing software due to covid-19 pandemic has increased due to changes in preferences.
- From the above diagram it is seen that with the increase in the demand for video conferencing software due to covid-19 pandemic from Q to Q1 then there is an increase in the equilibrium price of video conferencing from P to P1. This means that initially the demand equals supply at price P and with increase in demand, the demand curve shifts upward from D to D1 then the quantity demanded increases from Q to Q1. However, with shift in demand upward, there is excess demand in the market of video conferencing and this shifts the price to P1 where again demand for video conferencing software equals supply (Mankiw 2020). Thus, the new equilibrium price is at P1 because at this point the new quantity demanded and supplied for video conferencing equals at Q2.
- Along with the surge in the demand for video conferencing software, the covid-19 has also caused several other scenarios in the economy and has led to changes in demand and equilibrium price consequently. Covid-19 pandemic impact also saw an increase in the demand for online shopping or e-commerce. This is because of social distancing norm where people are preferring to stay at home and purchase all their daily needs online. Such an increase in demand is caused due to changes in preferences of consumer and the situation of sudden crisis that took place in the economy and not because of changes in price. Thus, the situation of social distancing and lockdown has led to the upward shift in demand curve for e-commerce or online products. This can be seen from the diagram that as need for social distancing increased the demand for online shopping increased causing a shift in demand curve for online products from D to D1 and quantity demand increases from Q to Q1. However, this caused excess demand in the market for online products causing a supply crisis in e-commerce platforms. This led to an increase in price in price for online products from P to P1 and quantity demanded for online products reduces to Q2 (Mankiw 2020). Initially equilibrium price for online product was at P where quantity supplied equals quantity demanded. With increase in demand and subsequently the price the new equilibrium is now P1 where again quantity demanded equals quantity supplied. This shows that the equilibrium price for online products will increase due to covid-19 pandemic.
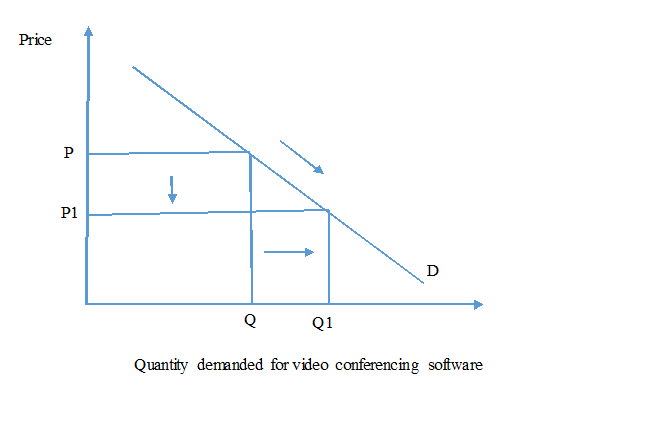
Figure 1 (a)- Movement along the demand curve for video conferencing software
Source- Author’s note
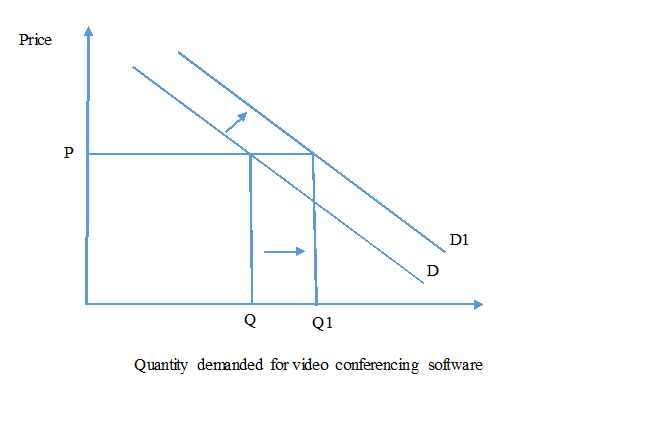
Figure 1 (b)- Shift in the demand curve for video conferencing software
Source- Author’s note
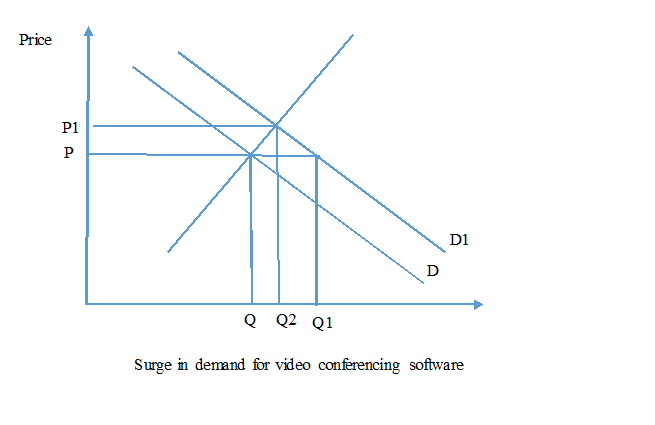
Figure 2- Surge in Demand for video conferencing software due to Covid-19
Source- Author’s note
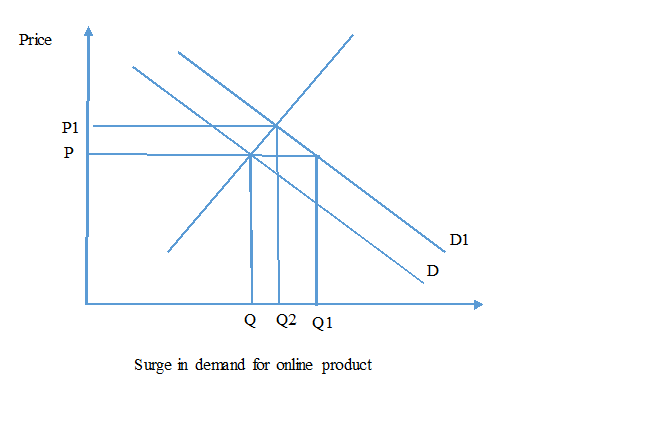
Figure 3- Surge in demand for online product due to covid-19
Source- Author’s note
Scenario Two
- Both the organization operates in two separate market structure based on the competition it faces in the market and the power it has on price. Malta International Airport operates in a monopoly market structure because it is the only airport operating presently in Malta and it takes up all the market share. On the other hand, Air Malta operates in oligopoly market structure where there are limited firms that dominate the industry.
- Monopoly is the market structure that is dominated by certain evident features such as price maker, profit maximizer, high barriers to entry, single seller and price discrimination. In relation to Malta International Airport it is seen that it is the only airport of Malta and Gozo and the major entry point to these islands. Malta is a small island and Malta International Airport is the most dominating route existing in the island. Moreover, air is the cheapest and most time efficient mode of transport to this island. Further, there is high barriers to entry in the airport market of Malta because Malta International airport takes up all the market share and it needs high investment cost and large market demand for new firms to enter. Malta being a small island lacks in both these powers thus reducing the chances of new entry in the airport market (Mankiw 2020). Moreover, being the only airport of Malta, it has pricing power to charge prices according to the demand and crowd, this is because there are no other airports in the island that serve the same area.
In relation to Air Malta it is seen that it operates in oligopoly market. The features of an oligopoly market are that there is a smaller number of large firms, firms sell identical or differentiated products and there are significant barriers to entry. The Air Malta Airline is seen to operate in oligopoly market structure, which is a kind of imperfect competition and is limited to a smaller number of dominated firms. Air Malta is seen to face competition from a smaller number of large airlines that help the visitors to travel from and to Malta such as Royal Flight, Luxair Group and Croatia Airlines. Thus, along with Air Malta only few large firms dominate the airport industry of Malta. Secondly, these airlines that Air Malta competes with are seen to sell identical service that is travelling to Malta Island and some serve differentiated service that is much luxurious travel service to the customers. Thirdly, the airlines industry of Malta is dominated by large firms and it is difficult for new entry firms to incur such large investments to compete effectively with such large airlines. This creates huge barriers to entry in the market that Air Malta operates.
- Distinguish Between Monopoly and Oligopoly Market Structure
- Profits for Monopoly Market in the short Run
From the diagram it is seen that in the short run the monopoly firm enjoy normal and supernormal profit because it charges prices above average total cost. When charges price at point P which is at the minimum point of average cost then the monopoly earns normal profit. However, when the monopoly firm charges higher price that is at P* then in short run it earns supernormal profit of area PP*. this is because price is much above average total cost and the short run profit of monopoly firm is calculated by:
(Price – ATC) * Quantity
- Both monopoly and oligopoly market structure operate in an imperfect market competition, while perfect competition market structure operate in a perfect competitive environment. All these three-market structures differ from one another on various basis.
|
Monopoly market |
Oligopoly market |
|
· Such market structure operates in the market which is dominated by only one company that sell their products and service alone to the customers. · One company has enough power to keep competitors and other companies from having influence in the industry. · High barriers to entry due to powers in technology, capital, patent and others. · Such firms are price makers due to absence of competition and charges high prices. · Monopoly firm is seen to charge different prices from different consumers and implements price discrimination policy. |
· Such market structure exists when there small group of large companies controls the market. · No one company can keep other competitors from having an influence on the industry. · High barriers to entry due to market is ruled by large firms that makes entry difficult. · Firms in this market are price takers and prices are moderate due to presence of some competition. · Firms in this market charges same price from all consumers due to presence of competition. |
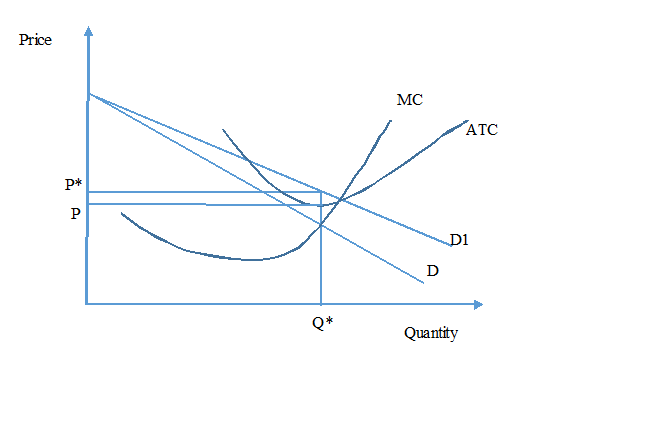
Figure 4- Profit for monopoly market in short run
Source- Author’s note
Profits of Oligopoly Market Structure in Short Run
Oligopoly face kinked demand curve where it maximizes the profit at a point where MR=MC. At this level the price is at P* and quantity is at Q* and at this point even if the MC changes there is no change in market price. This means that price is stable at this point and firm will earn maximum profit because if an oligopoly firm increases price beyond P* then they will face a change in demand due to high price elasticity and this will reduce their profit. On the other hand, if the price is reduced below P* then other firms will follow the same to avoid losing market share and demand in the reduced price is inelastic and this reduces the profit of the firm even in short run (Mankiw 2020). Thus, profit is maximum at price P* in short run.
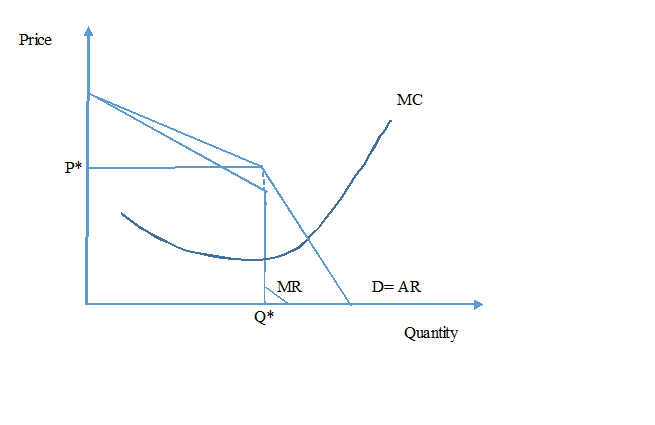
Figure 5- Profit maximizing for Oligopoly in Kinked demand curve
Source- Author’s note
Oligopoly also face collusive demand curve that is cartel where the firms in the industry together fixed the price at a level that maximizes profits of the industry. In this kind of demand curve, the firm earns supernormal profit in the short run that is the gap between P* and Pm. However, in this the oligopoly also face deadweight welfare loss because some of the welfare will be lost with increase in price to Pm.
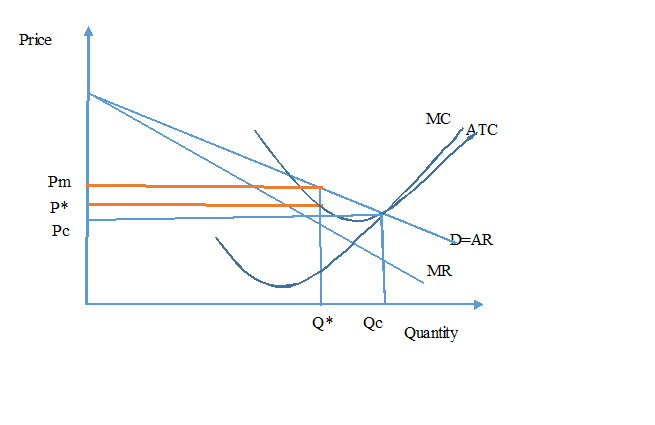
Figure 6- Profit maximizing for Oligopoly in Kinked demand curve
Source- Author’s note
|
Monopoly |
Oligopoly |
Perfect competition |
|
· Firm is a price maker in this market structure. · One firm takes up all the market share. · The monopoly maximizes profit at the quantity where MR=MC and charges higher price. · Monopoly profit= (P-AC) * Q and earns supernormal profit. |
· All firms are price takers in this market structure. · Few firms take up large market share. · Oligopoly as well collude successfully and set the price and quantity so that MR=MC to maximize profit. · Oligopoly also earns profit in short run in cartel when they have come together to set the price. |
· All firms are price takers and cannot control the prices. · All firms have relatively small share in the market. · Perfect competitive market sets price equal to marginal cost and marginal revenue (P=MR=MC). · Perfect competitive market earns zero economic profit because profit=TR=TC. |
Scenario Three
- Unemployed person is defined as the one that are without work, however, is available for work at any instance and took active steps to get a work in the last four weeks. This means that unemployed person according to OECD is the one that has the willingness to work, however, he/she is not getting job even after active efforts.
- Equilibrium unemployment is defined as a situation of unemployment which is caused when the people are either economically independent in the economy or the wages are too low and thus there is reduction in the need for being employed. Disequilibrium unemployment is defined as the situation when there is excess supply of labor in the economy compared to demand of labor. Covid-19 pandemic has led to an increase in unemployment rate due to increase in disequilibrium unemployment that is caused due to higher supply of labor in the market compared to demand. There are several causes of increase in disequilibrium unemployment such as real wage, labor supply and cyclical unemployment. One of the reasons behind the cause of unemployment during covid-19 situation is cyclical unemployment (Mankiw 2020). This is because cyclical unemployment is caused due to upturn and downturn in the economy or due to recessions and declines. Covid-19 situation has caused recession in the economy where many companies have laid out workers. This has caused increase in labor supply in the market compared to demand for labor due to excess layoff and in turn increased unemployment. Thus, unemployment due to covid-19 has been caused due to increase in disequilibrium unemployment.
- The equilibrium unemployment is caused by an increase in labor supply or excess supply of labor in the market. From the diagram below it is seen that there is an increase in aggregate labor supply in the market that the distance between Qe and Q1 is the equilibrium unemployment, which is caused by frictional or structural unemployment. This is because the unemployment is caused at the equilibrium wage rate where even at equilibrium wage there are labors that are unemployment (Mankiw 2020). This can be because there is shrinkage in the industry one is working and the skills are no longer required in a particular area. At that time employees are laid off because they are no longer needed.
- The unemployment identified above that has been caused due to covid-19 is disequilibrium unemployment. There are several measures that can be taken by government to reduce such unemployment in the economy such as monetary policy, fiscal policy, education and training and lowering minimum wage. The two measures that the government has taken to reduce disequilibrium unemployment in the economy that has been caused due to covid-19 are fiscal policy and monetary policy.
Monetary policy- the Malta government has made use of expansionary monetary policy for dealing with the disequilibrium unemployment. This is done by reduction in the interest rates in the economy by the central bank to increase the money supply in the economy and in turn increase the demand in the economy and demand for labor (Ec 2020). This will help tackle recession in the economy by boosting demand and reduce unemployment.
Fiscal policy- along with monetary policy, the European government has also adopted fiscal measures to control such disequilibrium unemployment. Government has issued increased public spending for mitigating the effects of recession and in turn reduce unemployment (Ec 2020). This step has been implemented to reduce the impact of covid-19 on labor market by increasing employment and filling the excess labor supply gap.
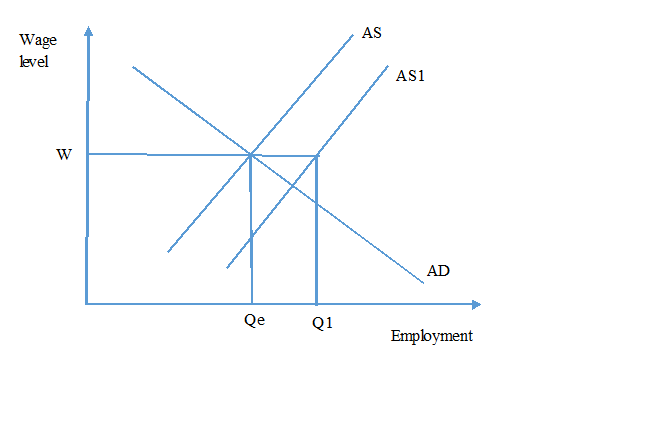
Figure 7- Equilibrium Unemployment
Source- Author’s note
Disequilibrium unemployment is caused when the wage rate moves away from the equilibrium wage rate, which leads to excess supply in the market and reduction in labor demand. From the diagram it is seen that with the wage rate increasing above equilibrium wage rate then there is excess supply of labor in the market of the gap shown by the arrow in the figure below. This is caused due to cyclical unemployment, growth in labor supply and real wage unemployment. This means that when there is recession in the economy then there is rise in unemployment because the gap between real output and potential output narrows down. Firms employ less workers because of low demand in the economy due to recession and this causes such unemployment.
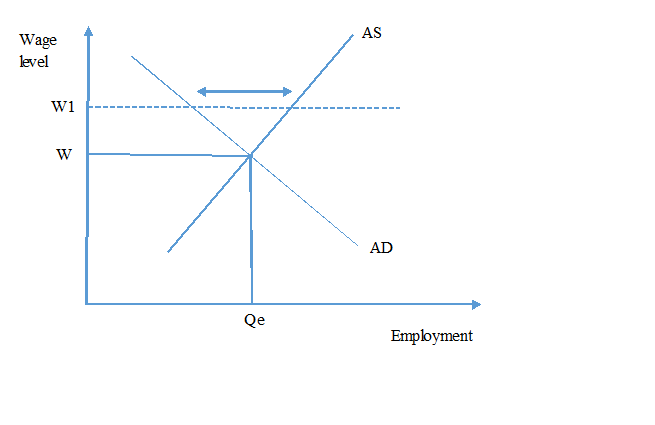
Figure 8- Disequilibrium unemployment
Source- Author’s note
Scenario Four
- Gross domestic product is defined as the value of all goods and services that is produced withing the geographic area of the nation in a particular time period such as a year. GDP includes all kinds of private and public investment, government outlays, foreign balance of trade and others.
- Expenditure method is yet most important approach that is used to measure GDP that help in measuring the output produced within the country borders irrespective to the extent of means of production used. The formula used by expenditure method for calculating gross domestic product is:
GDP= C+I+G+ (X-M)
Where,
C= consumption
I= investor spending
G= government spending
(X-M)= net export
Gross domestic product is an indicator of economic growth attained by an economy in a year. This is because it shows the standard of living of the people in the economy in a given time. From the given scenario it is seen that the consumption of the people in the economy reduced, which is seen by reduction in demand. This has led to a reduction in “C” factor in the formula. Further, it is seen that net exports in the economy has declined due to reduction in export demand from other countries. However, there was no increase in import that keep the net export positive. Thus (X-M) factor in the formula reduced in Malta with reduction in export. In addition to this, the third reason for the decline in economic growth is the increase in government spending that is “G” factor in the formula. This is because the pandemic will cause a reduction in spending of government because of widening of government deficit. Thus, in the expenditure method formula there is reduction in net export (X-M), consumption (C) and reduction in government spending (G) and these three are the reasons behind the decline in economic growth of Malta because overall GDP has reduced.
- Nominal GDP is different from real GDP to measure the overall situation of the economy. Nominal GDP measures the value of goods and services at current prices, whereas real GDP measures value of goods and services by considering adjustment to changes in inflation. Thus, when inflation is positive then real GDP is always less than nominal GDP. Nominal GDP does not make any adjustment according to the changes in prices. On this basis it is said that real gross domestic product is always a more realistic measure than nominal GDP because the former helps in analyzing national economic performance for long term by adjusting inflation, which is not measured by nominal GDP. Further, it is seen that with the help of GDP deflator the real GDP is able to measure the GDP on the basis of per quantity. However, using nominal GDP it is not possible for identifying per quantity and thus it becomes difficult to measure whether the production is expanding actually. These reasons show that real GDP is a much realistic measure than the nominal GDP because it easily helps the economists to compare GDP across year.
- The deficit of the government in Malta has widened in 2020 due to rise in covid-19 pandemic. This can be seen from the data in the below table where it shows the percentage changes in the government deficit and debt over four years that is 2016 to 2019 and its comparison with 2020.
- The European Union Maastricht Criteria states that there are certain criteria that the European Union member states have to meet in order to enter the third stage of economic and monetary union and adopt euro as currency. One of the four criteria include fiscal criteria that includes both debt criteria and deficit criteria. According to the criteria for government budget deficit it is seen that the ratio of annual deficit of the government to GDP should not exceed 3%. Thus, Malta has fulfilled this criterion except for one year that 2017 when it crossed the criteria mark of 3%. However, in rest of the years Malta has successfully abided by the deficit criteria of European Union Maastricht Criteria.
Further, in relation to criteria for government debt as a ratio of GDP, European Union Maastricht Criteria has stated that it should not exceed 60% at the end of previous fiscal year. In relation to Malta it is seen that the economy has successfully kept the debt to GRP ratio below 60% and abided by this criterion successfully. This means that the above data in the table proves that Malta has successfully abided and fulfilled the fiscal criteria of European Union Maastricht Criteria and accomplished itself to be a part of the European Union member states.
|
Year |
Malta Government Deficit as a % of GDP |
Malta Government Debt as a % of GDP |
|
2016 |
1.00% |
55.48% |
|
2017 |
3.30% |
50.28% |
|
2018 |
1.90% |
45.2% |
|
2019 |
0.50% |
42.6% |
From the data it is seen that in the past four years it is seen that the government of Malta as a percentage of GDP was facing a deficit. The deficit increased from 1% to 3.30% from 2016 to 2017, however, it reduced from 2017 to 2019. However, in 2020 the trend will be changing as the government is facing huge rise in government deficit as a percentage of GDP accounting to -9.2% (Countryeconomy 2020). this shows a huge widening in government deficit in this year due to covid-19. Further, in relation to government debt of Malta it is seen that the government has been facing reducing trend in the debt as a percentage of GDP from 2016 to 2019 (Ceicdata 2020). However, in 2020 the government debt of Malta is increasing and reached at 43.9% and this shows a widening of debt in relation to GDP. This means that over the years Malta has been performing efficiently both in terms of government deficit and government debt (Statista 2020). However, it has only widened due to covid-19 issue because of need for increased expenditure to support demand in the economy and reduced revenue.
References
Ceicdata, 2020. Malta Government Debt: % Of GDP [2000 - 2020] [Data & Charts]. [online] Ceicdata.com. Available at:
Countryeconomy, 2020. Malta Government Budget Deficit 2020. [online] countryeconomy.com. Available at:
Ec, 2020. MALTA. [online] Ec.europa.eu. Available at:
Hall, R.E. and Lieberman, M., 2012. Macroeconomics: principles and applications. Cengage Learning.
Mankiw, N.G., 2020. Brief principles of macroeconomics. Cengage Learning.
Statista, 2020. Malta - National Debt In Relation To Gross Domestic Product (GDP) 2014-2024 | Statista. [online] Statista. Available at:


