
Biology Assignment: Experiment On Effect Of Environmental Conditions On Plant Growth
Question
Task:
In this biology assignment, you will write a scientific report based on Practical and Investigation, where you measured the effect of environmental conditions on plant growth. Your report should be focused on how the variables you tested affect plant physiology, but you should also use at least some of the results from your report to discuss how climate change might affect plants. The aim of this scientific report is for you to develop your skills in THINKING and WRITING.
Answer
Introduction
As stated herein biology assignment, drought and rising carbon emissions is one of the main problems of the 21 centuries that humanity is facing today. Studying the effects of different water and CO2 emotions on plants will provide data on the development of crops (Cernusak et al., 2019). Global climate change had put a lot of pressure on the vegetation the CO2 emission is changing due to future admissions on the CO2 emissions. In many areas drought has reduced the duration of photosynthesis in plants (Zhao et al., 2020). Drought has increased the assimilation rate. On the other hand, increasing CO2 concentration have increased the photosynthetic rate and the water use efficiency. Predicting the future behaviour of plants on the land carbon sink is the most important challenge in the carbon cycle science.
The purpose of this experiment is to demonstrate the effects of environments changes on the growth of the plants. The aim of this project is to understand how the climate change has affected the plants. The objective of the research is to focus on the variable that affects the plants’ philosophy. This study is going to (1) analyse the effects of the different water stress on the physiology of the plant. (2) to explore the different CO2 stress on the physiology of the plant. This report is going to highlight the methods by which the experiment is being done. Then the result is going to be showcased in this report and lastly the interpretation of the result is shown in the conclusion part of the research.
Hypothesis
H0 - Different watering regimes had a significant effect on surface leaf area under constant CO2 conditions.
H1 - if CO2 concentration affected surface leaf area under constant watering regimes.
Materials and Methods
Triticum aestivum seeds were sown on 27th July 2021 at the University of Sydney’s Controlled Environment Facility (CEF, Camden Campus, NSW, Australia) in separate 360 ml pots filled with Osmocote Premium Potting Mix. After germination, plants were thinned to one plant per pot and grown under differing CO2 (ambient and elevated, that is 400 ppm CO2 and 1000 ppm CO2, denoted as LC and HC) and water treatments (low and high, i.e. 150 ml water pot-1 week-1 and 500 ml water pot-1 week-1, denoted as LW and HW) under constant light (800 µmol m-2 s-1) on a 12h: 12h light and dark cycle. Temperature was set to 24 °C during the day and 16 °C during the night, and pots fertilised once a week with urea. The treatments (n = 110) were LCHW, LCLW, HCHW and HCLW.
After four weeks, all leaf blades of each plant were removed by pinching them off at the base. Leaf blades were arranged flat on a white surface ensuring no blades overlapped. A photo was taken with a ruler included to provide a scale. Photos were converted to black and white (8-bit), and using the threshold function, the area of each leaf blade was calculated using ImageJ and summed to give a total surface leaf area per plant.
The average (+/- standard error) surface leaf area per plant was calculated for each treatment. Using the Analysis ToolPak in Excel, two separate two-tailed Student t-test (equal variances) were used to determine if 1) different watering regimes had a significant effect on surface leaf area under constant CO2 conditions, and 2) if CO2 concentration affected surface leaf area under constant watering regimes.
Results
In this section, the researcher primarily highlights the analysed results. The researcher principally used a student t-test with equal variances to test the research hypothesis and also used a bar chart to highlight the average leaf area under different weather conditions.
The average leaf area surface of the plants in different water regimes under ambient Co2 is visualized with the help of a bar chart. From the bar chart (Fig 1), it can be said that the average leaf area surface is higher in the case of a high-water regime than the low water regime under ambient Co2. Simply, it can be said that the average leaf area will be high when the water availability is high and Co2 is ambient. In another word, it can be said that the average leaf area is low when both water and Co2 is low.
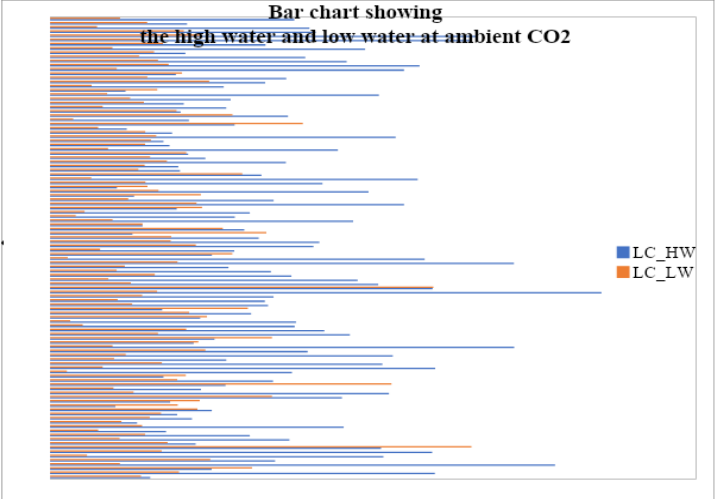
Fig 1: The effect of water on leaf area
The effect of Co2 on leaf water under a low water regime is visualised with the help of a bar chart (fig 2). From the bar chart (fig 2), it can be said that the average leaf area is higher in the case of elevated Co2 than the ambient Co2 when the water regime becomes low or constant.
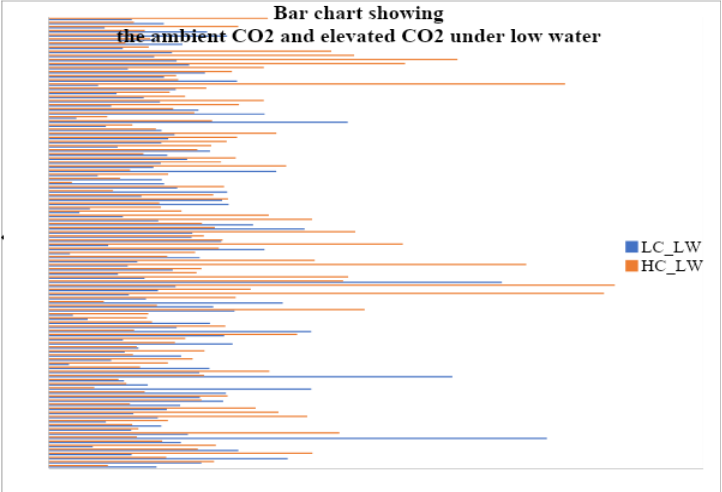
Fig 2: The effect of CO2 on leaf area
In this study, two t-tests have been performed to test the proposed hypotheses. The first hypothesis is: "Different watering regimes had a significant effect on surface leaf area under constant CO2conditions.” In this study, the t-test is used to determine is there any statistical difference exists or not in the two group means. The result of the t-test highlights that there is a significant difference among the means of the variables because the value of p is significant (t=10.01, df=218.00, p=0.00). From the analysis, it can be said that the average leaf area is different under low and high-water regimes where CO2 is low. So, the researcher accepts the research hypothesis and concludes that different water regimes had a significant effect on surface leaf area under constant CO2 conditions.
Table 1: t-test on the average leaf area under different water regimes with constant CO2
|
LC_HW |
LC_LW |
|
|
Mean |
49.66 |
24.18 |
|
Variance |
507.61 |
205.49 |
|
Observations |
110.00 |
110.00 |
|
Pooled Variance |
356.55 |
|
|
Hypothesized Mean Difference |
0.00 |
|
|
df |
218.00 |
|
|
t Stat |
10.01 |
|
|
P(T<=t) one-tail |
0.00 |
|
|
t Critical one-tail |
1.65 |
|
|
P(T<=t) two-tail |
0.00 |
|
|
t Critical two-tail |
1.97 |
The second t-test is performed to prove our second hypothesis that is “CO2 concentration affected surface leaf area under constant watering regimes.” The result highlights that there is a significant difference in the surface leaf area when CO2 concentration changed under a constant water regime (t=-3.25, df=218.00, p=0.00). Simply, it can be said that the leaf area will be decreased if the CO2 concentration becomes low and vice versa.
Table 2: t-test on the average leaf area under different water regimes with constant CO2
|
LC_LW |
HC_LW |
|
|
Mean |
24.18 |
31.48 |
|
Variance |
205.49 |
348.55 |
|
Observations |
110.00 |
110.00 |
|
Pooled Variance |
277.02 |
|
|
Hypothesized Mean Difference |
0.00 |
|
|
df |
218.00 |
|
|
t Stat |
-3.25 |
|
|
P(T<=t) one-tail |
0.00 |
|
|
t Critical one-tail |
1.65 |
|
|
P(T<=t) two-tail |
0.00 |
|
|
t Critical two-tail |
1.97 |
From the above analysis, it can be said that CO2 concentration and water both play a crucial role in plant growth.
Conclusion
In conclusion, this report has found that the different water stresses have different effects on the growth of the plant. After completion of the experiment, it is found that high water regime has increased the surface area of the leaf. The area of the leaf depends on the availability of water and CO2 level in the atmosphere. In case of the effect of CO2 on leaf area. There is a significant difference among the means of the variables because the value of p is significant. In this text case the value of t and df is 10.01, 218.00 respectively and the value of p is 0.00. in case of the effect of water regime on leaf area is the value of t and df is -3.25, 218.00 respectively and the value of p is 0.00. water and CO2 play in important role in the plant’s life.
Reference List
Zhao, W., Liu, L., Shen, Q., Yang, J., Han, X., Tian, F. and Wu, J., (2020). Effects of water stress on photosynthesis, yield, and water use efficiency in winter wheat. Water, 12(8), p.2127. https://www.mdpi.com/2073-4441/12/8/2127/pdf
Cernusak, L.A., Haverd, V., Brendel, O., Le Thiec, D., Guehl, J.M. and Cuntz, M., (2019). Robust response of terrestrial plants to rising CO2. Biology assignmentTrends in plant science, 24(7), pp.578-586. https://nespclimate.com.au/wp-content/uploads/2019/05/2.7_Cernusak_etal_2019_Accepted-version.pdf


