
Data Analytics Assignment: Case Analysis Of Netflix Dataset
Question
Task:
RATIONALE
Organisations are being compelled to collect, organise, store and disseminate data in large volumes to support decision making in order to improve business operations and achieve competitive advantage. Data management and analytics technologies have become widely accessible and affordable to businesses which are increasingly adopting these technologies to create useful insights from big data. Businesses now require managers, accountants and auditors to become expert users of business analytics tools to create valuable insights from both financial and non-financial data.
This module introduces students to the strategic role that business intelligence and analytics play in creating an enterprise-wide data set that can then be transformed into valuable insights to enhance strategic decision making. The module also provides students with an opportunity to use statistical analysis tools and data visualisation features of analytics software to deliver reports with real-time information to managers to facilitate faster decision making. The module also incorporates fundamental concepts of business performance management.
AIMS
The aim of this data analytics assignment is to provide students with the knowledge and practical skills for applying business intelligence and data analytics principles to support management decision making in a business context. The module also equips students with quantitative analysis and data visualisation skills to derive valuable insights from the data in a business context.
The module adopts 'learn by doing' approach to implement relevant features of a performance dashboard as part of the design and implementation of performance management system for a case organisation.
Answer
Introduction
As seen in the current research on data analytics assignment, technology has now beenintegrated in most business operation as there are several tools and techniques are utilized by the organization to improve their business operations. Business intelligence and analytical tools are one of the most effective solution of the companies that are trying to make data driven decision in different phase of the business. There are several online content streaming platforms that are now using business intelligence to get an overview on their product deliver, customer pattern, and business growth or subscription rate. By using different tools and techniques, interactive dashboard is developed by the professionals that gives proper insights on the business operation of the organization.
In this context, a dataset has been identified to make a dynamic dashboard for the online streaming company called Netflix. Based on the data streaming services, top ten programs in each day has bene given in the data set. More than seven thousand rows and nine columns are there in the selected data set. Netflix is currently streaming their online service in more than 190 countries over the globe (Cooper et al. 2018). Based on the local audience and geographic pattern in each country, Netflix is trying to manage and stream their programs. In the context, the company is facing some issues that have been addressed in the below points:
• The company is currently not generating enough subscribed in terms of their content streaming numbers.
• Netflix is unable to get a proper overview on their content quality and customer involvement due to the lack of business intelligence or proper analysis.
• There are different types of streaming contents like movies, web-series, stand up or others. Among these, which type of contents are much viewed by the subscribed need to be analyzed by the company.
• There is no proper business intelligence strategy of the company that could be implemented to enhance the business operation of the organization.
• A huge number of structured or unstructured data are available on Netflix.However, due to the lack of proper data analytics or business intelligence tools, Netflix is unable to understand the pattern of their most viewed contents.
On the other hand, some of the opportunities are also there that could be achieved by the Netflix with the implementation of proper.
business intelligence or analytical tools that are given below:
• Selection of online streaming services could be properly done if the company achieve a proper insight on most viewed contents.
• Number of subscribed could be enhanced by implementing proper business strategy by including offers or discounts on some
particular streaming programs (Gündüz and Asan 2022).
• A comprehensive knowledge on the target audience or most liked videos can be achieved through the data analytics.
• An interactive dashboard will be able to provide accurate data on a particular type of content.
The above points have discussed the opportunities for Netflix that could be achieved after developing an interactive dashboard through business intelligence tools.
Theoretical framework
In order to develop a proper business intelligence solution for the company, it is important to understand a theoretical framework on data analytics. At the same time, current business functions and some other aspect need to be considered by the management to implement the business intelligence solution. There are several factors that need to be handled during data analytics and business intelligence implementation on the data set of Netflix. Technological, organizational and environmental factors are the most essential sides that must be verified or checked by the company management to implement proper business intelligence solution (Khadka 2019). In terms of the above three aspects, Netflix management will be able to successfully implement the business intelligence or data analytical tool into their organizations. Based on the current scenario of the company, Netflix will be able to take data driven decisions and analytical results. However, a data management and data handling approach could also be adopted by the company to make further analysis on their current data. In this section, the three major aspects of the business intelligence and data analytics has been discussed for Netflix.
• Technological factors:In order to make a proper business intelligence solution or data analytics insights, it is important to adopt all the necessary BI tools and platform that will offer all the features and functions. Firstly, a proper data analytical team need to be setup. Different tools and technique would be utilized by the analysts to make dashboard and visualizations. In the project, Excel data analytical tools will be used to make an interactive dashboard for Netflix. At the same time, different analytical tool including Tableau, Power BI or programming based data analytical tool could be used by the analytical experts (David Santiago Rivera and Graeme Shanks 2015). Here, on the selected data set, an Excel dashboard will be developed by considering different entities into the dataset. Different filtering features and legends will be added to make the dashboard interactive. If required, a data pre-processing or cleaning will also be performed into the data set. All the necessary changes into the existing data structure will be conducted to make the dashboard informative for the organization.
• Organizational factors:The organizational aspect for the problem solution need to be considered by the company to successfully adopt the business intelligence or analytical solution. A proper team management or group work should be implemented by the project team (Schmidt, Church and Riley 2020). During the data analytical process, Netflix should provide all the legal data sources and information to get proper insights on the dataset. Company management will make an effective communication with the data analytical team. It will help to address the basic requirement for the company. Based on the client requirements, charts and graphs will be developed during the data analysis.
• Environmental factors:In the environmental aspects, a data driven decision making culture need to be developed in the organization. Based on the current online streaming platform or other competitors of Netflix, analytical team will apply a comparative analysis. This will help to make future business strategy for the company. On the other hand, a data analytical tool or business intelligence for the selected industry will be applied by the project team (Hajliet al. 2020). However, the pattern of subscribers could also be considered to make data analysis. This is an important theoretical aspect that will make the dashboard more attractive and interactive for the client. Based on the above three aspects, the entire business intelligence and data analytics will be conducted for Netflix. During the development of analytical dashboard, all the major analytical measures will be considered and then the graphs and charts will be developed.
Evidence of business intelligence and analytical tool
An interactive dashboard will give the opportunity to take data driven decision on the current business operations. Netflix will be able to get overview on their streaming platform’s most popular shows or contents. On the other hand, all the necessary change into the current business process could be implemented by the company management. However, a quantitative analysis on the available information would be executed by the analysts of the company. In the below figure, an interactive dashboard has been shown for the company that includes different measures and values of each contents.
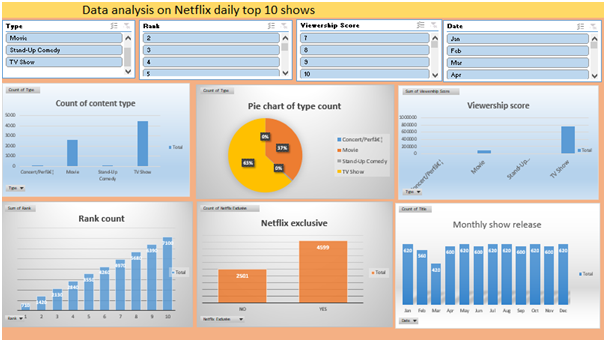
In the above figure, an interactive dashboard has been developed that shows different values and measures of released shows and contents on Netflix. A brief knowledge on shows and contents that has been released on the platform has been shown. A descriptive analysis on the selected data set has been illustrated for the company that will give values against each types of show. Based on the above dashboard, a variety of information could be extracted from the dataset for the growth of the company. Based on the popularity of the shows and programs, company management will be able take decisions on the type of streaming videos or other programs.During the development of the above dashboard a brief analysis of the selected dataset has been conducted (Evans and Evans 2020). However, most of the content types and shows have been considered during the data analysis.
Critical analysis and justification
From the above dashboard, all the necessary information for the company could be achieved by the users or by the company management. Based on the output achieved by the users, some of the critical decision could be taken by the business analysts. However, some of the charts and graphs in the dashboard has been developed during the analysis of the dataset. In this section, a proper description and justification on the developed dashboard has been given. Based on the features and functions available in the Excel analytical tool, a comprehensive analysis has been conducted for the company management. All the necessary information and charts have been included during this analysis. From the below points, an appropriate justification on the developed dashboard could be achieved by the company management:
• There are four different slicers have been added in the dashboard that will make the dashboard interactive by changing values against each columns. The slicer will make change into a particular table that is connected to the slicer.
• The color combination of the dashboard has been made attractive for the users. It gives a simple and informative interface for the company management. A background color has been added with light color.
• By using the above dashboard, users will be able to make their critical decisions on business operations and functions. Based on the information and data achieved, users will be able to manage their contents.
• Against each type of contents and shows, subscriber pattern could be achieved by the management. Based on the type and title of the show or content, popularity of the platform could be increased by the management.
• Against each month, data could be achieved by the users as the slicer has been added that gives data against each month. On the other hand, percentage value of the each type of shows have also been included for the management.
In the above points all the benefits and opportunities for the company management has been shown. With the help of above dashboard, several crucial information could be achieved by the users of the company. On the other hand, all the possible changes and modification on the data set could also be made by the analysts. However, the Netflix company will be able to get possible solution for all the issues and difficulties that are being faced by the management during data analysis. At the same time, the below points shows the possible solution for the company to address their problematic situation.
• A business growth or revenue generation could be achieved by the company of the analysis on the current data has been performed properly by the business analysts of the company (Pic 2018).
• A brief knowledge on the content ranking for a particular timeframe could also be made that will help to increase the similar type of video streaming. On the other hand, less popular shows or content could be removed or developed with attractive offers on subscription by the users.
• On the other hand, viewer score will also help the company to make recommendation to the users on the upcoming videos contents. Sometime, most loyal users would be provided with attractive offers or free subscription.
• A proper business strategy for upcoming time frame could be developed by the users to enhance the revenue generation form the online content streaming process (Qosasiet al. 2019). Most of the popular contents and videos could be streamed for a long time period.
• From the above dashboard, a descriptive analysis on the given dataset could be made by the users through the slicers and interactive dashboards. All the potential solution or information can be easily achieved by the users to make business decisions.
Conclusion and recommendation
In order to provide a proper business intelligence solution to the Netflix online video streaming company, this project has been developed by selecting a data set that show data on top ten content on the platform. Ranking of the video contents or streaming videos has been illustrated in the data set along with some other information on the data set. This report gives a brief description on the data driven decision making process by using business intelligence tool and data analytics. Netflix will be able to take crucial decision on their business process and services to enhance the overall productivity of the company. In this report, an interactive dashboard has been developed to shown that has been developed by using Excel data analytical tool. All the features and functions have been used during the analysis. Based on the project requirements, an interactive dashboard has been developed that gives brief overview on the current business operations of the company. Based on the above analysis, some major points have been achieved that are shown below:
• TV shows are the most released contents on Netflix which is about 63% of the entire distribution. Movies are streamed at about half number of the TV shows.
• In each rank, several shows are available among which tenth rank is achieved by most of the contents. At the same time, rank one is achieved by 710 number of contents.
• Standup comedies and concerts are the minimum number of contents that has been streamed into the online platform.
• On the other hand, show release rate is quite similar in each month. It seem that the March month has least number of shows streamed due to the ending of the financial year.
• However, the maximum viewership score has been achieved by the TV show viewers. It is the potential output of the contents streaming as maximum number of shows are TV shows.
Form the above points, a basic overview on the streaming strategy of Netflix has been achieved that could help the organization by introducing more TV shows and movies on the platform.In this context, it is recommended thatthe business intelligence tool could help Netflix to take crucial decision to stream proper contents on the online platform. Based on the data and information achieved form the dashboard, it will be easier to get proper insights on the business operations of the company. All the possible changes in business strategy or streaming shows would be easily made by the company if the analytical tools and intelligence solutions have been utilized by the company properly. In the present analysis of the dataset, it has been understood that the process of data analysis and visualization would give an insight on the current sales and services of a particular company.
References
Cooper Jr, M.T., Bard, D., Wallace, R., Gillaspy, S. and Deleon, S., 2018. Suicide attempt admissions from a single children's hospital before and after the introduction of Netflix series 13 Reasons Why. Journal of Adolescent Health, 63(6), pp.688-693.
David Santiago Rivera, R., and Graeme Shanks, S., 2015. A dashboard to support management of business analytics capabilities, Journal of Decision Systems, 24:1, 73-86, DOI: 10.1080/12460125.2015.994335.
Evans, J.S. and Evans, I.R., 2020. Structure analysis from powder diffraction data: rietveld refinement in excel. Journal of Chemical Education, 98(2), pp.495-505.
Gündüz, M. and Asan, K., 2022. GEOstats: an excel-based data analysis program applying basic principles of statistics for geological studies. Earth Science Informatics, 15(1), pp.705-712.
Hajli, N., Tajvidi, M., Gbadamosi, A. and Nadeem, W., 2020. Understanding market agility for new product success with big data analytics. Data analytics assignmentIndustrial Marketing Management, 86, pp.135-143.
Khadka, B., 2019. Data analysis theory and practice: Case: Python and Excel Tools.
Pic, M., 2018. Performance and home advantage in handball. Journal of Human Kinetics, 63(1), pp.61-71.
Qosasi, A., Permana, E., Muftiadi, A., Purnomo, M. and Maulina, E., 2019. Building SMEs' competitive advantage and the organizational agility of apparel retailers in Indonesia: The role of ICT as an initial trigger. GadjahMada International Journal of Business, 21(1), pp.69-90.
Schmidt, P.J., Church, K.S. and Riley, J., 2020. Clinging to Excel as a security blanket: Investigating accountants' resistance to emerging data analytics technology. Journal of Emerging Technologies in Accounting, 17(1), pp.33-39.


