
Data Analytics Assignment: Data Pre-Processing of S&P 500 Dataset
Question
Task: A data analytics project starts with collecting the data and ends with communicating the results from the data. In between, there are multiple steps that are required to be followed- data preprocessing is one of the most important steps among them. The data preprocessing step itself has multiple steps depending on the nature, type, value etc. of the data.
On the other hand, data visualisation uses visual representations to explore, make sense of, and communicate data that often includes charts, graphs, illustrations etc. Today, there is a move towards visualisation that can be observed among many big companies.
For this data analytics assignment, students are required to write 1,500 words report on a specific case study and explain the use and applications of data preprocessing and data visualisation techniques on a selected data set. Students can choose any suitable data set that is publicly available on the internet.
Students are required to select a data set and answer the following questions:
- What is the purpose of the data set, and what kind of insights can be extracted from the chosen data set
- Have you applied any data cleaning approaches (e.g., missing value handling, noisy data handling) for the chosen data set Explain in your own words what data cleaning approaches you have perform or why it was not required.
- Have you applied any data transformation techniques (normalisation, attribute creation, discretisation etc.) for the chosen data set What data transformation techniques you have performed or why it was not required to perform any transformation Explain in your own words.
- Have you applied any data reduction techniques (reduce dimension, reduce volume, and balance data) If yes, then describe the data transformation technique(s) you have followed; otherwise, explain why no transformation techniques were not required.
- Design an interactive dashboard using 3-4 charts/graphs/illustrations to represent the data.
Answer
Introduction
Data Modeling and other processing of data come under data mining. This is an essential form of process that is followed while or before conducting statistical and data analysis for business. The data analytics assignmentis based on analytics of the dataset with primary preparation and pre – processing. Every data undergoes some basic pre – processing in order to prepare it for further analysis. This assignment discusses data pre – processing such as data cleaning, data reduction, and data transformation. There is a dataset that has been taken into consideration to conduct the techniques and operation on the data under these headings to prepare data for proper and detailed analysis. The objective of this assignment is to dwell upon the practical tools and methodology that can be employed under this technical process to prepare the data for further analysis. By the end of the paper, one can attain the practical procedure to pre – process the data, remove redundancy from them, and transform it according to the requirement of analysis. The data pre – processing will be done in Microsoft Excel using functions and basic processes.
Overview of the Data
The selected dataset is of S&P 500 that stands for Standard & Poor’s 500. It is a stock market index that is listed on the stock exchange of the United States. This contains a list of 500 companies that are mostly equity indices. The dataset contains the information of all the 500 companies in the form of their market capitalization, P/E ratio, P/S ratio, P/B ratio. This index is quite influential and directive for the economy of the United States. This index is managed by S&P Dow Jones Indices. This is a joint venture that is largely owned by S&P Global. It is one of the most favored indices of leading investors and billionaires. The top ten companies from this index comprise 26.4% of the total market capitalization of the index. The dataset has 12 columns and 505 rows. The data is representing the financial details of the company on the stock exchange. The values given in the data are quite distorted and not in an arranged manner. This dataset will be used to display the techniques of data pre – processing and with the application of tools, the dataset will become more representable and usable for further analysis (Kajáti, Miškuf&Papcun, 2017).
Data Preprocessing
Data Cleaning
In data modeling, data cleaning is the first step as it involves analyzing data for anything that is unwanted or possible to reduce the burden. The notion of data cleaning is to remove unwanted elements or content from the dataset. Sometimes, it is used for the process of handling noisy data or handling missing values. The process of data handling involves carrying out tasks that could make the data more interpretable and sensible. The data cleaning is a very important process to reduce some extra and unnecessary efforts that can be used in the dataset. It is better to prepare the data before analyzing. It gives benefits in terms of segmented and diversified analysis. The cleaned data makes things a bit easy and its representation standard as well as common, thus the outliers get reduced or completely eradicated (Khadka, 2019).
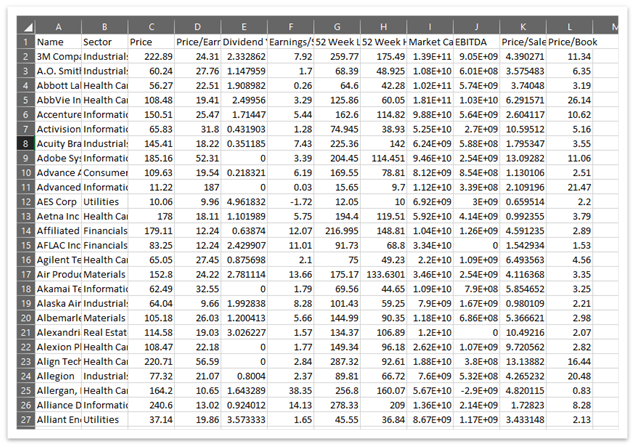
Fig. Uncleaned Data
One can comprehend from the data that columns are mostly hidden and content are not displayed completely. There is nothing common about using decimals in dividend yield, P/S. The dollar sign is missing from the columns where prices are mentioned or monetary value is depicted. The dividend yield must be represented in the form of a percentage. All these objectives must be achieved to represent data better and reduce unwanted digits and arrange them in a systematic manner.
For cleaning this data, the following steps will be needed to take –
1. Selected all the columns and click in between any two - column head. This will adjust the column width of every column through auto mode.
2. Select the market cap column and add the commas to the number given.
Follow step 2 for the EBITDA column too.
3. Select all the data in the Price column and set the formatting for the dollar sign.
Follow step 3 for the Market Cap column too.
4. Reduce the decimals of a column – ‘Price/Sales’ up to three significant digits.
5. Convert the Dividend Yield into percentage and shift decimal two places to the right.
6. Delete the rows whose EBITDA is zero
After following the above steps, the dataset will look like the following –
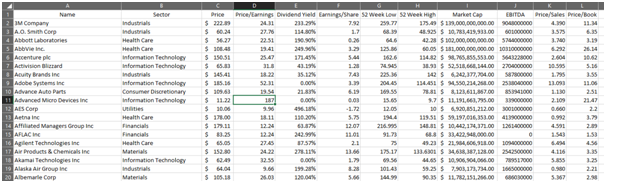
The significance of cleaning is to remove redundancy or any kind of noise from the data. The notion of noise refers to ambiguous data or unwanted data. Since this dataset didn’t contain much concern, it was easy to clean it (Martino, 2019).
Further, this data will be transformed to better understand and comprehend better analytics and conclusive results.
Data Transformation
The element of transformation is to make the data more presentable and understandable. The purpose of data transformation is to represent a particular set of data in some categorical form or on the common ground. It also helps in establishing separate perception for the same data.
Normalization
The technique of normalization is done to organize data by creating a table and establishing some kind of relationship in them. This technique allows to remove redundancy and allowing inconsistent dependency.
The process of normalization is done by the following formula –
Normalized Value=(x- x )/s
where,
x = data value
x =mean of the dataset
s = Standard Deviation
In our dataset, we are normalizing market cap.
We will conduct the normalization by taking out mean of the market cap column and in the different cell, we will calculate standard deviation of the same column. Using both the values and excel function we will calculate normalized value of each market cap value. Excel function is =STANDARDIZE(market cap value, mean, standard deviation)
Exponential Smoothing
The purpose of exponential smoothing to smooth data for making it presentable. It employs damping factor which smoothes the data between 0 to 1.
Data Reduction
The purpose of the data reduction is to create small chunks from the whole dataset based on some distinctive background. The given dataset contains sectors of industries, so there is the possibility that the whole dataset can be divided into sectors of industries. Thus, the analysis of the whole dataset can be done in accordance with the sectors. The purpose of the data reduction is to provide cornered and narrowed approach for the data analysis so that specific attention could be given to a particular set of data. The comprehensive data gives more information but the reduced data gives more accurate information (Alasadi& Bhaya,2017).
On the other hand, data can be reduced by removing some unnecessary columns such as EBITDA, 52 weeks high, 52 weeks low, P/S ratio, market cap. This will be regarded as conditional data reduction. The custom conditions decided for reduction is based on the required analysis of the particular company for their performance. There are many aspects of reducing data such as reducing volume, reducing the dimension, deleting irrelevant rows, columns. Categorizing the whole data at some segmentation and representing each of them separately.
Dashboard Design
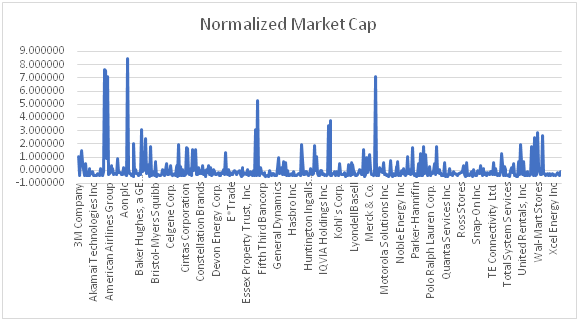
Normalized Market Cap
Using the normalization technique for transforming dataset, following graph is obtained. The basic fundamental of normalizing a data is to make it more readable and comprehendible. The original value of the market cap was quite large to comprehend, that’s why normalized value congested the data for a confined space (Srivastava, Srivastava&Garg, 2019).
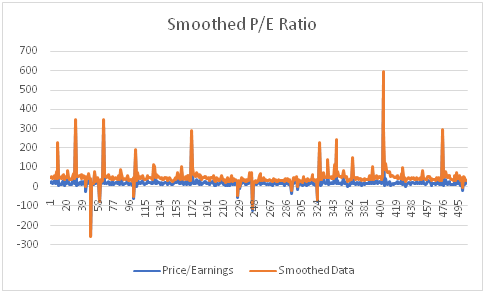
Exponential Smoothing of P/E Ratio
The exponential smoothing of P/E ratio is a reduced and degenerated form so that outliers and non – important portion can be left out and an overview understanding is visible (Ramírez-Gallego, et al. 2017).
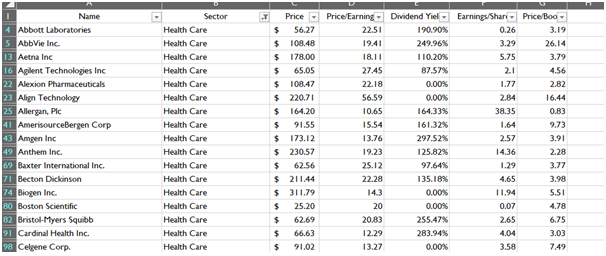
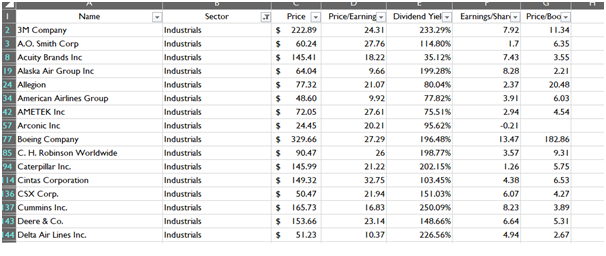
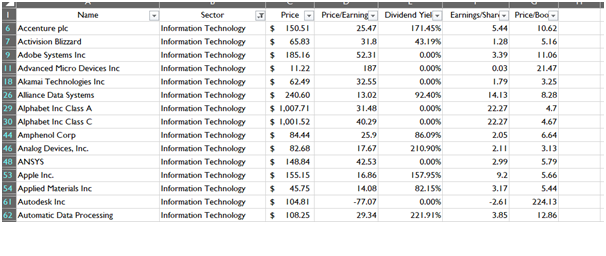
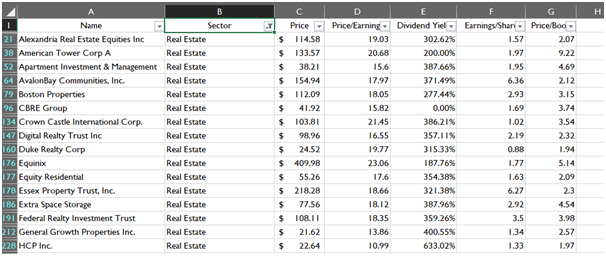
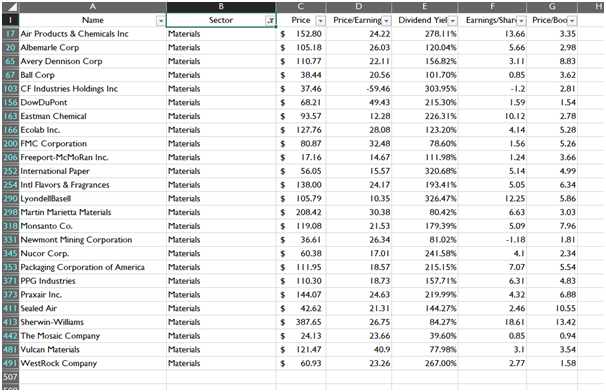
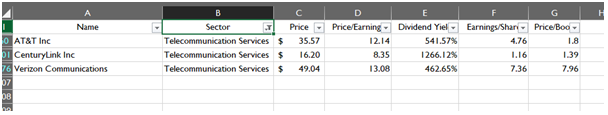
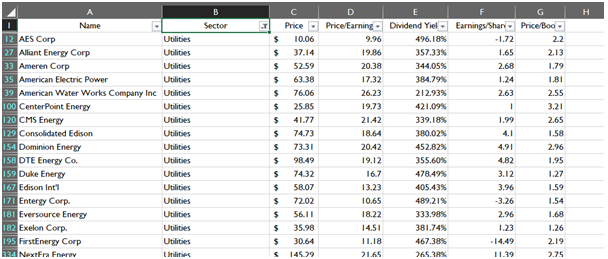
Data Reduction (Sector wise)
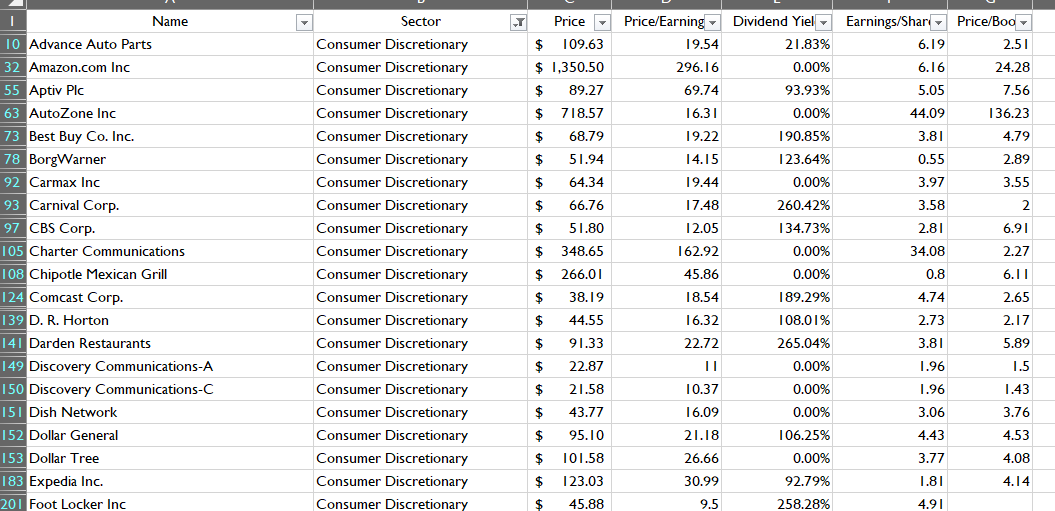
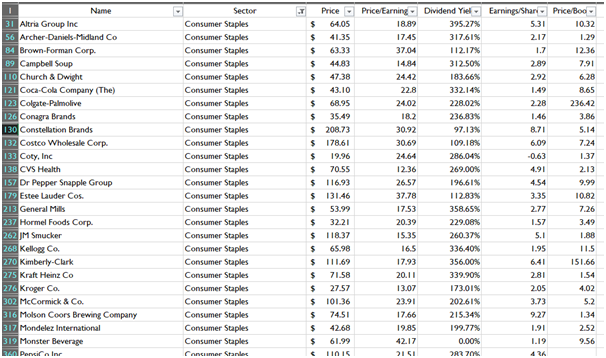
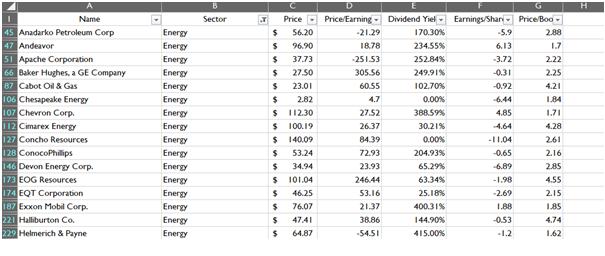
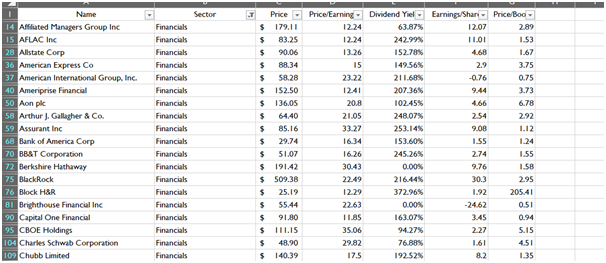
The data reduction employed sector wise depicts the preparation of the data for each sectoral analysis. Each reduced sector will give factual information for the particular sector and their specific companies. The images of reduced dataset given below is based on conditional data reduction in the previous section.
Consumer Discretionary
Consumer Staples
Energy
Financials
Healthcare
Industrials
Information Technology
Real Estate
Materials
Telecommunication Services
Utilities
Conclusion
The assignment was based on business statistical analysis using Microsoft Excel. The purpose of the assignment was to practice and implement data pre – processing to clean and prepare the data for further analysis. The paper has employed some of the standard techniques in each of the sections and presented the theoretical background of the implemented procedure. The different techniques of data pre - processing are used to clean, transform, and reduce the data. There are distinctive objectives to use these techniques on the data set. Each data in a dataset represents a feature and the main proposition regarding that feature is the characteristic definition of the data. The paper has discussed and demonstrated the application of data pre - processing techniques through the after results of each procedure. Data modeling is a very exhaustive and lengthy process and this paper contains the techniques that are the foundational elements of the process.
References
Alasadi, S. A., &Bhaya, W. S. (2017). Review of data preprocessing techniques in data mining. Journal of Engineering and Applied Sciences, 12(16), 4102-4107.https://d1wqtxts1xzle7.cloudfront.net/54509277/4102-4107-with-cover-page-v2.pdfExpires=1629458239&Signature=UZMod0owTcs-a50wGaN6SlBxt~Po1wKeO7csntSZ6DYhkDYH2r~804skH9hP4eDjLA85yQfblhihQozj2-xBUDi1Ug6msnJB1ppWCV9zVf-PCDmnxN3MedNGOD0CFSIheY5kE4ex-fEEQOVrocrULXAuddYgXMuI3zj7Rxil8d3yL9TY0maHXYYiEX97oQgBtbpV
F80ZcxDOIsw3tSiJYSmijd
w4fl375pbMBDuZxTKdKkkW4ZAaLaoHPS6r9KkX4VsDO2p43lXG0L7tsuC4JHIL3dDkSMMSd3P1Ob9uvVSR-zraWvsPhXk4-7EpWUoskDXm~UAA4Y2uJbyVmLIIiQ__&Key-Pair-Id=APKAJLOHF5GGSLRBV4ZA
Kajáti, E., Miškuf, M., &Papcun, P. (2017, January). Advanced analysis of manufacturing data in Excel and its Add-ins. In 2017 IEEE 15th International Symposium on Applied Machine Intelligence and Informatics (SAMI) (pp. 000491-000496). IEEE.https://ieeexplore.ieee.org/abstract/document/7880359
Khadka, B., (2019). Data analysis theory and practice: Case: Python and Excel Tools.https://www.theseus.fi/handle/10024/335764
Martino, J. C. R. (2019). Hands-On Machine Learning with Microsoft Excel 2019: Build complete data analysis flows, from data collection to visualization.Data analytics assignmentPackt Publishing Ltd.https://books.google.co.in/bookshl=en&lr=&id=YTCWDwAAQBAJ&oi=fnd&pg=PP1&dq=data+preprocessing+in+excel&ots=-EVYC8hv0I&sig=ygoA25jHvwgnw3KnC4cbKfpQLHI&redir_esc=y#v=onepage&q=data%20preprocessing%20in%20excel&f=false
Ramírez-Gallego, S., Krawczyk, B., García, S., Woniak, M., & Herrera, F. (2017). A survey on data preprocessing for data stream mining: Current status and future directions. Neurocomputing, 239, 39-57.https://www.sciencedirect.com/science/article/abs/pii/S0925231217302631
Srivastava, M., Srivastava, A. K., &Garg, R. (2019, February). Data preprocessing techniques in web usage mining: A literature review. In Proceedings of International Conference on Sustainable Computing in Science, Technology and Management (SUSCOM), Amity University Rajasthan, Jaipur-India.https://papers.ssrn.com/sol3/papers.cfmabstract_id=3352357


