
Corporate Finance Assignment: Financial Analysis For Companies From Year 2018 To 2020
Question
Task:
Corporate Finance Assignment Questions:
• Please calculate the ROS and ROCE for the companies on the left for the past three years (2018-2020)
• Determine the simplified version of the Market Value Add for these companies
• Determine the Total Shareholder Return (TSR) for the last three years for the same companies and calculate the value for the entire corporation and per stock
• Link the development of the results (ROS, ROCE, MVA, TSR) to the respective stock price development – are there any correlations
• Please identify an index which would have outperformed all the stocks analysed so far with regards to creation of shareholder value
• Compare and discuss the results
• Which method do you think is most suitable to measure “Shareholder Value”
Answer
Introduction
The organisation, Oracle Corporation, Fed-ex, PEPSICO, SAB Miller and XEROX are selected for processing financial analysis respectively for each of the companies for the past three years that is the year from 2018 to 2020 significantly in this report. Here in this report, a simplified version of the market value for each of the selected companies will be appropriately evaluated based on their annual financial statement for the past three years effectively. Furthermore, this report will determine the total shareholder return of each of the five companies for the past three years and, along with that calculation of the value for each of the five companies for Entire Corporation and per stock significantly. As a result of this process, evaluation market share and the market position of all these companies such as oracle, Fed Ex, SAB Miller, Xerox and PEPSICO will be analysed in relevant with their increased margin the operational process effectively.
After determining the Liabilities and the equity by cutting down non-interest-bearing liabilities for each of the companies and their shareholder values, identification of links ad correlations of each of the companies designated values will be determined effectively. With respect to stock price development for each of the companies in accordance with their shareholder returns and ROCE along with ROS, any relationship will be identified in this report effectively. The identification of an index which world have outperformed all the stocks for each of the companies with regards to the development of the shareholder value of each of the companies will be processed in this report. All the results that will be gathered from this calculation and financial analysis for each of the five companies will be discussed significantly, and in order to distinguish the most attractive one, a comparison process also going to be processed in this report. After the complete financial analysis, justification of the entire measurement process of stakeholder value and the purpose for selecting this measurement will also be provided in this report effectively.
ROS and ROCE (EBIT/Liabilities +Equity - Non Interest-Bearing Liabilities)
|
|
May 31, 2020 |
May 31, 2019 |
May 31, 2018 |
|
Return on Sales |
|||
|
Gross profit margin |
60.66% |
61.64% |
62.63% |
|
Operating profit margin |
3.49% |
6.41% |
7.44% |
|
Net profit margin |
1.86% |
0.77% |
6.99% |
|
Return on Investment |
|||
|
Return on equity (ROE) |
7.03% |
3.04% |
23.55% |
|
Return on assets (ROA) |
1.75% |
0.99% |
8.74% |
Return on Capital Employed = Earnings Before Interest and Tax (EBIT) ÷ (Total Assets - Current Liabilities)
0.07 = US$4.8b = (US$83b - US$14b)
ROCE = 7.0%
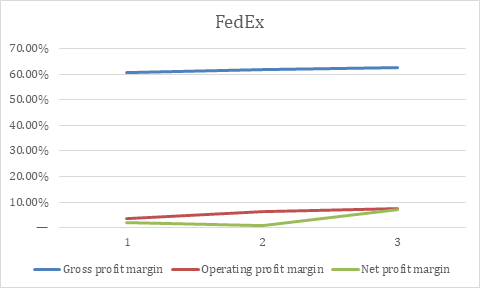
The evaluation of the current ROCE of FedEx company indicates that the company has decreased the ROCE from 15% to 7.0% in the last five years which confirms that the company is experiencing lower returns while focusing on the short-term however has a potential to reinstate all the necessary components that would allow it to visualise growth while having higher sales in coming future. The 7.0% ROCE of FedEx implies to the low return on by the company in short-term goals. Therefore, the company needs to work on its existing procedure and launch better strategies.
Pepsico
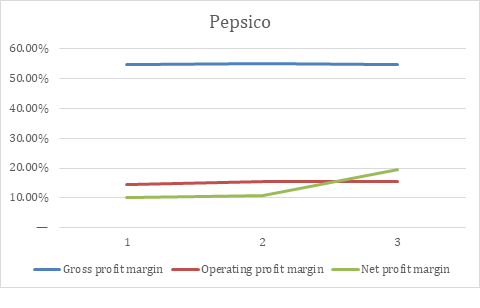
The evaluation of the ROS for PepsiCo implies that the company currently has less as compared to FedEx with 54.82% in 2020. The gross margin for PepsiCo increased from 2018 to 2019 from 54.56% to 55.13%. However, it decreases to 54.82% in 2020. The below table gives an elaboration of the ROS along with a piece of brief information about the return on equity and returns on assets (Pepsico, 2021).
|
|
26/12/20 |
28/12/19 |
29/12/18 |
|
Return on Sales |
|||
|
Gross profit margin |
54.82% |
55.13% |
54.56% |
|
Operating profit margin |
14.32% |
15.32% |
15.64% |
|
Net profit margin |
10.12% |
10.89% |
19.35% |
|
Return on Investment |
|||
|
Return on equity (ROE) |
52.92% |
49.47% |
86.20% |
|
Return on assets (ROA) |
7.66% |
9.31% |
16.12% |
Return on Capital Employed = Earnings Before Interest and Tax (EBIT) ÷ (Total,Assets - Current Liabilities)
US$11b = (US$74b - US$20b)
= 0.20
ROCE = 20%
The evaluation confirms that the current ROCE of PepsiCo company is 20% which is more compared to the ROCE of FedEx for the last five years where the company experienced an average ROCE of 8.6% in the last five years. Therefore, the company has current liabilities such as the invoice for the supplier payment and all the tax bills along with short-term debt. The liabilities on the assets for PepsiCo is evident which confirms that the low current liabilities have no direct implication for boosting the ROCE. Hey even though the ROCE of PepsiCo is quite strong which confirms that it has certain fantastic investments which allow it to control the financial perception.
Oracle
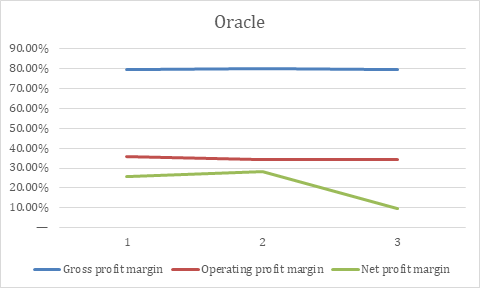
The evaluation of the current business prospects of Oracle company implies that the company has been effective in controlling the loss created over the years. It had crossed a profit margin of 79.71% in 2018 which increased to 79.76% in 2019 which further dropped to 79.68% in 2020. The further evaluation indicates that the net profit margin for 2018 increased widely till 2019 which dropped in 2020. Therefore it confirms that the company is in a critical position that needs to be evaluated by the current management team (Oracle, 2021).
|
|
31 May 2020 |
31 May 2019 |
31 May 2018 |
|
Return on Sales |
|||
|
Gross profit margin |
79.68% |
79.76% |
79.71% |
|
Operating profit margin |
35.57% |
34.26% |
34.34% |
|
Net profit margin |
25.94% |
28.05% |
9.60% |
|
Return on Investment |
|||
|
Return on equity (ROE) |
83.94% |
50.87% |
8.37% |
|
Return on assets (ROA) |
8.78% |
10.20% |
2.79% |
Return on Capital Employed = Earnings Before Interest and Tax (EBIT) ÷ (Total,Assets - Current Liabilities)
US$14b ÷ (US$118b – US$20b)
= 0.15
ROCE= 15%
Oracle has experienced proper progress in terms of ROCE as the average value is 9.4% for the last five years which increased to 15%. The increase of the ROCE confirms that the current liabilities of the company involves the invoices and the short term bills which can unfairly boost the ROCE value. The overall analysis confirms that ROCE currently has decent financial perceptions which confirm the valuation of the company.
Xerox
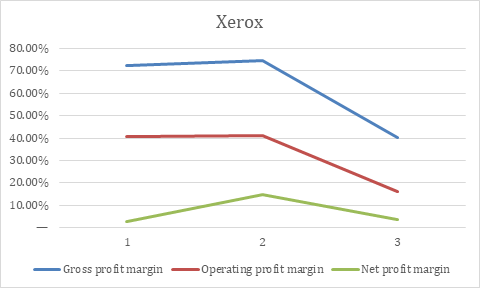
The evaluation of the financial status of Xerox company confirms that the company experienced a wide jump in terms of gross profit margin from 2018 to 2019. The company increased the profit margin double and currently has 72.34% gross profit margin in 2020 (Xerox, 2021). The comparison confirms that the company is in a critical position where the net profit margin is quite low compare to the operating profit margin.
|
|
31 May 2020 |
31 May 2019 |
31 May 2018 |
|
Return on Sales |
|||
|
Gross profit margin |
72.34% |
74.88% |
40.42% |
|
Operating profit margin |
40.56% |
40.98% |
16.10% |
|
Net profit margin |
2.73% |
14.92% |
3.74% |
|
Return on Investment |
|||
|
Return on equity (ROE) |
3.43% |
24.33% |
7.42% |
|
Return on assets (ROA) |
1.51% |
10.50% |
2.94% |
Return on Capital Employed = Earnings Before Interest and Tax (EBIT) ÷ (Total,Assets - Current Liabilities)
US814 ÷ (US$14,741-US$2479)
= 0.06
ROCE = 6%
The above calculation indicates that the ROCE for Xerox company is 6%. The above ROCE of Xerox company confirms that the company experiences and extremely low returns in exchange of the short-term goals that needs to be rectified to ensure that all the current perspective of the company are evaluated equally while looking into the specific business areas that can be considered for further evaluation. The company has provision to implement strategies that would allow it to maximise the return on from short-term goal while ensuring that the company is able to maintain the satisfaction of the customers while holding the position in the market.
Sab miller
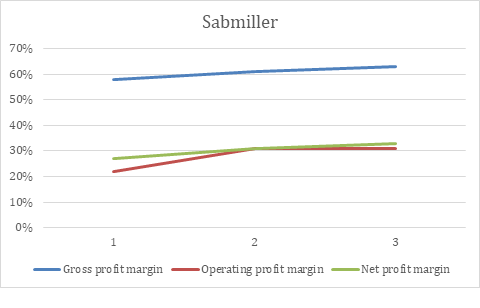
The evaluation of return on sales on SABMiller indicates that the gross profit margin of the company dropped gradually since 2018. The operating profit margin of the company has also dropped from 2019 where the company is currently experiencing critical situation and requires better strategies to overcome the drop. The net profit margin has also increased but compare to the operating profit margin it has been recovered somewhat while having 27% of net profit margin (SABMiller, 2021). Therefore, the elaborated evaluation confirms that the business prospects of SABMiller need to be enhanced
|
. |
26/12/20 |
28/12/19 |
29/12/18 |
|
Return on Sales |
|||
|
Gross profit margin |
58% |
61% |
63% |
|
Operating profit margin |
22.00% |
31.00% |
31.00% |
|
Net profit margin |
27.00% |
31.00% |
33.00% |
|
Return on Investment |
|||
|
Return on equity (ROE) |
|||
|
Return on assets (ROA) |
Return on Capital Employed = Earnings Before Interest and Tax (EBIT) ÷ (Total,Assets - Current Liabilities)
US$6172m÷ (US$226410m-US$32352m)
= 0.03
ROCE= 3%
Above calculation confirms that the ROCE for SABMiller is 3% which implies that the company experiences minimum return from short-term objectives. It can also be expressed that the company is not in a position to recover their loss as it is unable to recognise the market trend while generating business provisions. The calculation of the ROCE for SABMiller confirmed the focus on the company where it is unable to maintain a balance between the operating margin where the calculation of ROE and the ROA has not been possible based on the limited information about the company. Therefore, the limited information gives an elaborate it perception of the entire business.
Simplified Version of the Market Value of the Chosen Organisations
The performance of any corporate organisation within the market environment can be analysed through various internal and external factors of its business. In this regard, it can be pretty essential to explore a few factors that can impact the overall proficiency of the company in the macro-environment. As per the evaluation of Utami and Darmawan (2019), the analysis of the market value added (MVA) will be pretty essential for the purpose of corporate finance and accounting control. In this regard, it is rather necessary to analyse the market value added (MVA) of any corporate form according to the real-time market data of the brand. The value of the stock price of the firm acts as a performance measurement tool for the analysis of the financial performance of the firm. The study of the market value added (MVA) mainly analyses the market value of the business and the overall invested cost of capital (Sahara, 2018). The analysis of the market value added (MVA) can be done in the following process. The value of the market value added (MVA) is quite essential for the investors of the firm as it denotes the ability of the business to generate returns for the investors. Naturally, dynamic organisations are able to maintain a robust level of MVA in their business process. In this particular analysis, the analysis of the MVA value of the five chosen firms, i.e. Oracle, Xerox, PepsiCo, SABMiller and FedEx, will be evaluated.
MVA = V - K; in this process, the market value is denoted as MVA, V is the market value of the equity and debt that the firm has, and K is the capital invested in the business process of the firm.
In this regard, the amount of MVA that the firm is able to generate essentially highlights the market performance of its business for any particular period. If the MVA is higher than the cumulative investment that the firm has been able to make, it denotes the proficiency of its business (Ali, 2018). On the other hand, if it is observed that the amount of MVA that the business is generating is way less than the net investment amount of it, then it highlights the incompetent business situation of the organisation.
The analysis of the derived market value of the chosen organisations will be evaluated in the following section. In this process, the datasets of the accounting process and the financial performance of the five companies have been included.
Simplified Version of the Market Value Added of Oracle
The results obtained from the financial and accounting details of the chosen organisations provide a clear view of the market performance of Oracle. The following section will mainly concentrate on the evaluation of the market value added (MVA) of Oracle.
It can be observed that the market value added (MVA) of the company in FY18 had been $ 121,158 million. In FY 19, the amount of market value added (MVA) for the company was $ 159, 053 (Johan, 2018). The performance of Oracle has improved in the next year as the firm fetched an amount of MVA of $ 159,104 million.
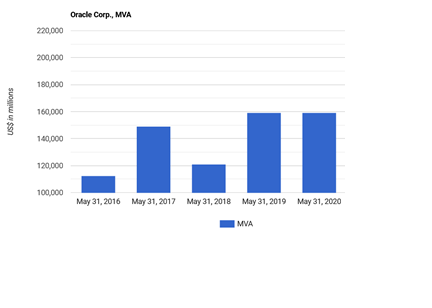
Figure 1: The evaluation of the trends of MVA, Oracle Corp.
(Source: Created by the Author)
The above-presented figure mainly evaluates the MVA amount that Oracle has been able to generate in its business process. The invested capital of the company has been $ 72,343 million, $ 72,089 million and $ 87,978 million in the period of FY 18, FY 19 and FY 20. It can be safely opined that the organisation has been able to gather MVA that is far higher than its cumulative investment, which prices the business proficiency of Oracle.
Simplified Version of the Market Value Added of Xerox
The evaluation of the market value added (MVA) of Xerox would be pretty essential for the purpose of evaluating the accounting portfolio of the company. The business issues of Xerox have been associated mainly with the competitive problems of the brand. As a result of the presence of various cheaper versions of the products of the firm, the organisation has not been able to implement market penetration activities in the domestic and international markets. It can be observed that the market value added (MVA) of the company in FY18 had been $ 41,589 million (Utami and Darmawan, 2019). In FY 19, the amount of market value added (MVA) for the company was $ 52,498. The performance of Xerox has degraded in the next year as the firm fetched an amount of MVA of $ 53,449 million.
It can be observed that the market value added (MVA) of the company in FY18 had been $ 37,650 million. In FY 19, the amount of market value added (MVA) for the company was $ 51,645. The performance of FedEx has degraded in the next year as the firm fetched an amount of MVA of $ 50,480 million.
The amount of investment that Xerox has put in the business process of the firm has not been less than the amount of MVA of the company. Truth be told, the MVA amount and the investment amount of the organisation has been similar for all the years, i.e. FY18, FY19 and FY20. The analysis of the marketing activity of the brand has been quite critical for the amount of MVA that it has generated.
Simplified Version of the Market Value Added of Pepsico
The following section will mainly concentrate on the evaluation of the market value added (MVA) of Pepsico. It can be observed that the market value added (MVA) of the company in FY18 had been $ 135,833 million. In FY 19, the amount of market value added (MVA) for the company was $ 179,556 million. The performance of Oracle has degraded in the next year as the firm fetched an amount of MVA of $ 166,565 million.
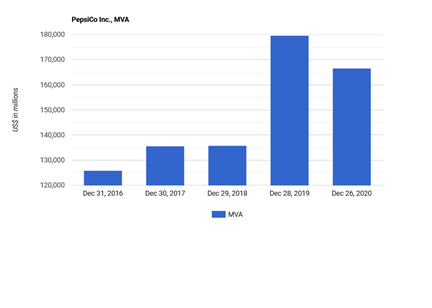
Figure 2: The evaluation of the trends of MVA, PepsiCo
(Source: Created by the Author)
For the purpose of analysing the market performance of Pepsico in the period of FY18, FY19 and FY20, the comparison of the MVA values of the company must be diagnosed with the values of the cumulative investments of the firm. The cumulative investment values of Pepsico will be $ 135,833 million, $ 179,556 million and $ 166,565 million, respectively, for the period of FY18, FY19 and FY20. It can be clearly observed that the organisation has been able to surpass the amount of investment in a proficient manner (Akgun, Samiloglu, and Oztop, 2018). It has ensured the overall equity factors and the amount of shareholder return of Pepsico. Apart from that, the amount of growth that Pepsico has been able to implement in its business process in FY 19 ($ 179,556 million) was relatively higher than the amount of its MVA in 2018 ($ 135,833 million). It has been a result of the robust investment and accounting strategies of the organisation and the growth of the market of Peosico in its global business process.
Simplified Version of the Market Value Added of SABMiller
The following section will mainly concentrate on the evaluation of the market value added (MVA) of SABMiller. The performance of SABMiller has been quite critical as the organisation has been bought by AB InBev. The MVA of SABMiller was $ 110,566 million in FY18. However, the amount depleted further in FY 19 as the MVA for this year was $ 102,458 million. Lastly, the amount of MVA that was observed in FY 20 was $ 95,456 million.
After the presentation of the market value added (MVA) of the firm, the analysis of the total amount of investment for the organisation will also be quite essential. As per the annual report of the organisation, the total investment of the company was $ 120,554 million, $ 114,445 million and 108,887 million in the period of FY 18, FY 19 and FY 20.
In this relation, it can be opined that the depletion of the MVA value of the organisation has been quite critical in terms of the hibernation of the market value added (MVA) of the company. SABMiller has not been quite proficient in terms of generating stakeholder returns in this particular period. It has also been reflected in the equity generation process of the company.
Simplified Version of the Market Value Added of FedEx
The following section will mainly concentrate on the evaluation of the market value added (MVA) of FedEx. It has been observed from the ROE and ROCE analysis that the financial performance of the brand went through turmoil in the period of FY18-FY20. It also denotes that the organisation did not make any significant move items of the betterment of the equity values and the shareholder returns (Syelfia and Afridayani, 2021). It can be observed that the market value added (MVA) of the company in FY18 had been $ 39,500 million (Carini et al., 2017). In FY 19, the amount of market value added (MVA) for the company was $ 24,340. The performance of FedEx has degraded in the next year as the firm fetched an amount of MVA of $ 22,845 million.
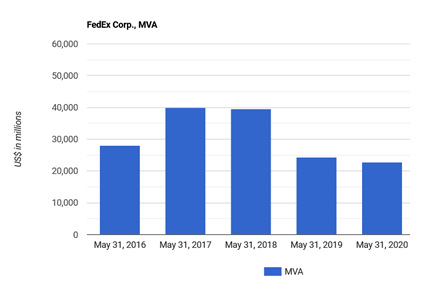
Figure 3: The evaluation of the trends of MVA, FedEx.
(Source: Created by the Author)
The above section represents the performance of the physical indicators of FedEx in the period of 2018-2020. In this regard, it can be observed that the amount of invested capital of the firm was $ 53,524 million, $ 57,553 million and $ 64,29 million, respectively, for the period of FY18, FY19 and FY20. In this regard, it can be opined that the performance of FedEx was not very robust in this period. The organisation failed to keep its MVA more than the cumulative invested amount of its business. In this process, it can be evaluated that the organisation has been unable to capture a high degree of market value and returns for the stakeholders. Along with that, the overall performance of the brand has also been dissatisfied as per the analysis of its profitability.
Determination of the Total Shareholder Return value (TSR) for three years
Buying and holding company stock for the longest time refers to the maximum positive return in order to increase the market share price of each company such as PEPSICO, SAB MILLAR, ORACLE Corporation, XEROX and FED EX effectively more than the average margin of the market share significantly for each of the company. Here in this section, total shareholder value for each of the companies over the past three years will be calculated by determining the main factors associated with all of these companies, such as capital gains and dividends, when processing the measurement of total company return a stock effectively. As a result of this process, overall financial benefits are generated for the company shareholders significantly.
TSR Value of Company PEPSICO
In 2018 for the company PEPSICO the returned shareholder value was approximately more than $7 Billion in accordance with dividends and share repurchases. In the case of PEPSICO, the dividend increased rate is for the 46Th consecutive year effectively. According to the 2018 annual report of the organisation PEPSICO, it has been found that they were able to create top tier total shareholder value (TSR), and as a result, the company was able to embrace high quality corporate governance (Quan, 2020). According to the 2018 annual report of the company PEPSICO, operating factors of TSR of 2018 are Reported earnings per share $8.87, PEPSICO cost earning per share is $5.66 and the dividend paid by the company in the year 2018 is $ 4930. Therefore, by utilising the formula of TSR that is (capital gain+ dividend)/ purchase price as of 2018 is ($ 3.4 billion+$5, 66 billion)/$1.4 and therefore the overall TSR of the company PEPSICO at 2018 was approximately 7 billion (Gelles and Yaffe-Bellany, 2019). And in the year 2019, the total TSR of the company gets increased by 3.9%, and the overall change in dividends per share is considerably increased by 8% from the previous year effectively. That is why the total shareholder return of this company was near about $ 7 billion in 2019. As of 2020, the total shareholder return for the company was calculated as $7.5 billion significantly.
|
|
2020 |
2019 |
2018 in $ |
|
Earnings per share |
9.57 |
9.21 |
8.87 |
|
Dividend paid |
5750.3 |
5324.4 |
4930 |
|
TSR |
7.5 |
7 |
1.4 |
TSR Value of Company XEROX
In the case of the company Xerox, as per their latest annual report, the Total shareholder return value has been discovered by evaluating the total capital in addition to the dividend of the company Xerox effectively, such as the entire capital gain of the company is $1,444 million as the common stock dividend is $ 1million (Chen and Feldman, 2018). As per the year 2020, the total shareholder return of this company is $ 14,741 million. Similarly, in the year 2019, the total TSR is approximately $15,047 million, and for 2018 the total shareholder value return is approximately 14,874 million. Therefore, it has been observed that the total equity shareholder share is 39.39% significantly.
|
|
2020 in million |
2019 in million |
2018 in million |
|
TSR |
14,741 |
15,047 |
14,874 |
TSR Value of Company Oracle
In the case of the organisation Oracle Corporation the total shareholder return value in the year 2018 is approximately $46,372 million that is 33.64% of the total assets of the company (Beckers, Van Doorn and Verhoef, 2018). Similarly, in the year 2019, the total shareholder return is considered to be $21.785million, and that is around 20.04% of the total company asset significantly. As of 2020, the determined TSR of the organisation is $12.074million, and that is 10.46% of the total asset of the organisation Oracle Corporation effectively.
|
|
2020 in million |
2019 in million |
2018 in million |
|
TSR |
12.074 |
21.785 |
46,372 |
TSR Value of Company FED EX
In the case of the organisation FED EX, the total shareholder return value is considered to be $19.416 million in the year 2018, which is 37.10% of the company's total assets (Yan, 2019). In the year 2019, the company's total shareholder return was $17.576Million, and that is 32.64% of the company's total asset effectively. Finally, in the year 2020, the TSR value of the company was $18.295million that is considered to be 24.88% of the company total assets significantly.
|
|
2020 in million |
2019 in million |
2018 in million |
|
TSR |
18.295 |
17.576 |
19.416 |
TSR Value of Company SAB MILLAR
The total shareholder return value of the organisation SAB MILLAR in the year 2020 was $ 55million that is 29.81% of the total company asset, and similarly, in the year 2019, the TSR value of the company was approximately $67.458 Million, and that is around 31.78% of the total company asset effectively (Kusi et al., 2018). In the case of 2018, the total shareholder return value of the company is $56.410Million that is 27.37% of the total company asset as per the calculation effectively.
|
|
2020 in million |
2019 in million |
2018 in million |
|
TSR |
55 |
67.458 |
56.410 |
The link between the development of the Results to the Respective Stock Price
The results that have been synthesised from the ROS and ROCE analysis of the chosen firms would be pretty essential for their business development. Various critical insights can be fetched from the evaluation of the results of the corporate organisations. The analysis of the shareholder return of Oracle shows that the company did not have a robust recovery in FY 18. However, the performance changed drastically in FY19 and FY20.
As per the analysis of Ambarwati and Suswardji (2021), it can be predicted that the stock prices of the selected organisations would be impacted primarily as a result of the ROS and ROCE values of the firms. The most advantageous position that is held in this regard is PepsiCo. As a result of the total MVA value of the organisation, the organisation is expected to have robust growth in its business process. Apart from that, Oracle is also in a good position in this regard as it has shown a significant trend of development of its MVA. It can be observed that the organisation that is in the least favourable position in this situation is Xerox and SABMiller. These organisations have not been attached to the robust growth of MVA values in FY 19 and FY 20. As a result of that, the development of the stocks of these organisations has not been very proficient. However, it can be argued that the analysis of the respective stock prices of the organisations can also be attached to various other factors. Hence, the stock prices of the organisations can also be impacted by the internal and external attributes in an effective manner.
Identification of the Index that Outperformed all the Stocks
As per the stock index of 2020, Pepsico mainly ranks 16 with a score of nearly 5.2 out of 10. As power the index of India, Pepsico has been able to improve its commitments and thus performed addressing mainly the undernutrition, which will help develop several new products (Access to Nutrition., 2020). As per Trefis Team (2021), Pepsico has levelled up by 2% in the stock from the last week and outperformed the S&P, which was flat 500. Though the company has been able to successfully return to its stock ratio by 3.7% and thus exceeded the market. With the outperformed stick, the company's organ sales have grown by approx. 9%. With such performance, it has been found that the company is expected to raise its organic sales by 5%. Concerning xerox company, it has been found under index 2020 that shares of the xerox holdings corporation have slumped by 0.43% concerning the S & P 500. According to MarketWatch Automation (2021), it has been found that xerox corp. Have closed its stock by the 52nd week upon which the company has reached by 12th March. But despite being lost, the company's stocks have been able to outperform the competitors as apple Inc fell by 0.56% and thus out passed its competitors effectively.
On the other hand, FedEx has advanced its stock by 1.04%, which has proved positive for the company at the S&P 500 index and has raised by 0.47%. Unlike xerox, FedEx has also closed its stock rise at 52Th week after reaching on 27th May. The company's stocks have been able to outperform the supply of some of its competitors, like United Parcel, which was 0.52% lower than that of FedEx.
According to Zacks Equity Research (2021), Oracle has been able to close at $96.30 as per the index of S&P index and thus have a daily gain of 0.3%. Though in the current status, it has been analysed that the software market has gained the market share by 9.27% from the last few months, and thus the investors will mainly hope for the strength of Oracle and therefore approach towards the subsequent earnings. The company has been able to outperform the competitors like Microsoft corporation and abode inc. As per Blakely (2015), SABMiller has emerged as the top gainer, and its stock has climbed with respect to the BUD bid for the UL-listed Brewer. After joining with the BAV system and ITV, the company stocks have gained by 1.02% and 0.93%, respectively and thus outperformed the supply of the competitors.
Comparison and Discussion of the Results
The marketing and financial analysis of the five companies have stated different studies which have helped to understand which company is outperforming each other by analysing all the aspects of the financial part of the company. This section will describe the comparison of the result between the five companies in respect of ROS, ROCE and Total shareholder return (Yudawisastra, Manurung and Husnatarina, 2018). All the aspects financial element has been analysed for three prior years 2018, 2019 and 2020.
Return on sales
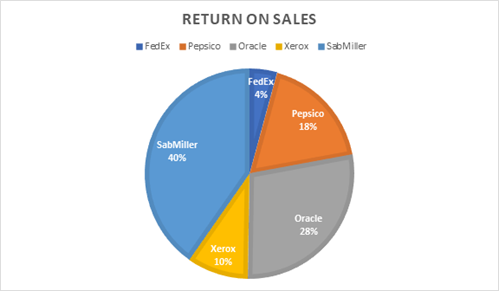
Figure 4: Return on sales
(Source: Created by author)
After analysing the three years of return on sales for all the five companies, it has been found that Sabmiller company has been performing well and thus have adhered to a huge profit margin in respect to the other companies. With the help of the return on the sales value of oracle, it has been able to dominate all the competitors in the software and technology market (Rachlin, 2019). The above graph is the total sum of the return on sales in all three years. It has been analysed that after three years in the recent period, it has risen by 0.43 and thus, it has followed a regression line in the data series. The last year value of the predictor in respect of ROC has stated that the sales have dropped to 3%. Next, the FedEx return on sales suggests that there has been a regular change in the gross profit margin, and thus in 2020, the company has observed an increase in the net profit margin from 2020 to 2018, which is by 6.9%. In comparison with Oracle, FedEx has been able to buckle up its position in 2020 with the sudden increase in online sales, which led to the rise in the return on sales value. After evaluating the ROS in Pepsico, it has been found that it is currently suffering from loss compared to FedEx. The overall net profit margin of the company has been lowered from that of the last year due to the sudden downfall in the economy. Xerox has a minimum return on sales of 10%, which is lower than all the companies but more than FedEx. Return on capital employed.
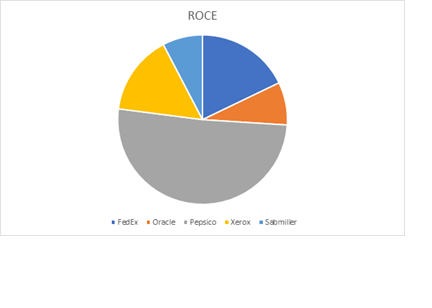
Figure 5: ROCE
(Source: created by author)
The above diagram shows the comparison of ROCE, which has been calculated for the five companies over the past three years. After the comparison, it has been found that with respect to the other five companies, Pepsico has a higher value for the ROCE. The company has a ROCE of 20%, which states that the company is in a normal situation, and thus it is somewhat close to that of Oracle. The trends of the ROCE for the company do not stand out much for the analysis section, but over the past three years, it has been found that the company's ROCE is constant with minimal changes in each of the years. With a stable return on capital, the company’s situation is average in comparison to other competitors (VOROZHBIT et al., 2020). However, on the other hand, FedEx company has a meagre rate on ROCE, which clearly states that the company has been delivering a significantly lower return on the capital and thus focus on the short-term aspect. With respect to the other companies like Oracle and Pepsico, the company has been earning low value on money. Oracle has an average pace with that of Pepsico. The ROCE for Xerox has been found to be 6% which is less than all other companies, but Sabmiller has only 3%, which is the lowest among all the sections. From the early experience, Xerox company states that it has a meagre return compared to other companies. But the weakest among them is Sabmiller which has only 3%. It has been found that the company is still in a position to recover the potential loss. After the calculation of ROCE, it has been found that SABMiller has been trying hard to look after the loopholes of the business.
Shareholder value
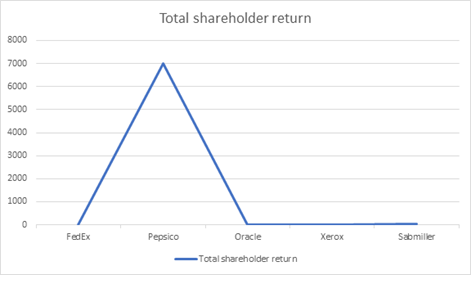
Figure 6: Shareholder’s value
(Source: created by author)
The above graph shows the total shareholder value, which has been analysed for all five companies. Pepsico of TSR has been demonstrated that the company has recorded more than $7 billion as per the various analyses of the financial element of the company. With respect to Pepsico, all other companies have the lowest shareholder return. It has been found that Pepsico is the oldest company in relation to all other five companies. Since the company has a majority of the shareholders thus the owned shares by those shareholders are high in comparison to all other companies. The company pays nearly $4.30 per share, and therefore it is approved by the board of directors. With respect to Oracle, it has gained $12.07 million of TSR. As per Simply Wall St (2021), it has been found that the company shareholders have received an overall share of 47% in one year, which states that the company has been doing well and that it has the potential to come next to Pepsi, which is the highest among all the companies (Hýblová and Skalický, 2018). The TSR value of FedEx shows that its last drawn value for the year 2020 is 18.29 million, which is more than oracle, and thus, with respect to the company's total asset, it is at 24.88%. So, the company needs to buckle up more with regard to Pepsico. Sabmiller in the year 2020 has a TSR value of $55 million, which is more than that of FedEx and oracle, and thus it can be stated though, after the drastic economic downturn in 2020, the company has been able to stay stable in its point effectively. Lastly, Xerox company, as per the latest report of 2020, has a TSR value of $14.7 million, which is the lowest among all the companies. Thus, it needs to change its dividend rate to get the majority of the shareholders for the investment process.
The most suitable method to measure "Shareholder Value"
Shareholder value is considered to be the value of the company that is delivered to the company investors who have a certain amount of shares in this company effectively. The significance of the shareholder value is that it enables the company to increase its investors effectively for the betterment of any business. The most suitable method for measuring Shareholder value is by determining the organisation's earnings per share value and incorporating the respective organisation’s stock price into the earnings per share value. This way, the shareholder value based on per share can be generated quickly (Beckers, Van Doorn and Verhoef, 2018). After generating the shareholder value per share of any organisation, by multiplying this with the number of shares the organisation has, overall shareholder value can be effectively measured for any organisation. The most suitable method for measuring the shareholder value is the SPM model approach that is known as the strategic profit model that is used to measure the RONW of the company that is used to measure the increment and decrement in the organisation’s shareholder values effectively (Chen and Feldman, 2018). This method mainly has three components: financial leverage of the company, net profit, and asset turnover. The primary purpose for considering this method is the most suitable one for measuring the shareholder value of the organisation in order to increase sales of the company. Along with that, it is proven to be a very much effective method for reducing the operating expenses of any organisation effectively.
Conclusion
To sum up, from the above report, it could be stated that there are five companies whose financial position for the last three yeast have been evaluated, which have effectively drawn the company's financial status and thus helps the company take effective strategies for regaining its position. From the different financial analysis, it has been found that 2020 has been an economic downturn for all the companies and have been mainly affected. Return on sales calculations have shown that FedEx is the weakest of all the five companies, and thus it is necessary for these companies to start introducing sales strategies that will help the company to gain much return from the sales. By structuring the sales strategy effectively, it will help the company analyse the company's whole financial report in a proper manner. Return on capital showed that the weakest being Sabmiller which has a lower return on capital, and thus it has effectively hampered. Next, the shareholder's return values state that PepsiCo has been gaining much profit in comparison to other parts.
To conclude from the comprehensive report, it can be noted that one of the companies has been suffering effectively in each financial calculation. It is necessary that every company affected after all the financial analysis needs strategies effectively, which will help the company survive in its respective field. Thus, all the results gathered from all the economic studies will help the companies develop the strategies accordingly. The financial report helped the companies identify the loopholes and select effective ways to deal with them.
Reference list
Access to Nutrition. (2020). PepsiCo India. [online] Available at: https://accesstonutrition.org/index/india-spotlight-2020/scorecards/pepsico-india/
Akgun, A.I., Samiloglu, F. and Oztop, A.O., (2018). The impact of profitability on market value added: Evidence from Turkish Informatics and Technology Firms. International Journal of Economics and Financial Issues, 8(4), p.105. https://www.academia.edu/download/60780656/Ji_220191003-85377-fzttjm.pdf
Ali, T.F., (2018). The influence of economic value added and market value added on corporate value. Russian Journal of Agricultural and Socio-Economic Sciences, 74(2). https://cyberleninka.ru/article/n/the-influence-of-economic-value-added-and-market-value-added-on-corporate-value
Ambarwati, J. and Suswardji, E., (2021). Analysis of Company Financial Performance with Economic Value Added (EVA) and Market Value Added (MVA) Methods. JASa (Jurnal Akuntansi, Audit dan Sistem Informasi Akuntansi), 5(2), pp.245-252. https://journalfeb.unla.ac.id/index.php/jasa/article/download/1696/1015
Beckers, S.F., Van Doorn, J. and Verhoef, P.C., (2018). Good, better, engaged The effect of company-initiated customer engagement behaviour on shareholder value. Journal of the Academy of Marketing Science, 46(3), pp.366-383.https://scholar.google.com/citationsuser=Y9MaKnIAAAAJ&hl=en&oi=sra
Blakely, R. (2015). SABMiller Rises 1.30% on Proposed Takeover Bid by Anheuser-Busch. [online] Yahoo.com. Available at: https://finance.yahoo.com/news/sabmiller-rises-1-30-proposed-151432265.html
Carini, C., Comincioli, N., Poddi, L. and Vergalli, S., (2017). Measure the performance with the market value added: Evidence from CSR companies. Sustainability, 9(12), p.2171. https://www.mdpi.com/2071-1050/9/12/2171/pdf
Chen, S. and Feldman, E.R., (2018). Activistimpelled divestitures and shareholder value. Strategic Management Journal, 39(10), pp.2726-2744.https://www.researchgate.net/profile/Emilie_Feldman/publication/326575739_Activist-Impelled_Divestitures_and_Shareholder_Value/links/5ba19b9e92851ca9ed14b4d4/Activist-Impelled-Divestitures-and-Shareholder-Value.pdf
FedEx. (2021). Annual reports 2020 | FedEx. [online] Available at:
Gelles, D. and Yaffe-Bellany, D., (2019). Shareholder value is no longer everything, top CEOs say. The New York Times.http://www.francodebenedetti.it/http://www.francodebenedetti.it/wp-content/uploads/Shareholder-Value-Is-No-Longer-Everything-Top-C.E.O.s-Say-The-New-York-Times.pdf
Hýblová, E. and Skalický, R., (2018). Return on sales and wheat yields per hectare of European agricultural entities. Agricultural
Economics, 64(10), pp.436-444. https://www.agriculturejournals.cz/publicFiles/209_2017-AGRICECON.pdf
Johan, S., (2018). The Relationship Between Economic Value Added, Market Value Added And Return On Cost Of Capital In Measuring Corporate Performance. Jurnal Manajemen Bisnis dan Kewirausahaan, 2(1). http://journal.untar.ac.id/index.php/jmbk/article/download/4804/2760
Kusi, B.A., Gyeke-Dako, A., Agbloyor, E.K. and Darku, A.B., (2018). Does corporate governance structures promote shareholders or stakeholders value maximisation Evidence from African banks. Corporate Governance: The international journal of business in society.http://ugspace.ug.edu.gh/bitstream/handle/123456789/31682/Does%20corporate%20governance%20structures%20promote%20shareholders%20or%20stakeholders%20value%20maximization%20Evidence%20from%20African%20banks.pdfisAllowed=y&sequence=1
MarketWatch Automation (2021). Xerox Holdings Corp. stock outperforms competitors despite losses on the day. [online] MarketWatch. Available at: https://www.marketwatch.com/story/xerox-holdings-corp-stock-outperforms-competitors-despite-losses-on-the-day-01632173538-10d526b14384
Oracle. (2021). Annual report 2020. [online] Available at:
Pepsico. (2021). Annual report 2020. [online] Available at:
Quan, J., (2020), November. The Trend of PepsiCo by Comparing PepsiCo’s Financial Reports in 2018 to 2019 Based on Harvard Analytical
Framework. In 2020 5th International Conference on Modern Management and Education Technology (MMET 2020) (pp. 162-166). Atlantis Press.https://www.atlantis-press.com/article/125945868.pdf
Rachlin, R., (2019). Return on Investment Manual: Tools and Applications for Managing. Routledge. https://www.taylorfrancis.com/books/mono/10.4324/9781315503813/return-investment-manual-robert-rachlin
Robé, J.P., (2020). The shareholder value mess (and how to clean it up). Accounting, Economics, and Law: A Convivium, 10(3).https://www.degruyter.com/document/doi/10.1515/ael-2019-0039/html
SABMillers. (2021). Annual report 2020. [online] Available at:
Sahara, L.I., (2018). The Analysis of Financial Performance Using Economic Value Added (Eva) and Market Value Added (MVA) Methods and Its Influence on Stock Return of Transportation Company Listed in Indonesia Stock Exchange. SCIENTIFIC JOURNAL OF REFLECTION: Economic,
Accounting, Management and Business, 1(3), pp.301-310. http://www.ojspustek.org/index.php/SJR/article/download/161/157
Simply Wall St (2021). Oracle’s (NYSE: ORCL) five-year total shareholder returns outpace the underlying earnings growth. [online] Simplywall.st. Available at: https://simplywall.st/stocks/us/software/nyse-orcl/oracle/news/oracles-nyseorcl-five-year-total-shareholder-returns-outpace
Syelfia, E. and Afridayani, A., (2021). Pengaruh Market Value Added (Mva) Dan Nilai Tukar Terhadap Harga Saham. SAKUNTALA: Prosiding Sarjana Akuntansi Tugas Akhir Secara Berkala, 1(1), pp.146-161. http://openjournal.unpam.ac.id/index.php/SAKUNTALA/article/viewFile/12855/7586
Trefis Team (2021). PepsiCo’s 2021 Outlook Upgraded: Impact On Stock Forbes. [online] 18 Oct. Available at: https://www.forbes.com/sites/greatspeculations/2021/10/18/pepsicos-2021-outlook-upgraded-impact-on-stock/sh=584145de3a9a
Utami, M.R. and Darmawan, A., (2019). Effect of DER, ROA, ROE, EPS and MVA on stock prices in Sharia Indonesian stock index. Journal of Applied Accounting and Taxation, 4(1), pp.15-22. https://jurnal.polibatam.ac.id/index.php/JAAT/article/download/1195/718
VOROZHBIT, E.G., VYSKREBENTSEVA, A.S. and KOZHEVNIKOV, E.B., (2020). Prediction of return on sales and return on assets to reduce the risk of a tax audit. Revista ESPACIOS, 41(07). http://es.revistaespacios.com/a20v41n07/20410728.html
Xerox. (2021). Xerox Corporation Annual Reports - Shareholder Information. [online] Available at:
Yan, M., (2019). Corporate social responsibility versus shareholder value maximisation: Through the lens of hard and soft law. Nw. J. Int'l L. & Bus., 40, p.47.https://scholarlycommons.law.northwestern.edu/cgi/viewcontent.cgiarticle=1849&context=njilb
Yudawisastra, H.G., Manurung, D.T. and Husnatarina, F., (2018). Relationship between value-added capital employed, value-added human capital, structural capital value-added and financial performance. Corporate finance assignment Investment management and financial innovations, (15, Iss. 2), pp.222-231. http://www.irbis-nbuv.gov.ua/cgi-bin/irbis_nbuv/cgiirbis_64.exeC21COM=2&I21DBN=UJRN&P21DBN=UJRN&IMAGE_FILE_DOWNLOAD
=1&Image_file_name=PDF/imfi_2018_15_2_22.pdf
Zacks Equity Research (2021). Oracle (ORCL) Stock Sinks As Market Gains: What You Should Know. [online] Yahoo.com. Available at: https://finance.yahoo.com/news/oracle-orcl-stock-sinks-market-215009215.htmlguccounter=1&guce_referrer=aHR0cHM6Ly93d3cuZ29vZ2xlLmNvbS8&guce_referrer_sig=
AQAAANgCU85gYnWau4J67BQDW5xRbYOSWIkZO366ra30wwiGRkQ1d__EvwMny_5S_
1NlobFY3bzlGNNJuzznW8WSiKh3-9E4BzxyZlbfWz0xrjFGd5wdyoUFCjLFzQu9y2K8LWyRNXdc3cCSk3mT
_ZZocMXOF9LtCt6m18NawO4Wkbsi


