
SWOT and PESTLE analysis strategic finance management assignment for JD group
Question
Task: howJD Group perform a financial and business market analysis using SWOT and PESTLE analysis strategic finance management assignment research methods
Answer
Introduction
On this strategic finance management assignment JD group of companies will be analyzed. JD Group of Companies is considered a strongly established group with a broad portfolio of interests and services. The foundations for the said group was established in its first organization called JD enterprises in the year 1980s by Mr. Sudesh Bhatia in the United Kingdom. The said group of companies is considered to encompass some associations, companies and partnership endeavors for maintaining its ‘founding philosophy’ of standard, steady expansion (jdgroup.co.uk, 2021). The main objective of this strategic finance management assignment is to focus specifically on the financial analysis of the company along with some business market analysis using relevant tools that include SWOT analysis and PESTLE analysis.
Liquidity ratios
Current assets
2018- $15.251B
2019- $19,98B
2020- $35.985B
2021- $47.024B
Current liabilities
2018- $17.579B
2019- $20.112B
2020- $26.669B
2021- $34.779B
a. Current ratio
The current ratio is a part of the liquidity ratio which shows the ability of the company to pay its short-term loan within one year. The current ratio is calculated by dividing current assets by current liability.
Current ratio = current asset/ current liabilities
Current ratio (2018) = $15.251B/$17.579B = 0.87
Current ratio (2019) = $19.98B/$20.112B=0.99
Current ratio (2020) = $35.985B/$26.669B=1.35
Current ratio (2021) = $47.024B/$34.779B=1.35
As per strategic finance management assignment findings, the ideal current ratio of a company is considered 2:1 (Zhang et al., 2021). This indicates the financial soundness of the business. If the current ratio is less than one (1) then the current asset of the company is less than the current liabilities. Similarly, if the current ratio is greater than one (1) then the current assets of the company are more than the current liabilities. If the company's current ratio is greater than one then it indicates that the company is in a good position. In our assignment, we have analyzed the 4 years current ratio of the JD group. In 2018 and 2019 the current ratio of the company was 0.87 and 0.99 respectively. This indicates that it is not in a very good condition because the current ratios are less than one. But from 2020 it is more than one that shows a positive impact. The overall scenario shows that the company is moving in a positive direction. Which is a good indication for the company. b. Quick ratio- This is also another type of liquidity ratio. This ratio is also termed an acid-test ratio. This ratio helps the company to measure its ability to pay off all the outstanding liabilities of the company without making any sale of its inventories so that the available assets can be quickly converted into cash. The quick ratio is calculated by dividing the liquid assets of the company by its current liabilities. Quick ratio = liquid Assets/current Liabilities Quick ratio= current asset- inventory- prepaid expenses/ current liabilities
Inventory
2018=$6.404B
2019= $8.321B
2020=$9.032B
2021=$11.863B
Quick ratio (2018) = $15.251B-$6.40B/$17.579B=0.50
Quick ratio (2019) = $19.98B-$8.321B/$20.112B=0.58
Quick ratio (2020) = $35.985B-$9.032B/$26.669B=1.01
Quick ratio (2021) = $47.024B-11.863B/$34.779B=1.01
1.1 is considered the ideal quick ratio of a company. By analyzing the quick ratio of the four years of the JD group we have noticed that at the beginning the quick ratio is less than 1 but it has made progress in the later years. This also shows an upward trend in the quick ratio for the company. The business of the company is considered to be healthy if its quick ratio is 1.0 or greater than that. In our findings, we have found that both the year 2020 and 2021 shows a healthy position for the business which means the company can pay back its liability.
As per the strategic finance management assignment findings the company needs to measure its liquidity ratio because it enables the company to understand how it can pay its liabilities by using its current assets (Susanti, Latifa &Sunarsi, 2020). Profitability ratio A profitability ratio is a type of ratio that is calculated by different companies to determine the ability of the business to generate earnings from its revenue, operating costs, and others (Husain &Sunardi, 2020). It generally helps to indicate how efficiently the company can generate its profit and shareholder value. a. The gross profit ratio- is also termed as gross margin ratio. This is a type of profitability ratio. This ratio helps the company to determine what amount of profit it has earned by selling its goods and services after making a deduction of the direct costs. It helps to evaluate the profitability of the company. This also helps to determine how the company is using its labor and raw materials in the most efficient ways. On this strategic finance management assignment the gross profit ratio is obtained by dividing gross profit by net sales.
Gross profit ratio = (gross profit/ net sales)*100
Gross profit
2018= $9.593B
2019=$12.126B
2020= $16.722B
2021=$20.254B
Net sales
2018=$67.198B
2019= $82.865B
2020= $114.299B
2021=$149.326B
Gross profit ratio
2018= ( $9.593B/67.198B)*100= 14.27%
2019= ($12.126B/ $82.865B)*100= 14.63%
2020= ($16.722B/$114.299B)*100=14.62%
2021= ($20.254B/$149.326B)*100=13.56%
If a company has a gross profit margin between 50%to and 70% then it is considered to be a healthy business. But in the case of a small company, it may be low. It depends upon the size and nature of the company. If the gross profit ratio is more then it indicates higher efficiency. This ratio helps to determine how well the company is being managed. In our assessment, we have found a small rate of increase in gross profit ratio from 2018 to 2020. But again in 2021, it has slightly decreased. This decrease in the gross profit depends on various factors like the higher cost of goods sold for a prolonged period will insist the supplier increase their revenue. Then reducing the price for increasing sales may reduce the gross profit margin. Changes in industry and increases in the competition are also the different reasons for the decrease in gross profit. b. Net profit ratio- net profit ratio is an accounting tool that is used to make a comparison of after-tax profit with the net sales. The strategic finance management assignment research shows it generally shows the profit which is left after making a deduction of all costs from sales (Nariswari&Nugraha, 2020). The net profit ratio is calculated by dividing net profit by net sales.
Net profit ratio= (net profit/net sales)*100
Net profit
2018= $-362B
2019=$1.750B
2020=$7.572B
2021=$-559B
Net profit ratio
2018= ($-362B/$67.198B)*100= -0.53%
2019=($1.750B/$82.865B)*100=2.11%
2020=($7.572B/ $114.299B)*100=6.62%
2021=($-559B/$149.326B)*100=-0.37%
Every business considers 10% as an average net profit ratio. And if it is 20% then it is considered to be high or above average. If a company has a high net profit ratio then it is good because it shows how effectively the company is controlling its cost and selling its goods and services at a higher price than its cost. In our assessment of 4 years, we have seen that in 2018 the net profit ratio is negative which indicates that the cost of production for that particular year is more than the revenue. The same has been noticed in the last year, also that is 2021. The years between 2018 and 2021 show a positive and upward trending value. The negative profit margins occur for various external factors over which the company has no control and for various unnecessary and unexpected expenses. c. Operating profit ratio- this ratio determines how much profit the company generates from its operation. The operating profit ratio is calculated by dividing operating profit by total revenue. This ratio has been identified on this strategic finance management assignment as being important for the company because with the help of this ratio the company can understand its performance in comparison to the other company. Operating profit ratio ratio= (operating profit/net sales)*100 Operating profit = revenue- operating cost- cost of goods sold
Revenue
2018=$67.198B
2019=$82.865B
2020=$114.299B
2021=$149.326B
Operating cost
2018=$67.579B
2019=$81.573B
2020=$112.408B
2021=$148.676B
Cost of goods sold
2018=$57.605B
2019=$70.739B
2020=$97.578B
2021=$129.072B
Operating profit
2018= $-57.986B
2019=$-69.447B
2020=$-95.687B
2021=$-126.422B
Operating profit ratio
2018= -86%
2019=-83%
2020= -83.71%
2021=-84.66%
The ideal operating ratio is considered 16.67% and if it is less than 5% then it is considered as low. In our calculation, we got a negative operating profit ratio. This happens when the total cost of operation is more than the company's revenue.
Efficiency ratios
The strategic finance management assignmentresearch also shows that efficiency ratios are mainly used by companies to determine how the company is utilizing its assets and liabilities. This ratio is also known as the activity ratio. This ratio helps to evaluate the performance of the company.
a. Stock turnover ratio- this is also known as inventory turnover ratio. This helps to determine how efficiently the company is turning its inventory into sales. This ratio helps how the company is managing the cost associated with a stock. And whether they are purchasing more or less stock with the available amount.
Stock turnover ratio= cost of goods sold/average stock
Cost of goods sold
2018=$57.605B
2019=$70.739B
2020=$97.578B
2021=$129.072B
Average stock
2018=$34.6875B
2019=$29.2103B
2020=$61.1034B
2021=$79.8244B
Stock turnover ratio
2018=1.66
2019=2.42
2020=1.59
2021=1.61
The ideal stock turnover ratio needs to be between 5 and 10 (Hanum, 2021). This indicates that the company can sell and restock the product within one or two months. In our assessment, we have found that the stock turnover ratio is between 1 to 3. If the inventory turnover ratio is between 2 and 4 then it is considered a sweet spot. So the year 2019 is considered a sweet spot. A low inventory turnover shows weak sales. b. Working capital turnover ratio- this ratio needs to be calculated by the company because it helps to determine how the company is using its working capital in the business.
Working capital turnover ratio= net sales/net working capital
Net working capital= current asset- current liability
Net working capital
2018=$-2.328B
2019=$-0.132B
2020=$9.316B
2021=$12.245B
Working capital turnover ratio
2018=-28.86
2019=-627.76
2020=12.27
2021=12.19
If the working capital turnover ratio is high then it is good. In our prediction, we have found a negative working capital ratio at the beginning and then it turned positive. When the current liabilities of the company increase its current assets then it is a negative working capital turnover ratio.
c. total asset turnover ratio- this ratio is helpful for the investors to determine how the company is effectively using its assets to generate sales.
Total asset turnover ratio= net sales/total assets
Total asset
2018=$30.422B
2019=$37.307B
2020=$64.718B
2021=$77.912B
Net sales
2018=$67.198B
2019= $82.865B
2020= $114.299B
2021=$149.326B
Total assets turnover ratio
2018=2.2
2019=2.2
2020=1.7
2021=1.9
strategic finance management assignment report that if the asset turnover ratio is greater than one then it indicates good for the company. This is because the company can generate more revenue for itself. Here in all the years, the asset turnover ratio is greater than 1 which means it is healthy for the company.
Investors ratio
these ratios are used by the investors to determine the ability of the company to maintain its profitability.
a. Earning per share- this represents the earnings acquired by the company over time. This is calculated by dividing total earnings by outstanding shares of the company.
Earnings per share
2018= $-0.26
2019=$1.18
2020=$4.86
2021=$-0.36
Earnings per share for 2018 and 2021 are negative because of its negative income. This means the company is spending more money than its earnings.
b. Price to earning ratio- it is mainly calculated by the investors to determine the stock’s value in the market as compared to the earnings of the company.
Price to earning ratio= share price/ earnings per share
Share price
2018=20.44
2019=34.41
2020=85.85
2021=68.44
Price-to-earning ratio
2018=78.61
2019=29.16
2020=17.66
2021=0.00
The ideal price-to-earnings ratio is 20-25. Higher than that is considered bad. So, 2018, the price-earnings ratio is bad. But lower than the range is considered better.
PESTLE Analysis
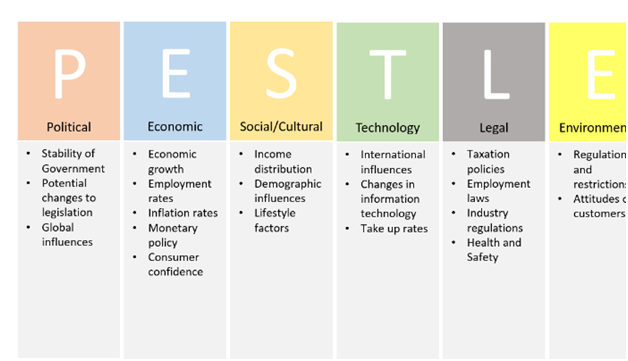
Figure 1: PESTLE Analysis
(Source:ictafra.files.wordpress.com)
The PESTLE analysis helps to identify the impact of the political, economic, social, technical, legal, and environmental factors on the financial growth of the company (Tengtarto, 2020). It helps to analyze the macro environment of JD Group.
Political: The political factors that create an impact on the business of the change of the groups are the political stability. The political stability of the countries where the company operates creates a major impact on its marketing growth. Along with this, the level of corruption regarding consumer service, taxation policies, and pricing regulation impact the business as well. The company has its headquarters in England, and the political stability of this country has influenced its growth. But the rise of populism can lead to instability as well. The UK government has resource allocation for sustainable business and that can contribute to the financial resources of the company. Economic: The availability of a skilled workforce in the United Kingdom is moderate to high and it impacts the business of the JD Group. The global pandemic scenario which led to the global economic recession of 2020 has impacted the business negatively. The fluctuating exchange rate of currency affects the business as it operates in various regions around the world. The retail industry of the UK in the equity market has an availability of liquidity (Biesingeret al. 2021). It can help the company to expand further. Along with this, the lower inflation rate is providing an additional opportunity for this company. Despite having stability in the household income of the consumers, the growing inequality in the society is creating a negative impact and affecting the spending behavior of the consumers.
Social:the strategic finance management assignmentresearch shows the attitude toward migration is always negative in the United Kingdom and that is creating a negative impact on the abilities of the company to bring International leaders to come and manage the operations in this country. The traditional and social media in this country is rapidly growing. It is influencing the trend of e-commerce business among the consumers and as a result of that, it is also enhancing the revenue growth of this company nationally and globally (Phan, 2021). The power structure of the society of the UK and the increasing inequality within the society is impacting the business. The average education level is higher in the country and this helps the company to have a better skilled and educated workforce.
Technical: The major competitors of this company are incorporating the enhanced technologies and that is creating a potential set for this company. The company needs to invest more in the research and development of new technology that can help enhance revenue growth. The company has utilized automation successfully which provided them with constancy in the quality. The maturity level of the technology is still not achieved by the companies in the retail sector, so as a result of that, the competitors are intending to improve their technical capacity, to modify the production process (Lee & Hong, 2021). The technical innovations are disrupting the supply chain as well, as it is providing better access to the information to all of the competitors and the partners of the supply chain at the same time.
Legal: the company needs to meet the regulations regarding the health and safety of the United Kingdom. Legal protection of the intellectual property and the copyrights regarding the product is helping the company deal with the emerging issues of counterfeit products. The risk of this duplicate product is increasing daily and with the help of this law regarding the intellectual property they can ensure that the uniqueness of their product remains secure. The data protection law and the business laws of the United Kingdom fact on the business as it help them to protect from data breaches. Along with this, the guidelines regarding the employment law should be maintained by the company to reduce the rate of employee turnovers. The company is also entitled to maintain the international trade laws as well.
Environmental: The initiative toward the sustainable development of the products in the retail industries has created an influence on the market (Naidoo &Gasparatos, 2018). It has impacted the business of the JD group. The company is entitled to maintain the environmental law and take care of the West Management process to achieve a sustainable goal. The potential consumers of the company are also aware of the environmental norms and prefer eco-friendly products. The circular economy is the new sustainable trend in the market that intends to reduce the amount of harmful wastage. It is creating a potential opportunity for the big companies in the retail industry like JD Group.
SWOT Analysis
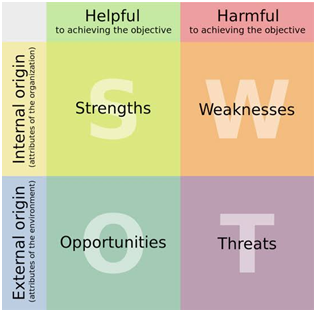
Figure 2: SWOT Analysis
(Source: 3070introtosocialmediapractice.wordpress.com)
SWOT analysis is a marketing tool that helps to analyze the internet and external factors of an organization. It helps to evaluate the key strengths, weaknesses, opportunities, and threats that can create an impact on the organization's growth (Benzaghtaet al. 2021). Here are four major components of the JD group's SWOT analysis,
Strength: JD Group is one of the largest companies in the industry and it incorporates a huge number of factors that can be identified as its strengths (Susanto et al. 2019). These strengths not only help in their business growth but also protect them from the future risks of the existing market. The following are some strengths of the company identified on this strategic finance management assignment.
• Reliable Supplier: The Company has a huge number of suppliers who belong to different regions of the world. It maintains the flow of the supply chain.
• Distribution: The Company has a huge number of outlets in nearly every region of the world. They are also supported by a strong distribution channel that ensures the availability of their products in every outlet.
• Cost structure: Their cost structure helps the company to produce their product at a lower cost which makes it affordable to the consumers.
• Quality assurance and brand recognition: The Company has continuously maintained an assured quality over the years which have increased the brand awareness among the consumers.
• Automation: Automation helps the company maintain the consistency of the quality of their product. It minimizes their operational time and maximizes their production.
• A skilled and diversified workforce: The Company has a huge diversified and excellently skilled workforce as they have significantly invested in the training procedure of their employees.
• Social media and website: The Company has achieved excellence in digital marketing. They are frequent on social media platforms and have an attractive website as well that helps them reach a larger consumer base within a shorter time.
• Product portfolio: The Company has a large product portfolio and the copyright regarding the protection which provides them with an additional competitive advantage.
• Strong financial resources: The Company has a strong free flow of cash as they have generated successful returns on capital expenditure. Apart from this, it has a large asset base that helps the company by contributing to enhanced solvency.
• Entering a new market: The organization has the expertise to enter the new market areas. They have showcased great performances in the new market with an innovative and large product range.
Weaknesses: this strategic finance management assignment also observed the Company has a few weaknesses that should be improved by them to achieve better financial growth. The following are the weaknesses that should be modified (Benzaghtaet al. 2021).
• Research: The Company needs to spend on their research and development to innovate new products like their competitors.
• Cost in sales inventory: The products take a higher time to be purchased and sold than the other company's products on average, so the unnecessary cost of building up inventory creates a disadvantage for the company.
• Limited Access: The Company has very limited access outside of that sore business. They should work on this and move to other product segments to maintain the growth.
• Lack of market research: The Company has not conducted proper market research in the past two years.
• Rented property: The majority of their properties are rented for which they have to pay a huge amount of money.
• Employee turnover: The Company has a significant rate of employee turnover. The workload for them is higher than other companies in this sector. The skilled employees leaving the company create a shortage of talent. The performance appraisal of them is also not conducted in a proper systematic way. It affects the work morale of the employees and they leave the organization.
• Lower current ratio: The Company has a lower current ratio than the average current ratio of the industry and in the future, it may cause issues regarding liquidity.
Opportunities: There are a few opportunities in the external market that the companies need to explore to boost their sales. The following are the potential opportunities.
• Internet: The increased number of internet users has created scope for the business as it has created the opportunity to expand their business online.
• Lower Inflation: The inflation rate is lower which creates an advantage for the company as it may keep the cost of inputs low as well.
• Population: The positive rate of the growing population is creating a new potential consumer base for the business.
• E-Commerce: The recent growth in the e-commerce industry is creating opportunities for the JD Groups as the consumers are shifting their shopping trends to online marketing (Urbonaviit&Maknickien, 2019).
• Globalization: Globalization helps the company to the different regions around the globe and does not keep it restricted within a specific country or region.
• Government: The reduction in tax rate and green government initiatives have helped the company to grow as they can sell their products to the government contractors as well.
• Digital marketing: The score of digital marketing including social media is creating a huge opportunity to reach larger consumers around the world at once. It creates scopes for earning better revenue from this new potential consumer base.
Threats: These are the potential threats that should be avoided by the company to keep its position secured in the market.
• Suppliers: The bargaining power has increased but the number of suppliers decreased significantly. This leads to a situation where the cost of production can be increased significantly.
• Technical advancement: The competitors of the company have incorporated advanced technologies that can result in a decreased market share by the company.
• Exchange rate: The fluctuating exchange rate between the home country and either country can affect the financial resources of the business.
• Counterfeits: There are a huge number of duplicate products that are available in the market, affecting the uniqueness of the company's products (Bridge, 2018).
• Interest rate: The fluctuating interest rate is creating an unstable economic condition and that may create an impact on the business.
• New entrants: The number of new entrants is increasing significantly in the market who are gaining market share by acquiring the market shares of the present companies like JD group. It can be identified as a potential threat to the business as well.
• Political uncertainties: The political uncertainities in the countries and the civil war between China and the United States can also be identified as a significant threat to the business. It is creating issues with the performance.
• Changing consumer needs: The taste of the target consumer base is changing and that is creating challenges for the company to create new products that can meet the consumer's needs.
This situational assessment helps the company to create its marketing strategies in a better way and they can work on its weaknesses to improve its sales growth. Along with this, they can amplify their strengths and utilize the present opportunities to enhance their financial growth as well.
Conclusion
JD Group is one of the leading companies in the retail sector. This report aims to provide new plans and strategies for the financial growth of the company. The analysis of the previous four years' financial report is analyzed to identify the pattern of the company's growth and potential challenges for the business. This report has analyzed the financial reports of the previous four years. The ratio analysis has been conducted regarding the financial data for 2018-2021. The liquidity and efficiency ratio has been analyzed along with the profitability and investor ratio. This report also includes the PESTLE and SWOT analysis of the company. The macro-environment analysis with the help of the PESTLE analysis has analyzed the significant developmental factors in the company and the retail sector as well. Along with this, the SWOT analysis of the company helps to identify the internal and external strategic factors that help to intensify the growth of the company. The strategic finance management assignmentfindings show that it also helps the organization to recognize the potential threats and opportunities for the foreseeing future.
Reference
Benzaghta, M., Elwalda, A., Mousa, M., Erkan, I., & Rahman, M. (2021). SWOT analysis applications: An integrative literature review. Journal Of Global Business Insights, 6(1), 55-73. https://doi.org/10.5038/2640-6489.6.1.1148
Berridge, H. (2018). A practical look at the challenges luxury fashion brands face in the wake of digitalization: is it time that luxury fashion brands learn to love e-commerce platforms.Journal Of Intellectual Property Law &Amp; Practice, strategic finance management assignment13(11), 901-908. https://doi.org/10.1093/jiplp/jpy120
Biesinger, M., Bircan, C., &Ljungqvist, A. (2020). Value Creation in Private Equity. SSRN Electronic Journal. https://doi.org/10.2139/ssrn.3607996
Hanum, S. (2021, November). Analysis of Inventory Turnover and Debt to Equity Ratio in Increasing Profitability in PT. Nusantara IV Plantations, Medan. In Journal of International Conference Proceedings (JICP) (Vol. 4, No. 2, pp. 518-527). DOI: https://doi.org/10.32535/jicp.v4i2.1285 Husain, T., &Sunardi, N. (2020). Firm's Value Prediction Based on Profitability Ratios and Dividend Policy. Finance & Economics Review, 2(2), 13-26. DOI: https://doi.org/10.38157/finance-economics-review.v2i2.102 ICT Business : Image. Ictafra.files.wordpress.com. (2022). Retrieved 22 June 2022, from https://ictafra.files.wordpress.com/2017/05/img_0937.png.
jdgroup.co.uk. (2021). Home. JD Group of Companies. Retrieved 22 June 2022, from https://www.jdgroup.co.uk/home.
Lee, E., & Hong, J. (2021). The Efficient Analysis Case of Distribution: Focusing on Company A Fashion Retail Stores. The Korean Data Analysis Society, 23(6), 2863-2877. https://doi.org/10.37727/jkdas.2021.23.6.2863
Naidoo, M., &Gasparatos, A. (2018). Corporate environmental sustainability in the retail sector: Drivers, strategies and performance measurement. Journal Of Cleaner Production,strategic finance management assignment203, 125-142. https://doi.org/10.1016/j.jclepro.2018.08.253
Nariswari, T. N., &Nugraha, N. M. (2020). Profit growth: impact of net profit margin, gross profit margin and total assests turnover. International Journal of Finance & Banking Studies (2147-4486), 9(4), 87-96. DOI: https://doi.org/10.20525/ijfbs.v9i4.937
Phan, S. (2021). The effect of PESTLE factors on development of e-commerce. International Journal Of Data And Network Science, 37-42. https://doi.org/10.5267/j.ijdns.2020.11.005
Susanti, N., Latifa, I., &Sunarsi, D. (2020). The effects of profitability, leverage, and liquidity on financial distress on retail companies listed on Indonesian Stock Exchange. JurnalIlmiahIlmuAdministrasiPublik, 10(1), 45-52.DOI: https://doi.org/10.26858/jiap.v10i1.13568
Susanto, A., Susanto, A., &Bastari, A. (2019). FORMULATION OF THE DEVELOPMENT STRATEGY OF AN ORGANIZATION USING A SWOT ANALYSIS. JOURNAL ASRO, 10(3), 131. https://doi.org/10.37875/asro.v10i3.171
SWOT Analysis. Introduction to Social Media Practice. (2022). Retrieved 22 June 2022, from https://3070introtosocialmediapractice.wordpress.com/swot-analysis/.
Tengtarto, J. (2020). INFLUENCES OF INTERNAL ENVIRONMENT, EXTERNAL ENVIRONMENT, BUSINESS ETHICS AND ENTREPRENEURSHIP TOWARD BUSINESS PERFORMANCES THROUGH DIFFERENTIATION STRATEGIES AND COMPETING SUPERIORITIES IN SMALL INDUSTRIES IN SURABAYA CITY. Archives Of Business Research, 8(1), 138-151. https://doi.org/10.14738/abr.81.7551
Urbonaviit, K., &Maknickien, N. (2019). INVESTIGATION OF DIGITAL RETAIL COMPANIES FINANCIAL PERFORMANCE USING MULTIPLE CRITERIA DECISION ANALYSIS / SKAITMENINS MAŽMENINS PREKYBOS MONI FINANSINS VEIKLOS TYRIMAS TAIKANT DAUGIAKRITERIUS SPRENDIM ANALIZS METODUS. Mokslas - LietuvosAteitis, 11(0), 1-9. https://doi.org/10.3846/mla.2019.9737
Zhang, M., Yang, H., Wang, H., Wu, Y., & Li, Y. (2021). Efficiency analysis and optimization of a three-coil wireless power transfer system based on an active rectifier using optimal current ratio control. Journal of Power Electronics, strategic finance management assignment21(8), 1233-1242. https://doi.org/10.1007/s43236-021-00263-3


