
Evaluation of ASOS PLC Financial Performance
Question
Task: This assessment requires students to produce an individual report analyzing the performance and operations of a company listed onthe Alternative Investment Market (AIM)of the London Stock Exchange within a selected sector.A list of companies is provided for students to select from.This assessment represents 50% of the total marks.
Answer
Section A
Introduction to the case of ASOS PLC financial performance
Financial decision-making is the process where the entity and managerial decisions, especially related to the liabilities and stockholder’s equity, are made by the top management (Qiuet al., 2016). The given study is about a retail sector business in the UK where the past 5 years’ ASOS PLC financial performancehas been assessed using accounting ratios. The ASOS PLC financial performance assessmenthas been conducted from 2015 to 2019 FYs. ASOS PLC is an online fashion and cosmetic retail brand of Britain that was established in London in the year 2000. The target customers of the company are Generation X where the company sells off merchandise of more than 850 brands and its personal range of clothing and accessories. The turnover of the company for 2019 was £2.573 billion, net profit as £1.307 billion and more than 4000 employees employed for the company till 2019. The headquarters of the company is in London; however as per the ASOS PLC financial performance, the company exports its products in 196 countries from the UK, USA and EU. The main product lines of the retail entity are its garments, footwear, accessories and beauty ranges. Top competitors of ASOS PLC are Papaya Clothing CO, JustFab Inc. and Yoox.
UK Retail Sector
UK retail is expected to grow by at least +1.0% in the current year after suffering 3.5 years of downfall. The perceived uncertainty in the political situation in the UK due to its exit from the UK is likely to increase consumer confidence and increase household expenditure. The total revenue earned by the retail sector in 2019 was £394 billion. As said by Miroshnychenkoet al. (2017) with regards to the ASOS PLC financial performance, the UK retail industry is the worst year for the sector in 2019. The sales of British sales fell for the first time in the past 24 years as the dire performance with a major fall in the sale of high street fashion sales. The total sales of the entity had slipped down by 0.1% in 2019 according to BRC which is the lowest since its beginning of the sector in 1995. The fashion chains like Forever 21, Coast, Karen Millen and others had disappeared from the market since last year. As per the report of Local Data Entity, greater than 12% of the shops were presently standing vacant as compared to 11.5% in 2018 (Reguera-Alvaradoet al., 2017). The ASOS PLC financial performance signifies that the online real sales rose by 20.5% by value and non-seasonal adjustment of products throughout the year. The total retail rose by 4.2% year to year according to Retail Economics. The online penetration accounted for 17.5% in terms of retail sales.
1. Analysis of the accounting result of ASOS PLC from 2015 to 2019
The accounting position of ASOS PLC has been examined at the end of 29th February 2020. The past six months of performance review projects there has been an increase in the sales from 21% to £1.6 billion. The NP of ASOS PLC has been increased from £3 million to £23.1 million. The year on year NI of ASOS PLC fell by 70.15% from 82.40 million to 24.60 million despite there has been a higher of 13.08% revenue from 2.42 billion to 2.73 billion (Asosplc.com, 2020). The increase in the COGS in a form of a percentage of sales from 48.82% to 51.9% leads to the fall of the net profit despite an increase in revenue. There has been an increase in international retail sales for ASOS PLC by 22% with 22.3 million active customers. The overall ASOS PLC financial performance in its entire revenue segmentation region reflected a Black Friday with stronger customer engagement activities of the entity. The total orders of ASOS PLC increase by 20% by 27.7 million (Asosplc.com, 2020). Due to stiff competition in the retail market of the UK as well as at international level, ASOS PLC is at marginal risk to make a sustainable place for itself with its existing financial backing.
Profitability Ratio
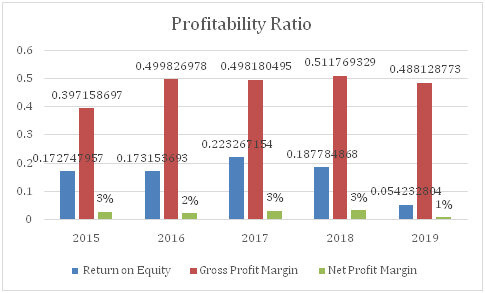
The profitability ratio for theentity assesses the approximate capacity of the entity in darning profits from the revenue generated throughout the year. Likewise, ASOS PLC measured its profitability capacity from 2015 to 2019 by computing three profit ratios like Return on Equity (ROE), Gross Profit Margin (GP) and Net Profit Margin (NP) ratios. The ROE of ASOS PLC financial performancefor the past 5 years was recorded between 5% and 22% as the lowest in 2019 and highest in 2017 (Annualreports.com, 2017). The ratio remarks the effectiveness of the business managers in using the entity’s assets to create greater profits. A good ROE ratio for a retail sector must lie between 15% and 20% which can be found with ASOS PLC except in 2019. As mentioned above, 2019 was the worst possible year for the UK retail sector due to which the performance of ASOS PLC fell drastically (Annualreports.com, 2019). A higher ROE suggests that the entity is upward its profit without much need for outside capital.
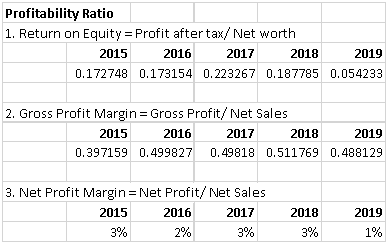
The GP ratio of the entity was 40%, 50%, 50%, 51% and 49% respectively. The ratio defines the relationship between sales and gross profit (Annualreports.com, 2018). It depicts half of the sales is made up of gross profit. Therefore, the gross profitability position is exceptionally well for ASOS PLC financial performance over the past 5 years. The NP margin talks about the proportion of sales that have contributed to making up the NP for the year. It includes net operating profit or loss based on the operational performance. The NP ratio is extremely poor, ranging between 1% and 3% for the business (Annualreports.com, 2016). The NP ratio from 2015 to 2019 was 3%, 2%, 3%, 3% and 1%. (Annualreports.com, 2015) It strongly predicts that day-to-day activities of ASOS PLC financial performanceare not effectively defined and uses more of current assets and working capital in financing its retail operations. A higher Profitability supports better financial health which is absent for ASOS in terms of net profit margin with no fixed trend thus an abrupt flow of funds in and out of the business.
Liquidity Ratio
According to the ASOS PLC financial performance, the liquidity ratio for theentity divides the marketable assets and cash in hand of the entity by the current term borrowings and CL. A higher liquidity ratio results in full coverage of the ST obligations of a business (Paniaguaet al., 2018). To measure a liquidity position of ASOS PLC, three types of liquidity ratio has been computed as the CR, QR and absolute liquidity ratio. The CR for ASOS PLC financial performanceare 1.42:1, 1.04:1, 0.94:1, 0.90:1 and 0.80:1 from 2015 to 2019 (Annualreports.com, 2017). It can be observedthat in the past 5 years from 2015 to 2019, the performance of CR for the business is depleting.
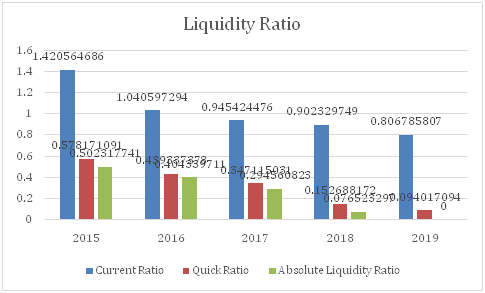
In other words, the ASOS PLC financial performance is losing out on its effectiveness of CA to meet up its short-term obligations of CL since 2015. The quick ratio of the business is the ratio between CL and quick assets(Hasanet al., 2018). The quick assets involve cash, bank, and marketable securities that have a high liquidity value of turning into cash. From the quick ratio, the regular operational efficiency can be justified for the business. The optimal value of the quick ratio is 1:1 which cannot be found for ASOS PLC financial performancein any of the five years.
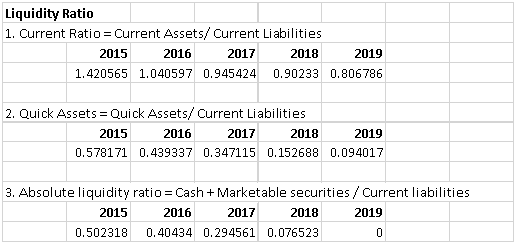
It signifies that there is an insufficiency of quick assets available with ASOS PLC in meeting up with its ST liabilities. The absolute liquidity ratio known to beconnection between CL and liquid assets.As said by Gartenberget al. (2019), the ideal ratio is 1:2 with one part of liquid assets and double of CL. The accounting ratio for ASOS PLC financial performancelies between 0 and 0.50 which implies a poor liquidity position of the entity in managing its CA and CL well. The liquidity position of the business signifies a much higher proportion of debt obligation with the entity with a lower amount of CA to finance and meet them within the due date which is 1 year (Nolletet al., 2016).
Gearing Ratio
A gearing ratio is the accountingquantity or the percentage of total capital employed which is generated from the long-term liabilities like bonds, debentures and mortgages. The three gearing ratios computed for ASOS PLC financial performancefor the last 5 years include debt ratio, interest coverage ratio and proprietary ratio. A debt ratio calculates the composition for debt capital into the overall capital structure of the business. It is wise to choose an optimal proportion of capital depending upon the total cost of capital comprising the debt cost and equity cost. The debt ratio is abrupt over years from 2015 for ASOS PLC financial performancebeginning from 50% in 2015 and ending with 64% in 2019 (Annualreports.com, 2019).
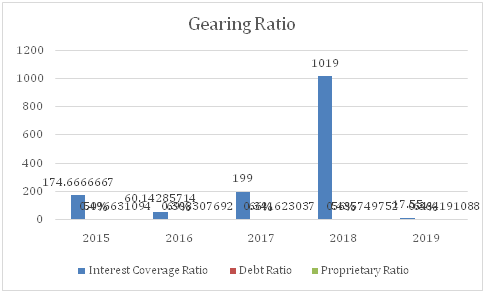
The highest debt ratio was recorded in 2016 as 69% indicating that over 50% of the capital of ASOS PLC financial performanceis heavily dependent on debt funding. The interest coverage ratio measures the proportion of interest expenses covered by the operating profits of the entity (Kimet al., 2018). Since 2015, the interest coverage borne by the entity has been depleting resulting in the favourable financial position of ASOS PLC. The interest coverage ratio for the entity over the past 5 yearsASOS PLC financial performance beginning from 2015 were 174.667, 60.1428, 199, 1019 and 17.55 (Annualreports.com, 2017). There has been an abrupt trend in determining the total interest burden of the business.
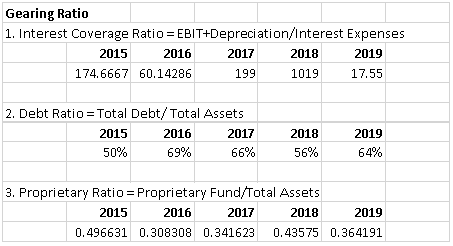
Depending upon the long-term liabilities held by the business, the entity has made payment for its interest coverage ratio. As opined by Shaikh (2020), the operating income shall be independent with a lesser burden of interest payment liabilities to the LT liability holders of the entity. As per the ASOS PLC financial performance, a proprietary ratio provides a rough estimation of the total capitalisation value of the business that can be used to support the entity in the market. The proprietary ratio for 2015 to 2019 was 0.49, 0.30, 0.34, 0.43 and 0.36 (Annualreports.com, 2018). It can be observed that the market capitalisation of the business is marginally above 50% within a steady growth and development of business in the near future.
What is the effect of efficiency ratio on ASOS PLC financial performance?
The efficiency ratio calculates the effectiveness of revenue with a few specific line items in the balance sheet. For instance, the TA turnover ratio calculates the connection of TA helping the business in generating sales. The stock turnover ratio calculates the COGS with the average inventory of the entity (Wen and Zhu, 2019). The average inventory is determined by the closing stock of the current year and opening stock of the present year. The debtor’s turnover ratio calculates the proportion of credit sales within the total revenue of the entity. The TA turnover ratio from 2015 to 2019 for ASOS PLC financial performancewere 3.01 times, 2.22 times, 2.28 times, 2.40 times and 2.19 times respectively (Annualreports.com, 2015).
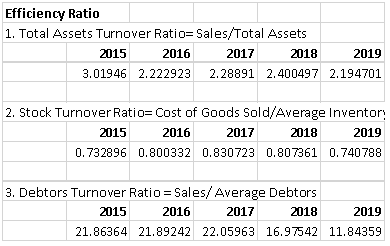
It can be noticed through the ASOS PLC financial performance that since 2015, there has been a downwardflowin the ratio indicating a lower proportion for the total assets contributing to re-generating total sales for the entity. The inventory turnover ratio for ASOS PLC was 0.73 times, 0.80 times, 0.83 times, 0.80 times and 0.74 times from 2015 to 2019 (Annualreports.com, 2016). ASOS PLC financial performanceshows that since 2015 there has been an upward trend of stock inventory ratio, however, it began to decline from 2018 from 0.83 to 0.80 times showing lack of efficiency of converting raw materials into final products (Annualreports.com, 2018).
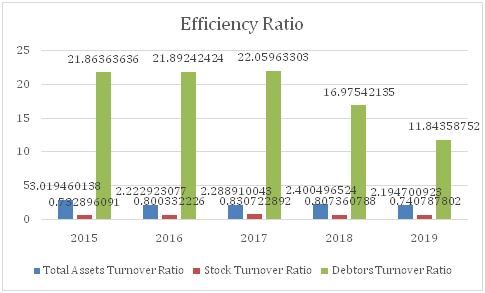
The accounts receivables turnover ratio had a moderate rate of downfall from 21.86 times to 11.84 times from 2015 to 2019 by 10 times within 5 years (Annualreports.com, 2019). It shows that the credit policy of the entity has become rigid in converting its credit sales into cash soon. The lower the value of this ratio, the better is for the entity to generate more cash reserve for itself and finance for its operating activities (EastonandSommers, 2018). For ASOS PLC financial performance, the credit sales value is marginal resulting in a greater volume of sales conducted through cash. The retail sector has higher chances of running into higher bad debt which is strictly maintained by ASOS PLC financial performance.
Section B
1. Critical evaluation of ASOS PLC corporate governance and compliance report
The corporate governance of ASOS PLC exhibits the maintenance of accurate guidelines of corporate governance that is important for the better managerial capabilities and governance of the ASOS PLC. (IoniciandAdhikari, 2017). The Board of Directors of the entity is responsible for ensuring that it lives up to the guidelines and must monitor the entity's policies (Carreras-SimandCoenders, 2019). It shall ensure appropriate measures to protect the nature, status, size and circumstances of the business. The Chairman for ASOS PLC introduced ‘Doing the Right Thing’ as its business model having good corporate governance as its key undertaking. ASOS PLC financial performance holds a significant market capitalization where it is required to recognize the need for ensuring that the government policies adopted are the effective framework that shall provide a path to the external investor community, employees, and suppliers and to run the business in an effective manner (Asosplc.com, 2020.) As a part of the internal business community, the entity believes in the diversity of workforces where 38% of its employees are women and 6% are male workers.
(Source: Asosplc.com, 2020)
2. Discuss and propose the medium-term financial strategy for ASOS PLC to dominate the industry
The MT financial strategy for ASOS PLC should propose an expansion of business in the UK retail sector for securing economic growth, planning and timely product delivery to customers, management of market demand, and meeting with customers’ demands (Arkan, 2016). The medium-term sources of finances like debentures, preference shares, and medium-term loans and finances from banks and financial institutions facilitate the planning of sales, treasury management strategy, and capital management that supports MT investment (Jalbert, 2017). The risk-return proposition for medium-term investment is moderate with a stable risk tolerance level where it lays between low and medium risk with moderate price fluctuation tendencies. As mentioned by Linares-Mustaróset al. (2018), the medium-term investments are often misinterpreted to be either short-term or LT investment planning. The MT financial planning for a retail entity should focus upon expansion of business in terms of the number of outlets, expanding the existing product line either by investing in the existing industry or taking a high leap in some other industry where fashion is the primary product (Gabric, 2018).
Recommendation
It is recommended to the entity to explore its business opportunities having its more than 85000 products from ASOS's own collection and other 20 international brands associated with the entity. The global objective of the entity must be the future of fashion, today. Financially, the entity requires working upon its liquidity, investment, and capital gearing position to improve its current financial structure. The CSR policies can be improved by manufacturing clothes that support a green environment and green technology like organic cotton, linen, and Tencel than polyester and nylon (ChaluandLubawa, 2018). The financial strategies of the entity should support its medium-term investment plans to support a competitive advantage position.
Conclusion
Based on the above study of ASOS PLC financial performance of the accounting position and assessment of the overall retail sector in the UK is exceptional since 2015 where it is considered as one of the greatest contributors to the GDP. The MT financial planning should concern upon the improvement of financial position to dominate the industry. The budgetary and forecasting system has been defective for the business since 2015 that projected inaccurate predictions. The CSR position and compliance report depict the adoption of sustainable changes to be brought in to achieve a higher market capitalization position for itself.
?
Reference List
Annualreports.com 2015, All About Annual Report of ASOS PLC 2015, ASOS PLC financial performanceAvailable from http://www.annualreports.com/HostedData/AnnualReports/PDF/LSE_ASOS_2015.pdf [Accessed on 22nd June, 2020]
Annualreports.com 2016, All About Annual Report of ASOS PLC 2016, Available from http://www.annualreports.com/HostedData/AnnualReports/PDF/LSE_ASOS_2016.pdf [Accessed on 22nd June, 2020]
Annualreports.com 2017, All About Annual Report of ASOS PLC 2017, Available from http://www.annualreports.com/HostedData/AnnualReports/PDF/LSE_ASOS_2017.pdf [Accessed on 22nd June, 2020]
Annualreports.com 2018, All About Annual Report of ASOS PLC 2018, Available from http://www.annualreports.com/HostedData/AnnualReports/PDF/LSE_ASOS_2018.pdf [Accessed on 22nd June, 2020]
Annualreports.com 2019, All About Annual Report of ASOS PLC 2019, Available from http://www.annualreports.com/HostedData/AnnualReports/PDF/LSE_ASOS_2019.pdf [Accessed on 22nd June, 2020]
Arkan, T., 2016. The importance of financial ratios in predicting stock price trends: A case study in emerging markets. Finanse, RynkiFinansowe, Ubezpieczenia, (79), pp.13-26.
Asosplc.com, 2020, About US, Available from https://www.asosplc.com/ [Accessed on 22nd June, 2020] Asosplc.com, 2020, Corporate Social Responsibility, ASOS PLC financial performanceAvailable from https://www.asosplc.com/corporate-responsibility/our-business [Accessed on 22nd June, 2020]
Carreras-Simó, M. and Coenders, G., 2019.Principal component analysis of financial statements.A compositional approach.Revista de MétodosCuantitativospara la Economía y la Empresa, 29.
Chalu, H. and Lubawa, G., 2018. Using financial statements to analyze the effects of multiple Borrowings on SMEs financial performance in Tanzania. Inter. J. Res. Methodol. Soc. Sci, 1(4), pp.87-107.
Easton, M. and Sommers, Z., 2018.Financial Statement Analysis & Valuation, 5e.
Gabric, D., 2018. Determination of Accounting Manipulations in the Financial Statements Using Accrual Based Investment Ratios. Economic Review: Journal of Economics and Business, 16(1), pp.71-81.
Gartenberg, C., Prat, A. and Serafeim, G., 2019. Corporate purpose and financial performance.Organization Science, 30(1), pp.1-18.
Hasan, I., Kobeissi, N., Liu, L. and Wang, H., 2018. Corporate social responsibility and firm financial performance: The mediating role of productivity. Journal of Business Ethics, 149(3), pp.671-688.
Ionici, O. and Adhikari, A., 2017. An Integrated Approach to Teaching Financial Statements Analysis Using Bloomberg and Thomson Reuters.ASOS PLC financial performanceNortheastern Association of Business, Economics and Technology, p.171.
Jalbert, T., 2017.A Model for Forecasting Small Business Financial Statements and Firm Performance.Business Education & Accreditation, 9(2), pp.61-84.
Kim, K.H., Kim, M. and Qian, C., 2018. Effects of corporate social responsibility on corporate financial performance: A competitive-action perspective. Journal of Management, 44(3), pp.1097-1118.
Linares-Mustarós, S., Coenders, G. and Vives-Mestres, M., 2018.Financial performance and distress profiles.From classification according to financial ratios to compositional classification. Advances in Accounting, 40, pp.1-10.
Miroshnychenko, I., Barontini, R. and Testa, F., 2017. Green practices and financial performance: A global outlook. Journal of Cleaner Production, 147, pp.340-351.
Nollet, J., Filis, G. and Mitrokostas, E., 2016. Corporate social responsibility and financial performance: A non-linear and disaggregated approach. Economic Modelling, 52, pp.400-407.
Paniagua, J., Rivelles, R. and Sapena, J., 2018. Corporate governance and financial performance: The role of ownership and board structure. Journal of Business Research, 89, pp.229-234.
Qiu, Y., Shaukat, A. and Tharyan, R., 2016. Environmental and social disclosures: Link with corporate financial performance. The British Accounting Review, 48(1), pp.102-116.
Reguera-Alvarado, N., de Fuentes, P. and Laffarga, J., 2017. Does board gender diversity influence financial performance? Evidence from Spain.Journal of Business Ethics, 141(2), pp.337-350.
Shaikh, S., 2020.MCQ Ratio Analysis of Financial Statements.
Wen, H. and Zhu, T., 2019.ASOS PLC financial performanceInterpretation of Financial Statements.


