
Finance Assignment: Credit Analysis of Smurfit Kappa
Question
Task:
Asset Valuation Description : A 500 word report Perform a credit analysis of the company you were allocated for you (see attached excel spreadsheet), by using appropriate techniques.
• You are expected to employ quantitative (e.g. ratio analysis, Z-score etc) as well qualitative data (e.g. Character, Industry/company outlook etc) in your analysis.
• In your report you have to give an overall estimate on the company's ability to pay its obligations over the next two and six years. You are also required to identify the main sources of risk and to explain how these could potentially lead to a default. The report must contain accurate referencing/sourcing.
Answer
Introduction
Smurfit Kappa is a leading Europe corrugated packaging business and among the major paper-based company in the world. The company was established in 1934 by Jefferson Smurfit in Dublin. The organization is listed in the London stock exchange (Smurfitkappa.com. 2020).The study is conducted on the credit analysis of this company divided into qualitative and quantitative analysis. The quantitative analysis includes an examination of the financial position of the business using financial ratios and Z-score analysis.
Discussion
Capacity
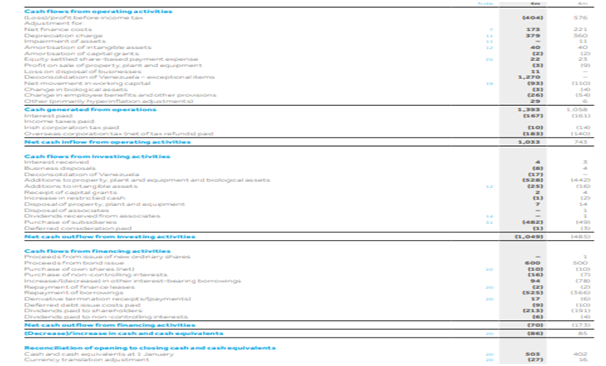
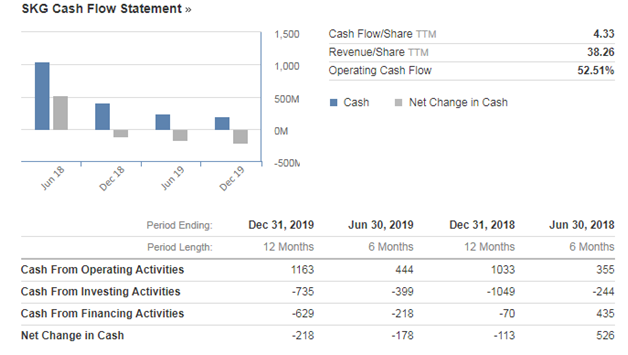
If the company borrows from other institutions, it must make sure that it has adequate capacity to pay off the loans. The repayment capacity of the business can be ascertained by analyzing the cash flow statement.In the context of Smurfit Kappa, the capacity of the business is understood with the help of the cash flow statement of the organization (refer to appendix). The cash flow generation of the company was €494 million in 2018, €303 million in 2017, and similar amounts with the previous years; therefore the company will have a good payment capacity in the next six years of its operations if the revenue is increased. It can be expected that in the coming 2 to 6 years the cash flow will go beyond €800 million. It means capacity will be increased more than 30%. Hence, no such risk will be associated with respect to the capacity of the firm. The predictions in the appendix shows in the coming 2 to 6 years the amount of debt capital will not be increased much. However, the capital structure will include more debt capital than equity capital, which will impose the risk on the capital structure of the firm. It is predicted that in 2022, the debt to equity ratio will be 1.59, which means the capital structure will be at major risk and the company will include risk in the long-run also.
Covenants
The financial as well as the economic condition of the business is important to know the rules and terms that the company follows. The Z-score analysis in the appendix has indicated the fact that in last few years the management failed to incorporate better condition and terms that could have reduced the level of risk in terms of bankruptcy. The predicted Z-Score of the company indicates that in the coming 6 years the company will not be able to enhance the score above 1.8. This prediction indicates the risk of bankruptcy for the company. The prediction has also indicated that the score will go down from 2021 to 2025, which is a matter of risk for the company.
Character
There have been many improvements in the company since 2016 to 2019. The OCC Prices remained at a higher level, the profitability had increased to certain extents, excluding the year 2018 in which it had suffered loss. The corporation had developed its business in Serbia and Greece with active participation and the company acquired many smaller companies. Therefore, it is evident that the firm is trying to adopt rigorous policies and improve its reputation in the international market (Smurfitkappa.com. 2020). However, it is possible that the company can build a stronger image for itself in the next 2-6 years. The company plans to enter markets by creating sustainable paper qualities that will create a good scope for the business in the foreign markets, if it maintains its asset utilization ratio (refer to appendix).
Collateral
By analyzing the Asset Utilization Ratio, it can be ascertained that the company has a stable ratio of 0.95 which means that the company has not acquired any new asset for further expansion of the business. However, it is necessary for the company to acquire new assets in two to six years time so that the expansion plans can be fulfilled. The loans possessed by the company must be paid off in time so that the obligations do not arise. If the loans are not cleared, the company may have chances of bankruptcy in the next six years (Wen and Zhu, 2019).
Conclusion
The company has a stable financial position according to the ratios explained in the above sections. The profitability, as well as the liquidity for the last six years, shows that the business has survived, and there is still some scope for improvement. However, the Z-score depicts a different analysis of the firm. It is important for the company to gain more assets and use strategies to understand the credit-worthiness needs of the business.
Reference list
Smurfitkappa.com. 2020. [online] Available at: https://www.smurfitkappa.com/us/investors/-/media/files/smurfit-digital-marketing-platform/investor-presentations-and-press-releases/2019/skg_h1_2019_presentation.pdf [Accessed 18 Feb. 2020].
Smurfitkappa.com. 2020. Smurfit Kappa - Paper | Packaging | Solutions. [online] Available at: https://www.smurfitkappa.com/ [Accessed 18 Feb. 2020].
Wen, H. and Zhu, T., 2019.Interpretation of Financial Statements.
Appendix
|
Liquidity ratios |
2019 |
2018 |
2017 |
2016 |
2015 |
2014 |
|
Current ratio |
1.21 |
1.39 |
1.17 |
1.42 |
1.36 |
1.51 |
Table 1: Liquidity Ratio of Smurfit Kappa 2014-2019
|
Liquidity Ratio |
2021 |
2022 |
2023 |
2024 |
2025 |
2026 |
|
Current Ratio |
1.23 |
1.13 |
1.21 |
1.35 |
1.35 |
1.41 |
Table 2: Liquidity Ratio of Smurfit Kappa 2020-2025
Gearing Ratio
|
Gearing ratios: |
2019 |
2018 |
2017 |
2016 |
2015 |
2014 |
|
Debt to assets ratio |
0.48 |
0.47 |
0.42 |
0.50 |
0.51 |
0.51 |
|
Debt to equity ratio |
1.58 |
1.55 |
1.44 |
1.78 |
1.87 |
1.77 |
Table 3: Gearing Ratio of Smurfit Kappa 2014-2019
|
Gearing Ratio |
2021 |
2022 |
2023 |
2024 |
2025 |
2026 |
|
Debt to assets ratio |
0.19 |
0.49 |
0.45 |
0.46 |
0.41 |
0.41 |
|
Debt to equity ratio |
0.63 |
1.59 |
1.51 |
1.64 |
1.71 |
1.61 |
Table 4: Gearing Ratio of Smurfit Kappa 2020-2025
Asset Utilization Ratio
|
Assets utilization ratios: |
2019 |
2018 |
2017 |
2016 |
2015 |
2014 |
|
Total assets turnover ratio |
0.91 |
0.94 |
0.95 |
0.92 |
0.95 |
0.95 |
|
Inventory turnover ratio |
7.38 |
7.07 |
7.17 |
7.30 |
7.73 |
8.13 |
Table 5: Asset Utilization Ratio of Smurfit Kappa
|
Asset Utilization Ratio |
2021 |
2022 |
2023 |
2024 |
2025 |
2026 |
|
Total assets turnover ratio |
0.92 |
0.92 |
0.83 |
0.84 |
0.76 |
0.78 |
|
Inventory turnover ratio |
7.29 |
7.74 |
8.15 |
6.73 |
7.32 |
7.29 |
Table 6: Asset Utilization Ratio of Smurfit Kappa for 2020-2025
Z-score Analysis
|
Z-SCORE |
||||||
|
year |
2019 |
2018 |
2017 |
2016 |
2015 |
2014 |
|
A= working capital/total assets |
0.05 |
0.09 |
0.05 |
0.09 |
0.08 |
0.11 |
|
B=retained earnings/total assets |
0.06 |
0.04 |
0.13 |
0.10 |
0.07 |
0.03 |
|
C=earnings before interest & taxes/total assets |
0.07 |
-0.04 |
0.06 |
0.07 |
0.07 |
0.04 |
|
D=market value of equity/total assets |
0.30 |
0.30 |
0.30 |
0.28 |
0.27 |
0.29 |
|
E=sales/total assets |
0.91 |
0.94 |
0.95 |
0.92 |
0.95 |
0.95 |
|
z-score(1.2A+1.4B+3.3C+0.6D+1E) |
1.46 |
1.15 |
1.58 |
1.58 |
1.54 |
1.44 |
Table 7: Z-Score Analysis of Smurfit Kappa for 2014-2019
Z-SCORE
|
Z-SCORE |
||||||
|
year |
2021 |
2022 |
2023 |
2024 |
2025 |
2026 |
|
A= working capital/total assets |
0.05 |
0.03 |
0.04 |
0.06 |
0.06 |
0.07 |
|
B=retained earnings/total assets |
0.07 |
0.07 |
0.11 |
0.08 |
0.11 |
0.08 |
|
C=earnings before interest & taxes/total assets |
0.07 |
0.05 |
0.05 |
0.06 |
0.02 |
0.03 |
|
D=market value of equity/total assets |
0.30 |
0.31 |
0.30 |
0.28 |
0.24 |
0.25 |
|
E=sales/total assets |
0.92 |
0.92 |
0.83 |
0.84 |
0.76 |
0.78 |
|
Zscore(1.2A+1.4B+3.3C+0.6D+1E) |
1.48 |
1.41 |
1.39 |
1.38 |
1.19 |
1.21 |
Table 8: Z-Score Analysis of Smurfit Kappa for 2020-2025


