
Finance Assignment Solving Managerial Financing Scenarios Of Businesses
Question
Task:
The finance assignment requires you to solve the following questions:
Question 1
The scenario
Mars Holdings Plc has a portfolio of investments in subsidiary companies and is seeking another acquisition that complements the others.
The subsidiary companies already in the group include: machinery and commercial vehicle dealership; finance company; equipment leasing company; haulage company with a fleet of 200 heavy goods vehicles (HGV), and a chain of value hotels across the UK, one of which is making a loss.
Two possible acquisition targets have been identified:
Wyre Child Ltd is based in leased converted hotels and provides care services for young people unable to be cared for in the foster system. Mars Holdings Plcare looking into the possibility of converting their failing hotel into a provider of care services and Wyre Child Ltd is looking for another property to continue expanding around the UK;
Border Commercials Ltd has a large unit and caters for the storage and repair of up to 60 commercial vehicles at one time, and has the potential for more space as it is based in a large empty industrial area. Border Commercials is looking for a contract with a fleet operator to stabilise their income and growth.
Extracts from the financial statements of both target companies are shown below:
|
Statements of Profit or Loss (SoPL) |
||||||
|
WYRE CHILD SERVICES Ltd |
BORDER COMMERCIALS Ltd |
|||||
|
|
vertical analysis |
£ |
vertical analysis |
|||
|
Turnover |
1,542,280 |
100% |
1,258,950 |
100% |
||
|
|
|
|
|
|||
|
Cost of sales |
(783,796) |
50.82% |
(375,852) |
29.85% |
||
|
__________ |
|
__________ |
|
|||
|
Gross profit |
758,484 |
49.18% |
883,098 |
70.15% |
||
|
|
|
|
|
|||
|
Administrative expenses |
(367,548) |
23.83% |
(419,765) |
33.34% |
||
|
Other operating income |
9,015 |
0.58% |
0 |
0.00% |
||
|
__________ |
|
__________ |
|
|||
|
Operating profit |
399,951 |
25.93% |
463,333 |
36.80% |
||
|
|
|
|
|
|||
|
Other interest receivable and similar income |
1,204 |
0.08% |
1,508 |
0.12% |
||
|
Interest payable and similar charges |
0 |
0.00% |
(38,505) |
3.06% |
||
|
__________ |
|
__________ |
|
|||
|
Profit on ordinary activities before taxation |
401,155 |
26.01% |
426,336 |
33.86% |
||
|
|
|
|
|
|||
|
Tax on profit on ordinary activities |
(39,405) |
2.55% |
(63,223) |
5.02% |
||
|
__________ |
|
__________ |
|
|||
|
Profit for the year |
361,750 |
23.46% |
363,114 |
28.84% |
||
|
__________ |
|
__________ |
|
|||
|
Statements of Financial Position (SoFP) |
||||||
|
WYRE CHILD SERVICES Ltd |
BORDER COMMERCIALS Ltd |
|||||
|
£ |
vertical analysis |
£ |
vertical analysis |
|||
|
Fixed assets |
|
|
|
|
||
|
Tangible assets |
4,656 |
1.1% |
291,546 |
30.9% |
||
|
|
|
|
|
|||
|
Total Non-Current Assets |
4,656 |
1.1% |
|
291,546 |
30.9% |
|
|
Current assets |
|
|
|
|
||
|
Trade receivables |
78,175 |
18.5% |
285,275 |
30.3% |
||
|
Cash at bank and in hand |
338,855 |
80.4% |
366,160 |
38.8% |
||
|
|
|
|
|
|||
|
Total Current Assets |
417,030 |
98.9% |
|
651,435 |
69.1% |
|
|
|
|
|
|
|||
|
Total Assets |
421,686 |
100.0% |
|
942,981 |
100.0% |
|
|
|
|
|
|
|||
|
Liabilities |
|
|
|
|
||
|
Current liability: Trade payables |
207,224 |
49.1% |
122,944 |
13.0% |
||
|
Non-current liability: Bank borrowing |
0 |
0.0% |
371,335 |
39.4% |
||
|
|
|
|
|
|||
|
Total Liabilities |
207,224 |
49.1% |
|
494,279 |
52.4% |
|
|
|
|
|
|
|||
|
Equity and reserves |
|
|
|
|
||
|
Called up share capital |
2 |
0.0% |
2 |
0.0% |
||
|
Profit and loss account |
214,460 |
50.9% |
448,700 |
47.6% |
||
|
|
|
|
|
|||
|
Total Equity |
214,462 |
50.9% |
|
448,702 |
47.6% |
|
|
|
|
|
|
|||
|
Total Equity and Liabilities |
421,686 |
100.0% |
|
942,981 |
100.0% |
|
|
Ratios |
Formulae |
|
WYRE CHILD SERVICES Ltd |
BORDER COMMERCIALS Ltd |
|
Profitability Ratios |
|
|
|
|
|
ROCE |
PBIT |
% |
95% |
|
|
|
Cap Employed |
|
|
|
|
|
|
|||
|
Return on Assets |
PBIT |
% |
95% |
|
|
|
Total Assets |
|
|
|
|
|
|
|||
|
Asset Turnover |
Revenue |
x |
3.7 |
|
|
|
Total Assets |
|
|
|
|
|
|
|||
|
Gross Profit Margin |
Gross profit |
% |
49.2% |
|
|
|
Revenue |
|
|
|
|
|
|
|||
|
Net Profit Margin |
PBIT |
% |
26% |
|
|
|
Revenue |
|
|
|
|
Efficiency Ratios |
|
|
|
|
|
Receivables Collection period (R) |
Trade receivables x 365 |
days |
19 |
|
|
|
Sales |
|
|
|
|
|
|
|||
|
Payables payment period (P) |
Trade payables x 365 |
days |
97 |
|
|
|
Cost of sales |
|
|
|
|
|
|
|||
|
Cash Cycle |
R – P |
days |
-78 |
|
|
|
|
|
|
|
|
Liquidity Ratios |
|
|
|
|
|
Current Ratio |
Current Assets |
x:1 |
2.0 |
|
|
|
Current liabilities |
|
|
|
|
Financial Risk or GEARING Ratios |
|
|
|
|
|
Gearing |
Fixed int capital |
% |
0.0% |
|
|
|
Total capital employed |
|
|
|
|
|
|
|||
|
Interest cover ratio |
PBIT |
x |
0.0 |
|
|
|
Interest charges |
|
|
|
Requirements
1.1 Prepare a business report, maximum 2 pages long (approximately 800 words) with an appendix for your ratio analysis.
It is to be addressed to the board of directors of Mars Holdings Plc.
You must evaluate the financial statements, interpret the ratio analysis and make a convincing argument for investment in one of the two target companies.
Your report should be supported with academic references throughout, and your ratio analysis should be put in an appendix to the report.
1.2 Critically evaluate the working capital management (WCM) of both companies using academic references and draw conclusions on which is stronger.
1.3 Create a table that lists the advantages and disadvantages of all the finance options available to Mars Holdings Plc. Explain, with references, the source of finance you recommend as most suitable way to finance the investment in either Wyre Chid services Ltd or Border Commercial Ltd.
Question 2
You work for a consulting firm that has been approached by a client who is concerned about the future of their business. The board of directors of AJ Supplies Ltd are considering halting the production of 2 of their products that appear to be making no profit.
As you can see from the table below the directors are considering closing products Bass and Clarinet in an effort to improve overall profitability.
You spot that management accounting would show the results differently and may affect the directors’ decision.
|
|
|
Acoustic |
Bass |
Clarinet |
Total |
||
|
|
(£m) |
(£m) |
(£m) |
(£m) |
|||
|
Sales |
360 |
240 |
180 |
780 |
|||
|
|
|
||||||
|
Cost of sales |
|
||||||
|
|
Materials |
(120) |
(80) |
(80) |
(280) |
||
|
|
Labour |
(120) |
(120) |
(120) |
(360) |
||
|
|
Overheads |
(60) |
(60) |
(60) |
(180) |
||
|
Profit/(loss) |
60 |
(20) |
(80) |
(40) |
|||
Requirements for Question 2 part (a)
i. Use your knowledge of management accounting to calculate the contribution of each product
ii. Use your findings from part (a) and appropriate academic references to explain whether the company should stop making product Bass.
iii. Use your findings from part (a) and appropriate academic references to explain whether the company should stop making product Clarinet.
iv. Discuss how and why marginal costing calculates contribution to pay overheads and why this is useful in evaluating product value to a firm?
v. Do you agree that profitability will improve by ceasing to make Products Bass and Clarinet What do you suggest the company does to increase profitability
Question 2 (continued)
The board have approached you to get your opinion of their expansion plan, which includes a chain of factory outlet stores. Below are the figures for the first one that is planned for a central Birmingham location next year.
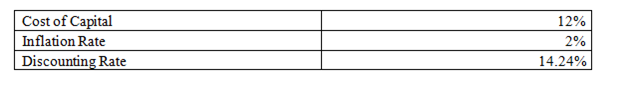
Company policy dictates that any decision should be based on the results of calculating Net Present Value (NPV) of 3 years cash flows using a cost of capital of 12%, Payback Period (PBP) must be less than 3 years, and the Internal Rate of Return (IRR) of the project should provide a 5% cushion in case of increases in inflation or interest rates.
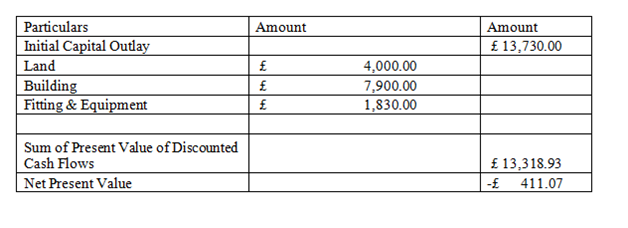
The investment consists of £4,000 for the land, building costs of £7,900, and £1,830 for fittings and equipment.
The cash flows in year 1 are expected to be: total sales revenue £28,600; the cost of Acoustic products sold £7,900; Bass stock sold £5,660; staff costs £1,180; light & heat £1,676; other overheads £6,424. The cash flows for the following years are the same, but are expected to increase by 2% inflation each year.
Requirements for Question 2 part (b)
Using the information above and in accord with the above stated company policy you are required to calculate:
i. Net Present Value (NPV)
ii. Payback period (PBP) and Discounted Payback Period (DPBP)
iii. Internal Rate of Return
iv. Based on your calculations do you recommend the investment is made and the new outlet store is built
v. Critically discuss the limitations of the above project appraisal techniques used and any other recommendations to the board.
Question 3
The budgeted statement of Comprehensive Income and Net Assets for GFX Industries are given below:
Budgeted Statement of Comprehensive Income
|
|
£ |
£ |
|
Sales (25,000 boxes containing standard packets) |
|
900,000 |
|
|
|
|
|
Direct Materials |
(350,000) |
|
|
Direct Labour |
(160,000) |
|
|
Variable Overhead |
(120,000) |
|
|
Fixed Overhead |
(140,000) |
|
|
|
|
(777,000) |
|
Profit |
|
130,000 |
Budgeted Net Assets as at 31st December 2021
|
|
£ |
£ |
|
Non-Current Assets at net book value |
|
375,000 |
|
|
|
|
|
Working Capital |
|
|
|
Receivables |
80,000 |
|
|
Inventory |
110,000 |
|
|
Payables |
(50,000) |
|
|
|
|
140,000 |
|
Net Assets Employed |
|
515,000 |
The current manufacturing facility is under-utilised and there is a proposal to extend sales to a supermarket chain with nationwide stores. However, the supermarket will sell the product under its own brand name.
Estimated effects of the proposal are;
i. Additional annual supermarket sales of 10,000 boxes at £30 per box.
ii. Cost of direct materials would be reduced as a result of 8% quantity discount on all purchases and variable costs are expected to increase by 2%.
iii. Extra supervisory and administrative staff will be required at a cost of £20,000 per annum
iv. Market research has indicated that sales to existing retail outlets would fall by 10%. There will be no change in selling price to these customers.
v. Inventory and payables would increase by £40,000 and £25,000 respectively and the credit period extended to supermarket will be twice that allowed to existing customers.
Required:
Prepare the revised budgets to evaluate this proposal. Specifically, you should:
a) Prepare a revised budgeted statement of comprehensive income and a statement of net assets employed incorporating the results of the proposal i.e. Revised Sales Budget, Raw Material, Direct Labour, Variable Costs and workings.
b) Calculate the effect on profit of the changes resulting from the proposal. Specifically calculate the Per Unit and Total Contribution for the old budget and the new budget.
c) Advise management on the suitability of the proposal making any further calculations you consider necessary and adding any comments or reservations you think relevant.
Answer
Finance AssignmentQuestion 1
Answer 1.1
Introduction
In the present case study, Mars Holdings Plc. is looking for acquisition of another company such as Wyre Child Ltd and Border Commercial Ltd. In this aspect, it is required to give suggestion to board of directors of Mars Holding Plc. for making investment in one out of the two target companies. The suggestions provided to directors would be based on ratio analysis tool, which evaluates company’s profitability, liquidity, efficiency, and gearing aspects.
Body and analysis
In the given case scenario, it has been seen that, target company would be selected on ratio analysis technique, which is one of the most important for evaluating the financial performance of the company. In this aspect, financial performance of both companies are evaluated in the context of its profitability that mainly shows company’s earnings, liquidity position, efficiency of operations, and capital structure.
The profitability analysis is conducted by computation of ROCE, ROA, Asset turnover, gross profit and net profit ratio. In this, return on capital employed, asset turnover as well as return on asset ratio of Wyre Child Service Ltd are more than as compared to Boarder Commercial Ltd. It reflects that, former company is generating profit and revenue by utilizing in assets more effective as compared to later company. However, by going through gross profit margin and net profit margin ratio, performance of Border Commercial Ltd is better than Wyre Child services. The reason behind such increment in gross profit and net profit is lesser cost of sales incurred by border Commercial Ltd.
Further, efficiency aspect of the company is evaluated by computation of receivables collection period, payable payment period and cash cycle. It has been seen that, Boarder Commercial is taking almost 83 days for collection of amount from its debtors, while Wyre Company is taking only 19 days for the same. Further, Boarder Company is making payment to its creditors in approximately 120 days, while Wyre Company is making payment in 97 days only. Further, cash conversion period reflects how fast company could convert cash on hand into even higher cash on hand. It has been seen that, Boarder Company required greater period for cash cycle as compared to Wyre Child service. In summarized way, it can be said that, Wyre Company is running its activities in more efficient manner as compared to Boarder Commercial. Further, liquidity position of the companies is evaluated by calculation of current ratio that reflects about how well company is capable for making payment of its short term debt obligations (Setiany, 2021). It is essential that, organization should maintain optimum level of liquidity, not very much higher or lesser. In the given case, current ratio of Wyre Child Service is 2.01, while Border Commercial is 5.29, which reflects that later company is highly liquid. It can be said that, both companies would not face liquidity issues in the subsequent time period, as they are maintaining at least twice current assets as compared to current liabilities.
Further, gearing ratios or financial risk of the companies is evaluated through gearing ratio and interest coverage ratio (Purnomo, 2018). It has been seen that, there is not any financial risk in Wyre Child Service as company did not taken any loan from outside sources. On the other side, it has been seen that, In Border Commercial, company has taken loan from banks, and therefore it is geared and has some financial risk.
Recommendations
On the basis of above analysis, it is recommended to the board of directors of Mars Holdings Ltd, that it should acquire Wyre Child Service Ltd as compared to Border Commercial Ltd. The reason behind the same is that, Wyre Child Service Ltd, profitability of this company is greater as compared to Border Commercial Ltd that is reflected in ROA, ROC, and assets turnover ratio. Further, it is efficiently running is business activities that reflect by lesser receivable period and cash cycle. Further, it is also adequately maintaining its current ratio, while Border Commercial’s current ratio is very much higher that reflects company has blocked its significant working capital. Lastly, there is not any financial risk in the cited organization.
Conclusion
It is concluded that, ratio analysis shows company’s profitability, efficiency, liquidity, and gearing ratios and on the basis of this, performance of Wyre Child Service is better than Border Commercial Ltd. It is recommended to the directors of Mars Holding that, it should acquire Wyre Child Service because of better performance in relation to other company and avail several benefits of acquisition. Although, ratio analysis is vital method for evaluating financial measures but directors should consider non-financial measures as well before acquisition of any company (Nastiti, Atahau, and Supramono, 2019).
Answer 1.2
Discussion of working capital management of both companies
Working capital management needs observation of assets and liabilities of company for maintenance of adequate cash flows to satisfy its short term operating expenses and debt obligations of short term period (Akbar, Jiang, and Akbar, 2020). It is evaluated by considering the current ratio of companies that consider company’s current assets and current liabilities. By going through this ratio, it has been seen that, Wyre Company’s current ratio is 2.01, while Border Commercial Service’s ratio is 5.29. Usually, optimum current ratio is 2:1, which shows that company should maintain twice amount of current assets as compared to the current liabilities. In case of Wyre Company, it is adequate managing its working capital and it is utilizing its financial resources in most productive and effective manner. On the other side, Border Company’s higher liquidity ratio indicates that company is not using its current assets or financing facilities for short term period in effective manner. Over emphasis on liquidity detrimental to the business expansion as well as utilization of capital effectively (Boisjoly, ConineJr, and McDonald, 2020). Therefore, it can be concluded that, working capital management of Wyre Company is stronger as compared to the Border Commercial.
Answer 1.3
Company can finance the investment by internal sources of finance and external sources of finance. Internal sources of finance are explained as money that generated from within company, while external sources of finance are money that generated from external parties. Advantages and disadvantages of internal and external sources of finance is as follows –
Table 1 Computation of contribution
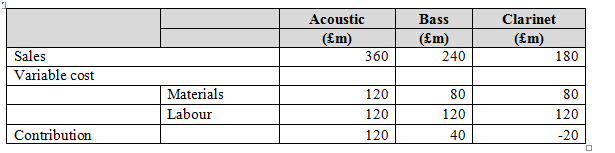
Part ii)
On the basis of above calculation, it can be said that, company should not stop making Bass as it provides contribution of Pound 40million, for covering fixed cost and generation of profit.
Part iii)
The above computation reflects that, company should stop production of Clarinet as there is negative contribution of Pound 20million, which reflects that company is not able to cover even its variable costs.
Part iv)
Contribution analysis is very important for analyzing product value to a firm as it shows the manner in which direct expense and variable expenses of goods create impact on net profitability of the company (Berry, Gaynor, and Scott Morton, 2019). Further, it provides support to the organization in analyzing the manner in which individual business line or goods are performing through comparison of contribution margin. Apart from this, contribution also helps in ascertainment the lowest probable price at which goods and services must be charged, and fixed cost can be covered (Hague, 2018).
Part v)
Profitability would enhance by ceasing the production of Bass and Clarinet as its contribution is negative. In order to increase profitability, it is recommended that, company should only produce Acoustice product as it is generating positive contribution.
Answer 2(b)
Part i)
Table 2Statement Showing Discounted Cash Flows
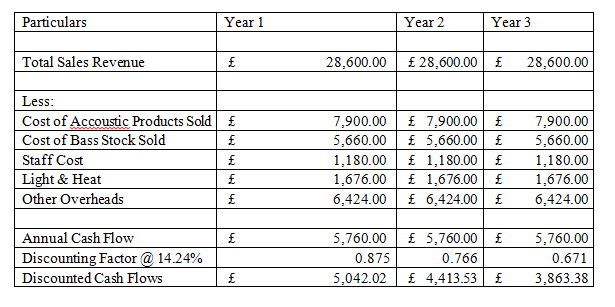
Table 4 Working note for discounting rate
Computation of NPV
Table 5Statement Showing Net Present Value
Part ii)
Computation of payback period and discounted payback period –
Table 6Statement Showing Payback Period
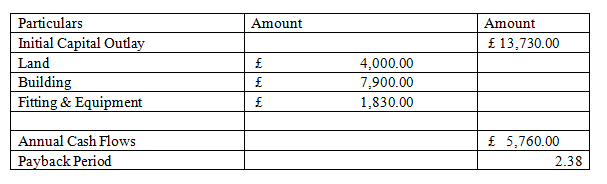
Recommendations
It is recommended that, investment should not be made and new outlet store is not built because its net present value is negative.
Part v)
Discussions of the limitations of above project appraisal techniques and recommendations –
Limitations of NPV: This method needs some guesswork with respect to the cost of capital of the company. If cost of capital is assumed that is very low, then it assists towards making suboptimal investments, while if it is higher, then it assists forgoing numerous good investments (Mishan, and Quah, 2020).
Limitations of payback period: This method ignores present value concept. Further, cash flows generated subsequent to the payback period is also not considered. Apart from this, profitability of project and return on investment of project is also ignored in this method (Siziba, and Hall, 2021).
Limitations of discounted payback period: This method fails to ascertain whether or not the value of firm would enhance by investment. It does not take into account the investment that could last greater than payback period (Weersink, and Fulton, 2020). Further, computation beyond the DPPP is ignored by it.
Limitations of IRR: This method does not consider the overall size and scope of the project for comparison purpose. Further, future cost within the calculations is ignored in this method. Moreover, the cited method assumes that profits are reinvested at IRR for the lasting life of the project. If the ARR generated by company is not proximate to the IRR, then earnings of the investment would not be reasonable.
All above techniques are mainly in quantitative in nature, and therefore it is essential that directors of company should consider some qualitative elements of investment as well. Apart from this, company should perform sensitivity analysis for prediction of outcome of a decision in case circumstances move in distinct direction in comparison with key predictions (Alles et al. 2021).
Question 3
Part a)
In the given case scenario, current production facility of the company named as GFX industries is not utilized fully and there is proposal to increase sales to a supermarket chain with all over world.
Revised budget statement–
Table 8Revised Budget Statement of Comprehensive Income for the year ended 31 December 2021
|
Particulars |
Amount |
|
Sales (22500 Boxes containing standard Packets) |
£ 810,000.00 |
|
Additional Annual Super Market Sales |
£ 300,000.00 |
|
Total Sales |
£ 1,110,000.00 |
|
|
|
|
Variable Costs |
|
|
Direct Material |
£ 450,800.00 |
|
Direct Labor |
£ 224,000.00 |
|
Variable Overheads |
£ 171,360.00 |
|
Total Variable Costs |
£ 846,160.00 |
|
|
|
|
Contribution |
£ 263,840.00 |
|
Fixed Cost |
£ 140,000.00 |
|
Extra Supervisory and Administrative Staff |
£ 20,000.00 |
|
Profit |
£ 103,840.00 |
Working:
1. In the given case, for preparation of revised budget, sales would be reduced by 10%, and selling price would not be changed. therefore, revised sales amount would be –
900000/25000*22500 = 810000
2. In the revised budget statement, there would be additional supermarket sales of 10000 units at a price of 30 per units.
3. Direct material cost would be reduced by 8%.
4. Variable overhead is increased by 2%.
5. Additional supervisory and administrative employee would be required by which fixed cost would increase by 20000 per year in revised budget statement.
By going through revised budget of income statement it has been seen that, profitability of company is 103840, while original income statement reflects about profit of 130000. Therefore, it can be said that, in spite of additional sale of 10000 units at supermarket, profitability would be reduced. The reason behind the same is that, direct cost, variable cost, and fixed cost in higher in revised budget statement.
Table 9Budgeted Net Assets as on 31st December 2021
|
Particulars |
Amount |
|
Non-Current Assets at Net Book Value |
£ 375,000.00 |
|
|
|
|
Working Capital |
|
|
Receivables |
£ 125,333.33 |
|
Inventory |
£ 150,000.00 |
|
Payables |
-£ 75,000.00 |
|
Working Capital |
£ 200,333.33 |
|
|
|
|
Net Assets Employees |
£ 575,333.33 |
Table 10 Working
|
Working |
|
|
Receivables |
80000 |
|
Total Sales |
900000 |
|
Debtor Turnover Ratio = Total turnover/average receivables |
11.25 |
|
Debtor Days = 365/ Debtor turnover ratio |
32.44 |
|
Revised Sales to Existing Retail Outlets |
£ 810,000.00 |
|
Debtors of Sales to Existing Outlets |
£ 72,000.00 |
|
|
|
|
Annual Sales to Super Market |
£ 300,000.00 |
|
Debtor Days |
64.89 |
|
Debtor of Annual Supermarket Sales |
£ 53,333.33 |
|
|
|
|
Total Debtors |
£ 125,333.33 |
Part b)
The impact on net income would be evaluated by comparison of original and revised budget. Due to the revised proposal, the company’s net incomewould definitely change in comparison to original statement.
Computation of impact on net profit of the changes due to proposal
Table 11Statement Showing per Unit and Total Contribution and Change in Profit
|
Particulars |
Original Budget |
Revised Budget |
% Change in Profit |
|
Total Sales |
£ 900,000.00 |
£ 1,110,000.00 |
|
|
Total Variable Costs |
£ 630,000.00 |
£ 846,160.00 |
|
|
Contribution |
£ 270,000.00 |
£ 263,840.00 |
|
|
Units Sold |
25000 |
35000 |
|
|
Contribution per Unit |
£ 10.80 |
£ 7.54 |
|
|
|
|
|
|
|
Total Fixed Costs |
£ 140,000.00 |
£ 160,000.00 |
|
|
Profit |
£ 130,000.00 |
£ 103,840.00 |
-20.12% |
Part c)
Suggestions to management on the appropriateness of the proposal:
On the basis of above analysis, it is suggested that, revised budget would not be appropriate. The reason behind the same is that, profitability of company would be reduced by this proposal.it has been observed that, total sales in the revised budget increased but also profit is lesser as compared to the original budget. It is because of the enhancement in company’s variable cost, as well as fixed cost of additional supervisor. Therefore, the given proposal is not viable and should not be accepted by the organization.
References
Akbar, A., Jiang, X. and Akbar, M., 2020. Do working capital management practices influence investment and financing patterns of firms. Journal of Economic and Administrative Sciences.
Alles, L., Jayathilaka, R., Kumari, N., Malalathunga, T., Obeyesekera, H. and Sharmila, S., 2021. An investigation of the usage of capital budgeting techniques by small and medium enterprises. Quality & Quantity, 55(3), pp.993-1006.
Berry, S., Gaynor, M. and Scott Morton, F., 2019. Do increasing markups matter lessons from empirical industrial organization. Journal of Economic Perspectives, 33(3), pp.44-68.
Boisjoly, R.P., ConineJr, T.E. and McDonald IV, M.B., 2020. Working capital management: Financial and valuation impacts. Journal of Business Research, 108, pp.1-8.
Bonini, S., Capizzi, V. and Cumming, D., 2019.Emerging trends in entrepreneurial finance. Venture Capital, 21(2-3), pp.133-136.
Chit, M.M., 2019.Financial information credibility, legal environment, and SMEs’ access to finance. International Journal of the Economics of Business, 26(3), pp.329-354.
Farag, H. and Johan, S., 2021. How alternative finance informs central themes in corporate finance. Finance assignmentJournal of Corporate Finance, 67, p.101879.
Hague, D.C., 2018. Pricing in business.Routledge.
Mishan, E.J. and Quah, E., 2020. Cost-benefit analysis.Routledge.
Nastiti, P.K.Y., Atahau, A.D.R. and Supramono, S., 2019. Working capital management and its influence on profitability and sustainable growth. Business: Theory and Practice, 20, pp.61-68.
Purnomo, A., 2018. Influence of the ratio of profit margin, financial leverage ratio, current ratio, quick ratio against the conditions and financial distress. Indonesian Journal of Business, Accounting and Management, 1(1).
Setiany, E., 2021. The Effect of Investment, Free Cash Flow, Earnings Management, and Interest Coverage Ratio on Financial Distress. Journal of Social Science, 2(1), pp.67-73.
Shrotriya, D.V., 2019. Internal sources of finance for business organizations. International Journal of Research and Analytical Reviews, 6(2), pp.933-940.
Siziba, S. and Hall, J.H., 2021.The evolution of the application of capital budgeting techniques in enterprises. Global Finance Journal, 47, p.100504.
Weersink, A. and Fulton, M., 2020.Limits to profit maximization as a guide to behavior change. Applied Economic Perspectives and Policy, 42(1), pp.67-79.
Appendix
Table 12 Ratio analysis
|
Ratios |
Formulae |
|
WYRE CHILD SERVICES Ltd |
BORDER COMMERCIALS Ltd |
|
Profitability Ratios |
|
|
|
|
|
ROCE |
PBIT |
% |
186.6% |
49% |
|
|
Cap Employed |
|
|
|
|
|
|
|||
|
Return on Assets |
PBIT |
% |
95% |
49% |
|
|
Total Assets |
|
|
|
|
|
|
|||
|
Asset Turnover |
Revenue |
x |
3.7 |
1.3 |
|
|
Total Assets |
|
|
|
|
|
|
|||
|
Gross Profit Margin |
Gross profit |
% |
49.2% |
70.1% |
|
|
Revenue |
|
|
|
|
|
|
|||
|
Net Profit Margin |
PBIT |
% |
26% |
37% |
|
|
Revenue |
|
|
|
|
Efficiency Ratios |
|
|
|
|
|
Receivables Collection period (R) |
Trade receivables x 365 |
days |
19 |
83 |
|
|
Sales |
|
|
|
|
|
|
|||
|
Payables payment period (P) |
Trade payables x 365 |
days |
97 |
|
|
|
Cost of sales |
|
|
120 |
|
|
|
|||
|
Cash Cycle |
R - P |
days |
-78 |
-37 |
|
|
|
|
|
|
|
Liquidity Ratios |
|
|
|
|
|
Current Ratio |
Current Assets |
x:1 |
2.0 |
5.3 |
|
|
Current liabilities |
|
|
|
|
Financial Risk or GEARING Ratios |
|
|
|
|
|
Gearing |
Fixed int capital |
% |
0.0% |
|
|
|
Total capital employed |
|
|
0.0% |
|
|
|
|||
|
Interest cover ratio |
PBIT |
x |
0.0 |
|
|
|
Interest charges |
|
|
12.03 |


