Finance Case Study On Financial Analysis Of Energy Firms
Question
Task:
You are required to produce a management report entitled, “Financial Analysis of Energy firms” based on the evidence supplied in the Finance Case Study of Financial Analysis of Energy Firms: Amerada Hess Corporation, Mobil Corporation, Pennzoil Company and Unocal Corporation. Specifically you are required to conduct a financial analysis of the four firms based in the USA, using financial techniques such as trend analysis and financial ratio analysis, based on the Case Study of Financial Analysis of Energy Firms: Amerada Hess Corporation, Mobil Corporation, Pennzoil Company and Unocal Corporation and submit a professional report.
Answer
Executive Summary
The financial report goes through a comprehensive analysis of finance case study of 4 different energy companies – Amerada, Mobil, Pennzoil, and Unocal from 1995 to 1997. The report starts with a general analysis of the different financial statements to show the exact financial position it holds. Then the trend analysis show the changes that the energy companies has undergone in the scheduled period of 1995-97. Lastly, the financial ratio analysis delve into the financial insights of the company stating that Mobil Corporation has been able to manage its finances well while Amerada failed to control its costs leading to a sorry state of profitability. The remaining two organizations – Pennzoil and Unocal are trying its part to improve the finances by increasing the equities and reducing the organizational risk substantially.
Introduction
The report runs a discussion on the various aspects of financial implications to get the financial insights of the different energy firms – Amerada, Mobil, Pennzoil, and Unocal for the year 1995-97. The report runs the study by conducting a general analysis of the financial statements along with the trend analysis of the balance sheet and income statement of the energy firms. Lastly, the report would conduct financial ratio analysis on the companies for the year 1997 to assess the efficiency, liquidity, profitability, capital structure, and liquidity position citing apparent reason for such changes. The report is based on the following companies –
Amerada Hess Corporation was formed with the incorporation of several erstwhile companies though initially incorporated as Amerada Corp in 1920. In 1997, the NYSE-listed company has to its credit production of 595 million barrels of proved crude oil and natural gas reserves amounting to 1.935 trillion cubic feet. The exploration and production activities of Amerada are concentrated across the US, UK, Norway, and Gabon.
In 1997, Mobil Corporation earned the tag of a premier oil and petroleum organization on the global platform having 23 ocean tankers and 15,000 retail outlets. Most of its business up to 48% of the business is in the US producing 4.1 billion barrels of oil and 17 trillion cubic feet of natural gas. The company has also treaded into chemical operations and the management undertook a five-year goal in 1997 to deliver a higher return to the investors taking its stock price to $100 by 2001.
Pennzoil Company, the NYSE-listed oil company was formed in 1968 with the amalgamation of Pennzoil Co. and the United Gas Corp. to explore oil, gas reserves and sell motor oil through 1,500 outlets across the country. In November 1967, Pennzoil came across a hostile bid which was avoided and the organization vowed to bring its financials to the right track.
Unocal Corporation is a leading global resource and project development company exploring gas and oil reserves across the US, Asia, Mexico, and Latin America. The company is on a continuous spree to enhance its business activities by exploring efficient resource drilling projects across the world having 533 million barrels of oil and 6.55 trillion cubic feet gas.
General Financial Statement Analysis
Amerada Hess Corporation
The balance sheet of the company shows that it has marginally reduced its current assets from $2.42 billion in 1996 to $2.20 billion in 1997 as it has reduced its cash resources and inventories substantially. This is due to the company’s initiative to acquire new oilfields to enhance its production (Madura, 2020). The same is reflected in the 1997 figures of net plant, property, and equipment which raised from $4.9 billion in 1996 to $5.19 billion in 1997. So there has been no major change in the total assets position of Amerada. Again the long-term debts of the company increased from $120.53 million in 1995 to $209.74 million in 1996 and reduced to $106.43 million in 1997 raising the total liabilities from $4.40 billion in 1996 to $4.71 billion in 1997. Amerada is striving to strengthen its capital structure by increasing the equities from $2.66 billion in 1995 to $3.38 billion and $3.21 billion in 1996 and 1997 respectively.
The income statement of Amerada shows that its revenue increased from $7.30 billion in 1995 to $8.27 billion and $8.23 billion in 1996 and 1997 respectively. The costs also rises leaving the company with a lower gross profit in 1997 compared to the last years. 1997 also recorded higher sales and administrative expenses tending a lower operating income for $237.01 in 1997 against $521.92 million in 1996 and $280.49 million in 1995. But Amerada’s credit is in its ability to control the expenses like interest expenses and non-operating expenses in the current year. Nevertheless extracted a lower net profit worth $7.50 million in 1997 against $660.10 million in 1996 which was an improvement from the loss of $394.41 million in 1995.
The cash flow statement of Amerada shows that 1996 showed a unique stance as it was able to revive from the loss-making scenario in 1995 but could not maintain the position in 1997. Though the depreciation was in the same line with the previous year, the gains from sale of properties reduced substantially in 1997. The receivables increased in the current year but the inventories decreased having a net cash flow of $1.25 billion in 1997 against $807 million in 1996. The capital expenses increased substantially from $692.11 million in 1995 to $860.63 million in 1996 and ultimately, $1.34 billion in 1997. There were considerable financing activities in 1997 issuing debts and buying equities and the company has kept on declaring dividends throughout irrespective of its financial position to appease the investors (Fracassi, 2016).
Mobil Corporation
The company has tried to increase its cash resource in 1997 but reduced its receivables and inventories. The phenomenon affected its total asset position from $12 billion in 1995 to $12.89 billion in 1996 and ultimately, $9.72 billion in 1997. There are certain changes in the figures of net plant, property, and equipment as the figure dropped from $46.40 billion in 1996 to $43.55 billion in 1997. The current liabilities decreased in a gradual manner and so does the long-term debts of the company decreasing the organizational risk owing to its capital structure (Bolton, et al., 2019). It is astonishing to see that Mobil is striving to enhance its equity position to have a suitable capital structure.
The income statement for Mobil Corporation shows that though the revenue increased from $64.76 billion in 1995 to $71.12 billion in 1996 but reduced to $58.39 million in 1997. The company was also able to control the costs list cost of sales, administrative costs, and interest expenses to have a suitable net income at $3.22 billion in 1997 higher from the preceding years. Accordingly, the EPS of Mobil increased from $2.93 in 1995 to $3.69 in 1996 to $4.10 in 1997 adding delight to the investors (Warren & Jones, 2018).
The cash flow statement of Mobil Corporation shows that the cash inflow out of income has increased over the years. The organization undertook certain business decisions to sell off its assets and maintained a stability in market to acquire funds. The cash management of the company was managed efficiently to have a better cash inflow scenario in an increasing state (Bekaert & Hodrick, 2017). Mobil incurred capital expenses at a uniformed rate over the years though it has controlled its investment activities to bring down the cash outflows for maintaining liquidity. The financing activities of Mobil show that it has been instrumental in raising funds through preference stocks, equities, and long-term debts. It has also declared dividends regularly to the investors raising hopes for a better return.
Pennzoil Company
The balance sheet of Pennzoil Company increased from $23.61 million in 1995 to $34.38 million in 1996 but decreased to $18.59 million in 1997. The net receivables also decreased gradually but experienced an increasing level of inventory leading to gradual decrease of the current assets. The fixed assets are maintained uniformly reflecting stability of the total assets over the years (Shapiro & Hanouna, 2019). It is good to see that the organization is making effort to bring down the current liabilities to strengthen the liquidity position. Taking cue of its hostile bid, the company is striving to have a strong capital structure by increasing the equity capital and maintaining the long-term debts effectively.
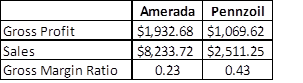
The sales position of Pennzoil is at a uniform state while it has been able to control the costs. It has been adequate for extracting a higher gross profit worth $1.06 billion in 1997 against $891.66 million and $796.24 million in 1996 and 1995 respectively. It seems that the company has been instrumental in controlling its expenses with time resulting in improving operating profit and net profit from losses incurred in 1995 (Vishny & Zingales, 2017). It translated to a better picture in the following years at $133.90 million in 1996 and $175.07 million in 1997 as Pennzoil strived to manage its business operations well.
The cash flow statement of Pennzoil Company shows that the situation is improving for the better with improving state of the cash inflows due to its operating activities. The business has undertaken certain measures like selling off fixed assets, enhancing its inventory position and debtors to improve the business scenario. The investing activities are at a uniformed state which is required to have the business back on track (Dang, et al., 2018). The financing activities show that Pennzoil has intentionally brought down the amount of cash dividends to retain the cash resources. Though it has huge debts, it is also trying to raise equities from the market to create a balance in its capital structure.
Unocal Corporation
The balance sheet of the company shows the organization has increased the cash resources extensively from $94 million in 1995 to $217 million and $338 million in 1996 and 1997 respectively. Simultaneously, it has reduced other kinds of assets to get an even current asset scenario but the fixed assets has reduced to an extent affecting the position of the total assets in the organization marginally. It is notable that Unocal Corporation is trying to reduce the possession of long-term debts from $3.69 billion in 1995 to $3.46 billion in 1996 and ultimately $2.69 billion in 1997 while maintaining stability of its equity position.
The income statement of Unocal Corporation show that its revenue has gradually decreased over the years but it has tried to lessen the costs maintaining evenness in its gross profitability. It is noteworthy to see that the declining sales proposition has been well managed by Unocal by decreasing its sorts of expenses (Maynard, 2017). It helped to have a better profitability from $224 million in 1995 to $581 million in 1997 and in 1996, it suffered a net loss of $36 million. This proposition helped to have a better EPS for the organization from $0.91 in 1995 to $1.54 in 1996 and ultimately $2.69 in 1997 yearning for a better financial future.
Unocal has been able to increase its cash inflows in 1997 enabling it to pay off the accounts payable efficiently. The investing activities has gained acceleration in the current year while the financing activities show an initiative in the purchase of common and preferred equities (Atanasov & Black, 2016). The firm is gradually reducing its debt weightage by settling long-term debts and less funding through the route to strengthen its capital structure.
Trend Analysis
Amerada Hess Corporation
The common size balance sheet shows greater relevance of fixed assets in its asset position while the current assets constituted 1/4th of the portfolio to uphold the organizational liquidity. The trend shows that the current liabilities was maintained at around 20% and the overall liabilities were brought down to 59.47% in 1997 compared to 65.70% in 1995. It shows a growing relevance of the equities in the organization from 34.30% in 1995 to 40.53% in 1997 for reshaping the capital structure (Bazdresch, et al., 2018).
The common size income statement shows that 3/4th of the sales constitute the costs leaving behind 25% profit approximately wherein a substantial part is taken by the administrative costs and depreciation expenses. The trend shows that the costs are huge leaving miniscule profitability to the firm.
Mobil Corporation
The trend shows that the firm has maintained sufficient receivables and inventories to be encased at the right time and uphold its liquidity. The fixed assets constitute a greater portion while the liabilities occupy around 55% of the portfolio out of which 50% are current liabilities to be honored for its rightful obligation. Mobil maintained a stability in its equity position over the years.
The trends in the income statement show 80% of the sales belong to the expenses leaving 20% of gross profit. The same is shared among administrative expenses, depreciation and taxes having 4.5% of net profit on an average (Damodaran, 2016).
Pennzoil Company
The organization has lower level of current assets approximately at 13% while its fixed assets constitute around 55% and a substantial portfolio is held under the items Other Investments. Under the liabilities section, 50% of the portfolio has long-term debts while around 10% as current liabilities. So the organization is reeling under debt pressure and taking initiatives to increase its equity gradually to restructure the capital scenario (Ehrhardt & Brigham, 2016).
The company managed to hold its expenses at an average of 60% for a better gross profit but its administrative cost was higher than its counterparts. The organization taking cue from 1995 has been working to control the expenses resulting in retention of better profitability coming out of the losses incurred in 1995.
Unocal Corporation
Unocal Corporation holds around 20% current assets, over 65% fixed assets and there is a growing tendency on equity investments as part of its liquidity plan. The company has around 70% liabilities, out of which 50% are long-term debts and the remaining 30% equities which has been at a stable position over the years.
The income statement show that Unocal has been able to bring down the cost of goods sold from 70.71% in 1995 to 61.75% in 1997. The company has put in great efforts to control the sorts of costs enabling it to retain a greater net profit in 1997 from a loss-making scenario in 1996.
Ratio Analysis
Liquidity
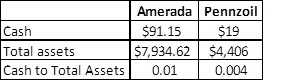
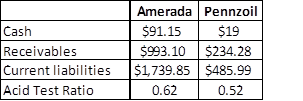
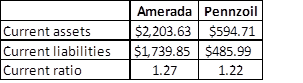
The cash to total assets for Amerada stands at 0.01, 0.014, and 0.007 in 1997, 1996, and 1995 indicating that the organization is gradually improving its cash resources in the asset portfolio for a better liquidity. The acid test ratio stands at 0.62 in 1997 showing its prowess better than previous years to honor its immediate obligations (Brealey, et al., 2020). The current ratio of 1.27 determines the ability to pay off the debts as required to avoid bankruptcy.
Similarly, the liquidity ratios of Mobil Corporation are quite stable to counter the obligations as might arise to hold on its liquidity. It is good to see that Unocal has developed the liquidity figures over the years to stay liquid and fight bankruptcy.
Pennzoil is facing certain liquidity issues as its figure has come down from the previous year having 0.004 in 1997 against 0.008 in 1996 and 0.005 in 1995 in terms of cash to total assets. Similarly its acid test ratio and current ratio also came down as the company is facing trouble with liquidity but has the resources to meet the dues.
Asset Management
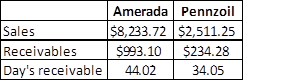
Amerada has day’s receivable as 44.02 days in 1997 which is a little increase from the last years at 37.423 days in 1996 and 39.904 days in 1995. It indicates that the organization is taking little longer to collect its dues from the market but within the prescribed limit say within a month and a half (Lins, et al., 2017). Mobil has earned collection efficiency by reducing the day’s receivable from 41.23 days in 1995 and 42.037 days in 1996 to 37.201 days in 1997. The same could be stated for Pennzoil as the figures reduced from 51.396 days and 38.639 days in the previous years to 34.05 days in 1997. But Unocal seems to have certain issues with its collection department as the figures are around 2 months.
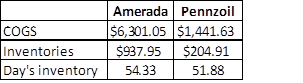
The day’s inventory show that the figures are on a reducing spree for Amerada, Mobil, and Unocal. It implies that the inventories are in demand and taking less time to convert itself into sales (Ogundare & Abdulsalam, 2020). But Pennzoil has a higher inventory ratio compared to its competitors indicating that it is facing issues to sell its inventories in the market.
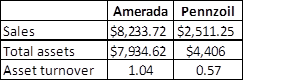
The asset turnover of Amerada and Mobil is satisfactory delivering a higher return in terms of the asset it holds but the same is not valid for Pennzoil and Unocal having poor figures over the years.
Financial Leverage
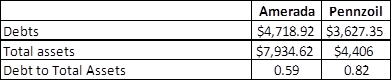
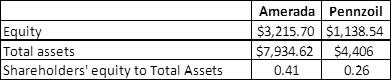
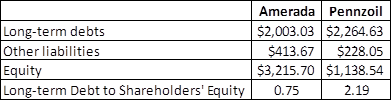
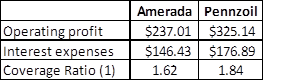
The figures owing to debt to total assets for Amerada and Mobil is quite low showing that the organizations does not extract much debts for its financing revealing lower risks (Bazdresch, et al., 2018). But the figures of Pennzoil and Unocal are comparatively higher indicating higher risk as compared to the other two. Similarly, the other determinants of the financial leverage like shareholders’ equity to total assets, long-term debt to stockholders’ equity, coverage ratio (1), and coverage ratio (2) show lower instance of debts and capability to pay off the interest by Amerada and Mobil. But Pennzoil and Unocal are trying their part to improve the scenario from the debacle of the previous years.
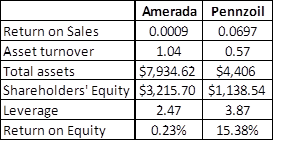
Profitability
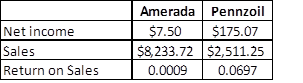
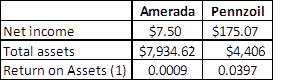
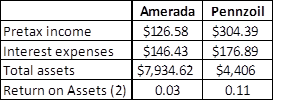
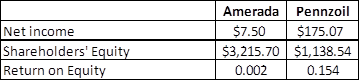
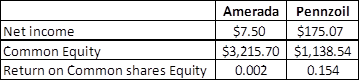
The various ratios of profitability show that Amerada is having trouble to maintain a suitable profitability owing to rising costs. But the other organizations like Mobil, Pennzoil, and Unocal are doing its best to control its expenses and the resultant factor is its improving profitability.
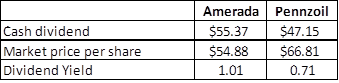
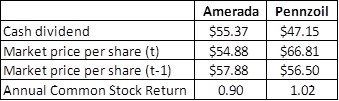
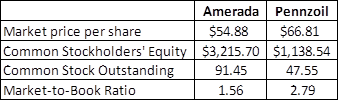
Stock Market Performance
The stock market performance of companies like Amerada is not at par with others in the market and its return suffer due to lower profitability. But organizations like Mobil, Pennzoil, and Unocal has tried to improve its performance over the years. Though they did not perform exorbitantly, but the returns were better than the debt investments in long-term corporate bonds and US Treasury Bill (Damodaran, 2016). But the market performance of the energy companies are lower than the returns of the large and small common stocks.
Conclusion
The report points out that the energy companies are going through its unique problems. Pennzoil suffered loss in the previous year but it is trying to improve its position by increasing the equities and controlling the costs. Amerada has not been able to control the costs resulting in its declining profitability and market returns. Unocal is also trying its best to improve the scenario and has its share of efficiency concern to be taken care. Mobil corporation is the best of the lot delivering an effective performance and stood out in mostly all the avenues and continue its financial management well.
References
Atanasov, V. & Black, B., 2016. Shock-based causal inference in corporate finance and accounting research. Critical Finance Review, 5(2), pp. 207-304.
Bazdresch, S., Kahn, R. & Whited, T., 2018. Estimating and testing dynamic corporate finance models. The Review of Financial Studies, 31(1), pp. 322-361.
Bekaert, G. & Hodrick, R., 2017. International financial management. Cambridge: Cambridge University Press.
Bolton, P., Wang, N. & Yang, J., 2019. Optimal contracting, corporate finance, and valuation with inalienable human capital. The Journal of Finance, 74(3), pp. 1363-1429.
Brealey, R., Myers, S. & Allen, F., 2020. Principles of Corporate Finance. 13th ed. Reading: McGraw Hill.
Damodaran, A., 2016. Damodaran on valuation: security analysis for investment and corporate finance. 324 ed. London: John Wiley & Sons.
Dang, C., Li, Z. & Yang, C., 2018. Measuring firm size in empirical corporate finance. Journal of Banking & Finance, 86(1), pp. 159-176.
Ehrhardt, M. & Brigham, E., 2016. Corporate finance: A focused approach. London: Cengage learning.
Fracassi, C., 2016. Corporate finance policies and social networks. Management Science, 63(8), pp. 2420-2438.
Lins, K., Servaes, H. & Tamayo, A., 2017. Social capital, trust, and firm performance: The value of corporate social responsibility during the financial crisis. The Journal of Finance, 72(4), pp. 1785-1824.
Madura, J., 2020. International financial management. London: Cengage Learning.
Maynard, J., 2017. Financial accounting, reporting, and analysis. London: Oxford University Press.
Ogundare, E. A. & Abdulsalam, D. A., 2020. “The importance of accounting and finance for business managers”. Journal of Accounting and Finance, Volume 12, pp. 2570-2888.
Shapiro, A. & Hanouna, P., 2019. Multinational financial management. Perth: Wiley.
Vishny, R. & Zingales, L., 2017. Corporate Finance. Journal of Political Economy, 125(6), pp. 1805-1812.
Warren, C. & Jones, J., 2018. Corporate financial accounting. London: Cengage Learning.
Appendix
Liquidity
Asset Management
Financial Leverage
Profitability
Stock Market Performance