
Financial Analysis Assignment On Beach Energy Limited
Question
Task : For the latest 5-year period, analyse the following aspects of the companies:
- Profitability
- Liquidity
- Solvency
Each ratio does not sit in a vacuum. One ratio interlinks with other ratios of different categories. Therefore, you need to draw In more than 2 ratios in each category to provide substantive reasons and discussions, Industry average and competitors’ data also form a good platform to put your discussion into perspective.
Requirements: The following Is a list of companies from the latest ASX. These companies are carefully chosen to suit this project and the learning outcomes of the unit.
- Wood side Petroleum Limited
- Santos Limited
- beach energy limited
Answer
Executive summary
Analysis of the statement of financial performance as discussed financial analysis assignment is very needful for the firms. It makes the management aware of the performance gaps and improvement requirements of the business in financial terms. Finance is the key to the sustainability of the business in the short run as well as in the future. Due to this reason mentioned above in this financial analysis assignment analysing the financial performance is very important. Analysing the performance of Beach Energy Limited in financial terms the study has identified the company needs improvements in profitability. The company needs to control its cost level in the most prominent way and at this point it needs to focus more on better revenue generation. The liquidity of the company is fluctuation, but it is at a standard position. It is observed in this financial analysis assignment that the risk associated with the business is low and due to that the business has achieved solvency in the long-run.

Introduction
Determining the financial position of the business is considered as the critical activity that the management of a firm requires performing for the betterment of the business. The analysis of financial data or financial position is important for identifying whether the business is financially viable in the current market situation. Along with this, it is also observed in this financial analysis assignment that evaluation of the financial results of the company helps the management understanding the strong and weak points in the business. Along with that, it can also be stated that with the help of financial results analysis the management of any company can understand whether the strategies adopted by them are effective for improving the performance level of the firm or they need to develop better strategies for the firm. It means a large number of information about the business can be generated through financial data analysis.
For conducting financial analysis of a firm as discussed in this beach energy financial report, management of the company may adopt different tools. There are several tools available for this purpose; however, among all the tools, financial ratio analysis tool is the most popular tool in the modern business environment (Easton & Sommers, 2018). Financial ratio analysis tool is popular in the market because this tool can easily detect the financial performance standard and position of the company in financial terms can be better detected with the help of this particular tool. However, in this study, the financial analysis will be done on Beach Energy Limited. Mainly three different types of ratios will be considered for the analysis and these different financial ratios are – profitability ratios, liquidity ratios and solvency ratios. Each of these three ratios indicates the financial performance standard of the company from different perspective, which is very essential for determining the actual scenario of the business.
Profitability analysis
Beach Energy Limited is based in Australia and deals with in oil and gas exploration that started business in Australia in 1961. The company is presently listed under Australian Security Exchange. Headquarter of the company is situated at Adelaide, South Australia. The company is mainly producing the oil and gas from five basins in Australia and New Zealand (Beach Energy, 2019). In the recent time, Beach Energy Limited is the largest onshore oil producing company in Australia, which means the company is producing at a larger scale. At this point, it can also be stated that the accounting performance of the firm must be at a better level in the recent time.
Considering the financial performance standard of Beach Energy Limited, it is required to be observed that a company can be considered as stronger player if it has profitability at better level than the other companies in the industry. If the focus is made on the profitability of the company for last five years, it can be noticed that the company has no stability in the performance standard.
Profitability of a company indicates several financial matters of the business. It means with the help of profitability analysis the company the management can understand whether the income level of the business. It means the profitability indicates whether the company is capable of generating positive income for the business or the company is generating negative income to the business. (Sierra-Garcia, Garcia-Benau & Bollas-Araya, 2018) At this point in this beach energy financial report, it can also be stated that with the help of the profitability analysis the management of a company like, Beach Energy Limited can also understand how far they have controlled the cost level of the business. In this context it is important to be mentioned that controlling the cost level of the business is very important for the company. Proper control over the direct and indirect costs of the business ensures high income for the company.
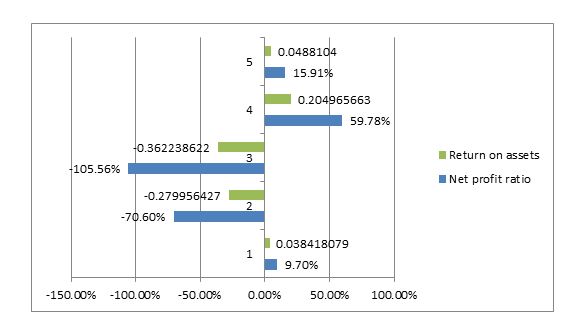
In the context of the business of Beach Energy Limited profitability has been analysed using two financial ratios – net profit ratio and return on assets of the business. The following table is showing last five years’ profitability data of the company:
|
Financial ratios |
2014 |
2015 |
2016 |
2017 |
2018 |
|
Profitability ratios: |
|
|
|
|
|
|
Net profit ratio |
9.70% |
-70.60% |
-105.56% |
59.78% |
15.91% |
|
Return on assets |
0.038418 |
-0.27996 |
-0.36224 |
0.204966 |
0.04881 |
(Source: Morningstar.com, 2019)
(Source: Created by author)
The above table in this financial analysis assignment is showing the profitability position of Beach Energy Limited for five consecutive years. The net profit is the amount that is available to the business after extracting all the costs incurred by the company during a particular period. It means net profit ratio shows the actual income generating capacity of the business. If the net profit ratio of Beach Energy Limited is considered for last five years, it can be identified that there was no stability in the performance standard of the business. In the financial year 2014 the company earned a standard percentage of net profit, which indicates the efficiency level of the business. However, the table is also showing negative profitability standard of the business in next two financial years (Muda et al., 2018). Moreover, the pathetic news is that the negative net profit margin of the company was much high, which indicates worse performance standard of the business during 2015 and 2016. However, the company again recovered its profitability in 2017, but it failed in maintaining that performance in the next year that is in 2018.
Critically analysing the net profit ratio scenario of Beach Energy Limited for last five years, it must be observed that the company had no stability in the context of profit generation. At this point, it can also be stated that the company failed in controlling the cost level of the business efficiently. If the activities of Beach Energy Limited are considered during these five consecutive years especially in the years of 2015 and 2016, it can be identified that in these two years the company made higher amount of investments in discovering additional oil basin. At this point, the company also made investments in the fossil fuel project. The company total invested $430 million in the fossil fuel project, in which the company failed in gaining profit at the expected level (Beach Energy, 2019). Due to the huge investment the net income of the business came down to the negative level, which means the company faced higher amount of financial loss during these two years. However, the most important matter is that the company efficiently recovered its profitability in the next financial year.
Instability in the net profit ratio or net profit amount of the company is also indicating the fact that the company failed in utilising its assets in the most efficient manner (Robinson et al., 2015). Considering the return on assets ratios of the company for last five consecutive years, it is required to be observed that the management of the company could not manage the assets efficiently. In 2015 and 2016 the return on assets was at the negative point, which means the assets of the company failed in generating profit for the business. It is clearly indicating that the management of Beach Energy Limited needs focusing on their assets management activities. At this point in this financial analysis assignment, it can also be stated that due to the inefficiency in utilising the assets of the business the return percentage as well as the net profit of the company declined.
Inefficiency in the utilisation of assets was taken place because of the inefficiency of the management of Beach Energy Limited in developing proper strategies that can generate more revenue to the business. In this context, it is noticeable that during 2015 to 2017 the revenue of the company was much lower than the other financial years. It means there was problem with the revenue generating strategies of the company (Beach Energy, 2019). Though the revenue of the business was less, the company could not control its cost level efficiently. Considering the weak revenue generating capacity of Beach Energy Limited, it must be stated that due to the higher level of competition in the oil and gas industry in Australia the company failed in establishing a strong position in the market. Though it is the largest producer of oil and gas in Australia, there must be inefficiency in marketing and promotional activities of the business (Beach Energy, 2019).
Therefore, evaluating the profitability performance of Beach Energy Limited from different perspectives, it can be sated that the management team of Beach Energy Limited needs to be more careful regarding the assets management of the business. The efficiency level of the human resource management needs to be enhanced by providing them better training. At this point in this beach energy analysis, it is also mentionable that the management team of the company needs conducting critical analysis of the investment options before making the final decision. The fossil fuel investment of the company was failure, which indicates that better analysis is required before making the final investment decision.
Liquidity analysis: Apart from profitability, liquidity is another major pillar of the financial health of a business. The term liquidity indicates the short-term financial efficiency or solvency of the business. Maintaining the liquidity of the company at the standard level is very important for ensuring systematic growth of the company. If the company maintains its liquidity at the standard level, it can ensure its sustainability in the short-run. However, in this context, it is important to be mentioned that the liquidity requirement of the company may vary based on the type or nature of the business (Ahmed & Safdar, 2018). At this point, it is also important to be mentioned that at the time of evaluating the liquidity position of the management of the company needs considering the industry average of the ratios. This can help the managers understanding whether the performance of the company is up to the standard or the company needs more improvements. If a company faces liquidity related issues that indicates very dangerous situation of the business because liquidity issue indicates that the company is facing issues in its daily activities, which is not good for the sustainability of a company.
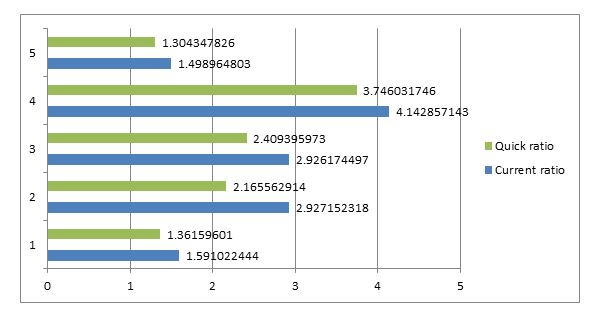
The liquidity ratios of Beach Energy Limited for the last five consecutive years are stated in the following table:
|
Financial ratios |
2014 |
2015 |
2016 |
2017 |
2018 |
|
Liquidity ratios: |
|
|
|
|
|
|
Current ratio |
1.591022 |
2.927152 |
2.926174 |
4.142857 |
1.498965 |
|
Quick ratio |
1.361596 |
2.165563 |
2.409396 |
3.746032 |
1.304348 |
(Source: Created by author)
Considering the above table in this assignment for financial analysis, it can be observed that the liquidity of the company has been indicated by two different ratios. The current ratio of the company for last five years is indicating fluctuations in the short term solvency of the business. At this point in this assignment for financial analysis, it is also noticeable that in the financial years 2015, 2016 and 2017 the current ratio as well as the quick ratios were much high, which are indicating that in these three years the liquidity position of the company was good. On the other hand, compared to these three years, the liquidity ratios of the company for 2014 and 2018 were much low (Morningstar.com, 2019). However, in this context, if the comparison is made between the liquidity ratios of the company and the industry average, it can be noted that the liquidity of Beach Energy Limited was at the standard level. It is because in the current scenario the standard level of liquidity is 1.19:1; whereas, in each of the last five years the liquidity of the company was much higher than the industry average (Beach Energy, 2019).
At this point, it is important to remember that too much liquidity is not acceptable for any business too much liquidity hampers the business in the long run. Due to this if a business has very high liquidity investors do not prefer to invest in that company. In the case of Beach Energy Limited, it is required to be observed that apart from 2017, the liquidity of the company was at the standard level. Standard liquidity level of a business indicates that the business is capable of paying off its debts. This is good for the business because it helps the company earning faith of the creditors and investors easily. In the other words, it is required to be observed that standard level of liquidity helps the company earning the high brand image in the market (Ahmed & Safdar, 2018).
In the context of the business of Beach Energy Limited, if the quick ratios are also considered, it can be noticed that there were not much differences between the current ratios and the quick ratios. It means the inventory level of the business was not too high during these five financial years. Lower level of inventory is not good for the business because it indicates lack of sales flow in the company (Entwistle, 2015). In the context of Beach Energy Limited, it can be noticed that the sales flow of the company was not that good, which might have happened because of lack of proper inventory level in the business. In this context of this assignment for financial analysis, it is also mentionable that lack of inventory level and very high liquidity of the business indicates that the management team or the responsible personnel of the company are not efficient enough for developing better strategies for the business. Inefficient liquidity management indicates instability of the business in the short run. If a business becomes instable in the short run, it can never be stable in the long run (Eng, Tian & Robert Yu, 2018). It means due to the inefficiency in the liquidity management the future of the company may get hampered badly.
However, the management team of the company can safeguard the business by adopting the right strategies. The management team needs to develop a strong budget considering the current assets and current liabilities of the business. There should be proper balance between the current assets and current liabilities of the company. The amount of current assets needs to be more than the amount of current liabilities (Maaloul & Zéghal, 2015). The management of the company must manage the inventory in a better way. There should be enough inventories so that the sales flow in the business can be increased.
Along with that the management team of the company needs to focus on better cash management for the business. For managing the cash properly the company needs to emphasize on factors like, debtors management and creditors management. Proper policies in this regards need to be developed so that cash flow in the business can be managed efficiently. It is also mentionable that of the company can manage the liquidity efficiently it will never face any working capital problem. Working capital problem may create barriers in the regular business activities. Therefore, it is required to be observed that maintenance of liquidity at the standard level is important for ensuring efficient operation and effective growth of the business.
Solvency analysis: Solvency is another major determinant of the financial performance standard of a business. The solvency ratios of a company indicate the feasibility or solvency of the business in the long-run. In the other words, it is required to be observed that solvency ratios help in understanding the long-term business security of a company. At this point discussed in this beach energy analysis, it can also be stated that the solvency ratio of a business indicates the capability of a company to mitigate or payback its debts in the long run. This ratio is very important to the creditors or the lenders of the business (Lang & Stice-Lawrence, 2015). It is because this particular type of ratio helps in understanding whether the company will be capable of returning back the money on the required and previously mentioned time span. For an organization or for the management identifying and analyzing the solvency ratios is very important because proper analysis of the solvency ratios helps in understanding whether the business will be sustainable in the long run or the business has any doubt regarding this matter (Iyengar et al., 2017). If the management finds any problem in this ratio, they can develop better strategies on immediate basis and they can safeguard the business properly.
|
Financial ratios |
2014 |
2015 |
2016 |
2017 |
2018 |
|
Solvency ratios: |
|
|
|
|
|
|
Debt ratio |
0.295292 |
0.262527 |
0.338868 |
0.259377 |
0.549178 |
|
Equity ratio |
0.704708 |
0.738017 |
0.661132 |
0.740623 |
0.450822 |
(Source: Morningstar.com, 2019)
(Source: Created by author)
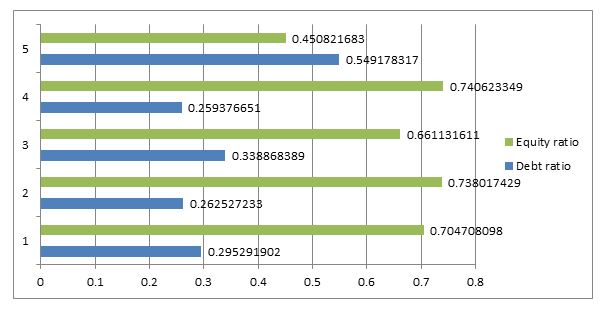
The above table as discussed in this financial analysis assignment is clearly showing the two different solvency ratios of the business of Beach Energy Limited. The debt ratio of a business indicates the utilization of debt capital in the context of buying or acquiring the total assets of the business. If the level of debt ratio high, it indicates that the company has used more debt capital in the assets, which means that, the assets of the company involve more risk and vice-versa (Kaur, Aggarwal & Gupta, 2017). Considering this fact most of the company try to keep the debt ratio at the low level. Fluctuations were there in the debt ratio of the business from 2014 to 2018 and at this point, it is also noticeable that the company used the highest amount debt capital in buying its assets in the year of 2018. It means in the last financial year the assets of the business became riskier than the assets in the previous financial years. At this point, it can also be stated that in the last financial year the equity position of the company became weak.
The above table as discussed in this financial analysis assignment is clearly showing the two different solvency ratios of the business of Beach Energy Limited. The debt ratio of a business indicates the utilization of debt capital in the context of buying or acquiring the total assets of the business. If the level of debt ratio high, it indicates that the company has used more debt capital in the assets, which means that, the assets of the company involve more risk and vice-versa (Kaur, Aggarwal & Gupta, 2017). Considering this fact most of the company try to keep the debt ratio at the low level. Fluctuations were there in the debt ratio of the business from 2014 to 2018 and at this point, it is also noticeable that the company used the highest amount debt capital in buying its assets in the year of 2018. It means in the last financial year the assets of the business became riskier than the assets in the previous financial years. At this point, it can also be stated that in the last financial year the equity position of the company became weak.
In this context mentioned in this financial analysis assignment, it is important to be mentioned that for achieving solvency at the standard level, it is very important to keep proper balance between the debt and equity ratios of the business. It is important to be remembered that higher is the debt ratio, higher is the risk in the business. In the other words, it is required to be observed that if the company uses more debt capital the company faces higher risks in its assets (Maaloul & Zéghal, 2015). On the other hand, if the company uses high equity capital in the acquisition of its assets the risks associated with the assets will be decreased. Hence, it can be mentioned that the management team of the company needs to be very careful in the context of determining the debt ratio and equity ratio for the business.
If the two solvency ratios of the company are considered together, it is required to be observed that the company has used more equity capital for its assets during the last consecutive five years. It means the management team of the company was careful about the risk level of the business. At this point, it can also be stated that the management team of the company was also careful about the long term situation of the business. Less risk in the assets is good for the company in the long run because it ensures that the company will be capable of meeting its liability by its assets if any emergency situation arises in future. Therefore, considering the overall study on the solvency position of the company, it is required to be observed that the company has solvency in the long run.
The assets of the company are in less risky situation. The company might have made the decision of using more equity capital for adjusting the risk level in the business. Less risky assets sometimes help the company in attracting new investment in the business. In this context, it can also be stated that the company or its management has decided to use for equity financing so that the funds or cash in the business can be managed in a better way (Muda et al., 2018). In the case of equity financing the outgoing of funds from the business can be stopped, which helps the management in maintaining the financial position in a better way. In the other words, it is required to be observed that due to the use of higher level of equity finance the company will have less need of money for influencing the financial growth of the business.
Therefore, if the overall performance of Beach Energy in financial terms is critically evaluated with the help of three different types of ratios, it is required to be observed that the performance of Beach Energy in financial terms requires much improvements. The main problem that has been identified in the financial performance of Beach Energy Limited is that the company has failed in maintaining stability in the financial performance. The performance of the company throughout the five accounting years was fluctuating. This is not good for any organization’s future sustainability. At this point, it can also be stated that the profitability position of the company was not much impressive. In 2017 the profitability was very high; however, in the next year that is in 2018, the profitability came to the lowest level. This kind of instability will create barriers for the company in attracting new investments in the business. On the other hand, the company may also face difficulties in gaining trust of the creditors in financial terms.
Considering the liquidity position, it is required to be observed that the firm has managed the liquidity position in a better way. Comparing the performance with the industry average, the study has determined that the liquidity is at the standard level. However, like, profitability, liquidity of the company has also fluctuated. If the comparison is made with its competitor Santos Limited, it can be noted that the performance of the competitor firm was more or less stable, which is important for achieving systematic growth in the business. However, in this context, it is very important to mention that the best part in the business of Beach Energy Limited is the low risk level. The management team of the company has taken care of the risk level of the business, so that it can be maintained at the lower level.
Conclusion
Findings in this financial analysis assignment have indicated that Beach Energy Limited is operating in Australia for a long time. This is one of the largest companies in the Australian energy industry. The company deals with gas and oil products. From the critical evaluation of different financial elements of the business, the financial analysis assignment has determined that there are fluctuations in the profitability, liquidity and solvency positions of the company. The fluctuations or instability has created barriers in the growth of the performance of Beach Energy in financial terms. According to the findings in this report, it is required to be observed that the company needs improvements in the context of profitability. In last five years the profitability position of the company was very weak, which indicates the company needs proper control on the cost level of the business and at this point, the company also needs developing better strategies for revenue generation. On the other hand, as per the liquidity analysis of Beach Energy Limited, it is required to be observed that the company has stronger liquidity position as the liquidity is above the industry average. At this point in this financial analysis assignment, the solvency level of the company is also at the standard position, which is good for the future developments of the business. Financial analysis assignments are being prepared by our finance assignment help experts from top universities which let us to provide you a reliable assignment help Australia service.
Reference list
Ahmed, A. S., & Safdar, I. (2018). Dissecting stock price momentum using financial statement analysis. Accounting & Finance, 58, 3-43.
Beach Energy. (2019). Retrieved from https://www.beachenergy.com.au/
Easton, M., & Sommers, Z. (2018). Financial Statement Analysis & Valuation, 5e.
Eng, L. L., Tian, X., & Robert Yu, T. (2018). Financial statement analysis: evidence from Chinese firms. Review of Pacific Basin Financial Markets and Policies, 21(04), 1850027.
Entwistle, G. (2015). Reflections on teaching financial statement analysis. Accounting Education, 24(6), 555-558.
Investments, B., Portfolio, Y., FundsETFs, I., Funds, M., Tools, T., & Screener, B. et al. (2019). BEPTF Beach Energy Ltd Stock Analysis, Price & History | Morningstar. Retrieved from https://www.morningstar.com/stocks/pinx/beptf/quote.html
Iyengar, G., Luo, Y., Rajgopal, S., Venkatasubramanian, V., & Zhang, Z. (2017). Towards a Financial Statement Based Approach to Modeling Systemic Risk in Insurance and Banking. Columbia Business School Research Paper, (17-77).
Kaur, M., Aggarwal, N., & Gupta, M. (2017). An Investigation into Returns from Financial Statement Analysis among High Book-to-Market Stocks. Indian Journal of Economics and Development, 13(2), 353-358.
Kaur, M., Aggarwal, N., & Gupta, M. (2017). An Investigation into Returns from Financial Statement Analysis among High Book-to-Market Stocks. Indian Journal of Economics and Development, 13(2), 353-358.
Maaloul, A., & Zéghal, D. (2015). Financial statement informativeness and intellectual capital disclosure: An empirical analysis. Journal of Financial Reporting and Accounting, 13(1), 66-90.
Muda, I., Maulana, W., Sakti Siregar, H., & Indra, N. (2018). The Analysis of Effects of Good Corporate Governance on Earnings Management in Indonesia with Panel Data Approach. Iranian Economic Review, 22(2), 599-625.
Robinson, T. R., Henry, E., Pirie, W. L., & Broihahn, M. A. (2015). International financial statement analysis. John Wiley & Sons.
Sierra-Garcia, L., Garcia-Benau, M., & Bollas-Araya, H. (2018). Empirical Analysis of Non-Financial Reporting by Spanish Companies. Administrative Sciences, 8(3), 29.


