Financial Analysis Assignment: Financial Performance Evaluation Of UK Chemical Businesses
Question
Task: Financial Analysis Assignment Requirements
You must write an individual report analysing only the data provided. The data is real UK data from a specialist database. There are more than 5,000 foodandtobacco manufacturers registered in the UK, but consistent data on the variables in this data set is only available for the sample you have in the data set for the latest year available, 2020. The data includes measurements of performance, size, and other variables. The overall aim of your analysis is to help the client understand the UK food and tobacco manufacturing sector. The client is thinking about investing in this sector and wants you to analyse the available data provided in the Excel file. You should use your analysis to provide the client with a better understanding of the performance potential of different groups of companies in the sector. Your report must provide only the analysis that the client has requested, and your discussion must explain why the analysis might be relevant to the client as they think about investing in the sector. Your job is not to decide whether the client should invest or not, or to do financial analysis for the client. Your job is to provide the analysis that the client requests, and provide recommendations drawn directly from the analysis. Only use the data provided. Do not add new or additional data or information from other sources. Only use the techniques we have covered in the lectures. Do not use evidence or techniques that we have not covered in the lectures. You can only use EXCEL spreadsheet for your analysis that we have used in the lectures and/or computer labs.
Any evidence that students have colluded or copied each other or used the work of a source without reference and citation will be investigated and may result in a plagiarism investigation. If you use techniques we have not covered in the lectures, it will be treated as a major failure to meet the requirements of the CW2 brief.
The Client’s Requirements
The client is a business investor. This client has not invested in the UK food and tobacco manufacturing sector before. The client wants you to analyse the data they have provided and present the analysis as a business report of no more than 2,500 (excluding tables, charts, and appendices). The report should help the client in their aim to better understand company performance in the UK food and tobacco manufacturing sector and how the information from this data set might be used when thinking about investing in the sector. The client has requested the following from you:
The client requires you to provide:
a) An analysis of the distribution of the profit rate across all companies in the data set.
b) An analysis of the distribution of the profit rate, comparing the large and SME (small & medium sized) firms in the data set.
c) An analysis of the distribution of the profit rate, comparing manufacturers in the data set by their export activity.
d) An analysis of the distribution of Return on Capital Employed comparing large and SME manufacturers in the data set.
e) An analysis of the export activity of the manufacturers in the data set against their size, measured by whether they are large or SME companies
f) An analysis of the extent to which the profit margin across all manufacturers in the data set is associated with the other quantitative variables in the data set.
g) An analysis of the extent to which the profit margin for manufacturers in the data set that can be predicted using the other quantitative variables in the data set.
1. In order to meet the client’s requirements, you MUST use all the following methods in your analysis in the report:
a. Analysis of required variable distributions (using descriptive statistics and histograms) with appropriate explanations and comments on what your findings imply for the Client’s aim.
b. Hypothesis tests of the difference of means with appropriate explanation and comments on what the tests results imply in relation to the Client’s aim.
c. Cross tab analysis with appropriate probability pattern discussion, and associated Chi squared test with explanations of what the results imply in relation to the Client’s aim.
d. Correlation analysis with appropriate explanations of what the results imply in relation to the Client’s aim.
e. Bivariate regression analysis with appropriate explanations of what the results imply in relation to the Client’s aim. The regression output should be reported and the interpretation of the results is required.
Please include all EXCEL output in the appendix.
2. You must choose which techniques and variables to use for each of the client’s stated requirements.
3. Each part of the analysis must be explained. You must say why you chose the variables, why you chose the technique, give appropriate explanations of any results (any calculations should be put in the appendix and not in the body of the report). You need to ensure you interpret the results of techniques used but you do not need to explain calculations to the client. You must provide a full discussion of what your results mean for the client within each part of the analysis (not at the end of the report). Failure to do this will result in very low marks. Marks are mainly awarded for presenting and interpreting the output of Excel for the Client in terms of what it means, not for getting Excel to produce the output. For example, if you say the distribution is skewed, you need to show the evidence and explain why this might be of interest to the client in terms of their understanding performance in the UK food and tobacco manufacturing sector and the client’s plans to invest in the sector.
4. Any tables or charts used must be ‘fit for purpose’ – You must adapt the Excel tables and charts so that they meet the client needs and are fit for presentation in a formal business report. When you have done this, you can cut and paste them into the report. Any fit for purpose charts or tables should be put in thebody of the report (not in the appendix) and every table and chart should be numbered, with titles, and have beneath it, a full explained and discussion saying what the table or chart shows and how this relates to the client’s aim.
The report must be set out as follows:
5. Write your analysis as a typed report with an appropriate title page, contents page, section headings, numbered and labelled figures and tables, and appendices. You do not need an Executive Summary.
6. You must provide an introduction to your report. Your introduction must state your overall aim and your objectives in order to meet the client’s requirements.
7. You must provide evidence in an appendix showing how you did the analysis and how your results were calculated. Normally this means providing a ‘screen shot’ of part of an excel sheet showing the Excel results. This evidence should be put in the appendix. Do not include a screen shot of all the data.
8. You must provide a conclusion with a summary of your results and recommendations. Your conclusion should summarise what you have already discussed in your analysis, and summarise your recommendations, which should already have been discussed within the analysis. Summarise your findings. Clearly state whether your analysis has met your objectives and why. If you think your report has some weakness, explain what it is and why. Your recommendations must be linked to your conclusions. You will gain marks for this type of critical review.
9. The word count (excluding tables and appendices) is a MAXIMUM OF2,500 words for the whole report. This report can be well done in fewer than 2,500 words if well written and well-focused. You should choose how many words are appropriate for each section in your report. You must provide a word count on the Front Page of the Report.
10. The word count (excluding tables and appendices) is a MAXIMUM OF2,500 words for the whole report. This report can be well done in fewer than 2,500 words if well written and well-focused. You should choose how many words are appropriate for each section in your report. You must provide a word count on the Front Page of the Report. If you exceed the word limit you will lose marks as follows:
i. 10 marks deducted for exceeding the word limit by up to 250 words
ii. 20 marks deducted for exceeding the word limit by 251-500 words
iii. 30 marks deducted for exceeding the word limit by 501-750 words
iv. 50 marks deducted for exceeding the word limit by more than 750 words.
11. You should reference your sources. You are not required to read about the UK food and tobacco manufacturing sector. But you are expected to cite sources that relate to your Excel analysis and statistical techniques. You should cite and reference all materials you use including lecture notes, web pages, on-line books, hard copy books, etc. A citation should be provided whenever you are using a statistical technique. These will include textbooks and web sites.Remember, the client may want to consult a source if they are not familiar with your technique, so a citation in a report can be used to guide the reader to some supporting material. References to sources must be provided using the Harvard method in the text of the report and all sources should be fully identified in a bibliography at the end of the report.
Answer
Introduction
Data on the financial performance of chemical producers registered in the United Kingdom is gathered in this report on financial analysis assignment in order to aid in further investment in the sector. Among the variables in chemical producers' financial statistics are their size, performance, and so on. An examination of the most recent year's financial information is provided in this document. In order to assess the performance level of UK chemical firms, the data contains the quantifiable characteristics. To evaluate, a report containing 486 financial data points ranging from profit margins to the number of workers to production costs to shareholder returns to ROE to loan limits to the domestic sales of small and big enterprises is provided for review. This paper includes the use of regression, chi-square, and correlation tools for data analysis. To assist the customer in making investment decisions, financial data from UK chemical producers may be analyzed.
Analysis of profit rate distribution across all companies
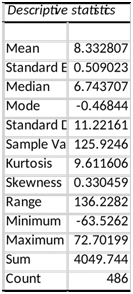
Following an investigation on the distribution of profit rates in the UK's chemical industry, 486 firms were selected for further study. Analyzing the data on an individual basis makes it difficult to determine the profit rate distribution across all enterprises. Descriptive statistics are therefore employed to acquire the values of the mean, median, and standard deviation in order to provide an appropriate data analysis (Ali et al. 2019). Descriptive statistics are used since the investor will have a difficult time visualizing and comprehending the raw data. Consequently, we may display data in a more relevant form with a more easy interpretation of the profit margin by using descriptive statistics.
The descriptive data show that the average company is 8.33, the median is around 7.74, and the negative mode is 0.46, with the mean and median being close to each other. It showed a positive skew in the distribution of profit rates. This is because the mode has a higher mean and median value. The median, on the other hand, is smaller than the mean. Investors will benefit from a generally positive relationship between profit distributions across the UK chemical industries. It also shows that there are a large number of enterprises in the UK chemical sector that have a positive profit rate distribution, since the standard deviation exceeds 10. (Refer to appendix 1).
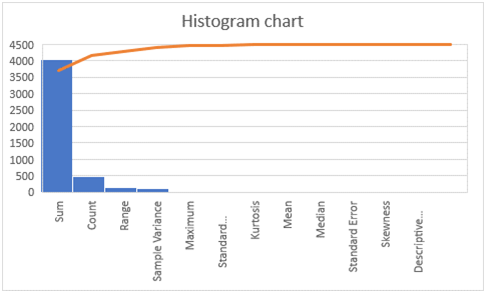
Figure1:Histogramchart
(Source:createdbytheresearcher)
Finally, the histogram shows that the trend line is favorably skewed, which means that the return is always positive in the descriptive stats. According to one indication, there is a positive correlation between the number of employees working in small and large enterprises. Another indication is included in the profit margin.
Analysis of profit rate comparing large and SME firms
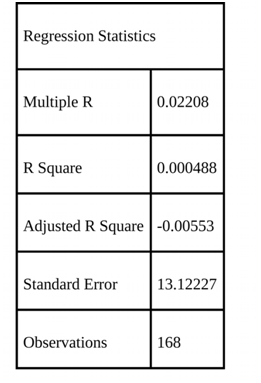
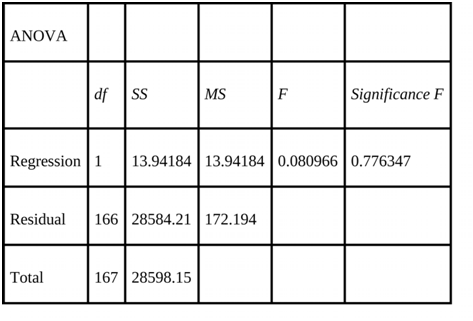
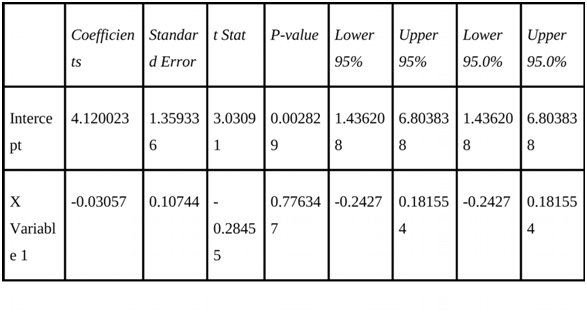
The financial data of the UK's chemical manufacturers is analyzed using the regression technique. Predicting changes in profit, sales, return on investment, and other firm metrics is a fundamental part of financial forecasting. Between two variables, one is dependent and the other independent, a regression model may be constructed.
Chemical businesses' profits are expected to rise as a result of increased manufacturing efficiency. Profit is the dependent variable here, and production effectiveness is the independent variable. There would be a negative impact on the profitability of chemical producers if production efficiency decreased. The p values and coefficients that show the association between independent and dependent variables in the regression report of chemical small and big firms (Daoud, 2017). The mathematical bond is defined by the p values and coefficients, and this is important from a strategic standpoint. The regression study is based on 486 financial data from chemical companies. The P-value of a regression technique used to assess the profitability of small, medium, and big businesses indicates that
The valuation of each company varies (Lang, 2016.). Calculating the correlation coefficient involves dividing the standard deviation of the two variables by the correlation coefficient. Among the most important outputs from this regression analysis are the R square, the intercept, and a coefficient that indicates that the hypothesis is valid. Both small and large enterprises' profit margins were shown. The profitability of large and small businesses is determined by the efficiency of their output, according to regression analysis. It also shows that the factors have a strong link. The significance is more than 0.5, indicating that the variables have a meaningful association (Refer to appendix 2). In the regression analysis, it is shown that both large and small businesses make a lot of money.
Analysis of distribution of profit rate, comparing manufacturers by export activity
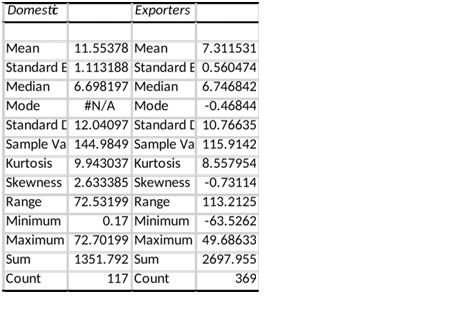
There is evidence that trade activity in the UK chemical industries' listed businesses encompass both local and export activities. Exporters' mean value is lower than domestic transport's, as can be shown from descriptive data. For both domestic and export activity, the median is bigger than the mean (Bhering, 2017). A consistent supply of materials implies that both the carriers have a reliable source of income. Although domestic transportation is more positive than the standard deviation, the value contains more than ten findings. The standard deviation of exporting trades is far lower than that of domestic enterprises, yet both have positive values. Because domestic enterprises have a higher rate of transportation and profit margin than exporters, it may be concluded from the comparison of descriptive statistics of both trade activities in the listed companies (Refer to appendix 3).
Exporters have a skewness of -0.73 compared to a skewness of 2.63 for domestic enterprises. As a result, initial investments in UK chemical exporter firms are unlikely to generate profitable returns. In light of this, it's safe to say that domestic firms or product transportation in the domestic territory are more prevalent than exporting firms in the region.
The trend line has a tiny upward rising tendency at the beginning and remains constant from a specific time, as seen in the above histogram. As a result, it is necessary to draw the conclusion that enterprises benefit equally from local and foreign exports. Exporters, on the other hand, see their profit margins fluctuate and shrink.
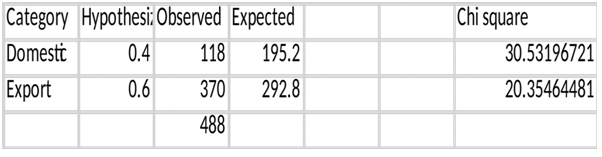
Comparing large and small publicly traded firms in order to determine how return on capital is distributed is a time-consuming and involved process. As a result, the needed return on capital must be calculated using both an expansive and a basic model, depending on the size of the firms. As a result, an investigation into Chi-Square is conducted (Refer to appendix 4). The specific test allows us to compare a vast number of data in a simple yet accessible manner in respect to the investing perspective's stated goals. As a result, investors and clients may make an easy decision by comparing and estimating the worth of large and small businesses (Plonsky and Oswald, 2017). It is found that the value of SME is roughly 0.0139, while the value of large firms accounts for approximately 0.0461. As a result, multinational corporations in the UK chemical industry can generate higher rates of return on investment than small and medium-sized enterprises (SMEs).
On the other hand, there are 318 small and medium-sized businesses, compared to just 168 major corporations, which means that small businesses outnumber large corporations. However, when it comes to the return of capital from operations or output, the number of sizes does not matter. Since large firms are more stable and produce a higher return on capital than smaller organizations, the overall research concludes that large companies should be considered.
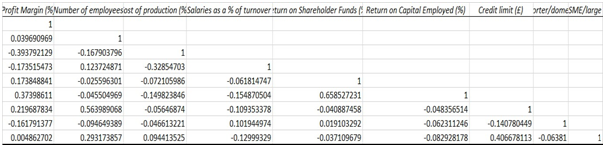
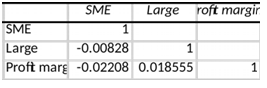
Manufacturing firms were classified into two categories based on their size, which was determined by looking at the list of companies. According to the division, the export operations of both large and small manufacturing enterprises are correlated. Correlation results show that major corporations' export operations are more closely tied to those of small and medium-sized manufacturing firms. This indicates that the first column of SME has a small number of export enterprises in small size, as indicated by the negative values of 0.08 and 0.22. Both columns 2 and 3 show that major enterprises are exporting services with positive values of 0.018 and 1.
It's because the correlation table can establish a link between two distinct business and industrial processes that it's so often employed (Refer to appendix 5). A company's or an activity's potential for the proper concept to be implemented can be spotted with the aid of correlation (Gelman and Nolan, 2017).
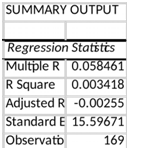
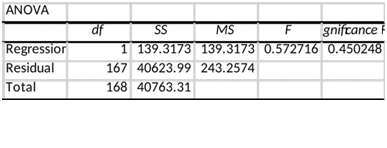
The correlation between profit margin and other quantitative factors was found to be nonexistent in both small and big manufacturing firms. With the use of regression analysis, major and small manufacturing enterprises' production costs are taken into account in this part. It appears that the R-value is positive at 0.05 and R square is 0.003. Consequently, it is shown that firms' profit margins are linked to their manufacturing costs. F is at 0.45, which is statistically significant and shows a strong correlation with all of the factors included in the firms studied. The total DF value is 168, and the F value is 0.572. This signifies that the profit margin and capitalization rate of the firms are both positive. Having said that,
Based on the kind of company or size, regression analysis was considered. To put it another way, the division was created to be compared to both major and small manufacturing enterprises.
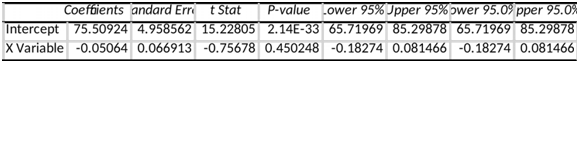
When looking at this situation, the use of regression analysis was explored since it is easy to identify the influence of numerous factors on a certain task. Regression analysis is a critical tool for businesses since it helps them identify the most essential variables. A profit margin's link to a company's manufacturing costs was examined thusly (Heck et al. 2018). As a result, it is possible to overlook extra factors that have no impact on a company's profitability or output, regardless of its size or kind. On the other hand, there are 318 small and medium-sized businesses, compared to just 168 major corporations, which means that small businesses outnumber large corporations. If the standard error is compared to the value, then large-sized enterprises have a favorable outlook and the value holds greater than 10. To summarize, the regression study shows that investment in large-scale enterprises in the UK chemical manufacturing sector generates a predictable return (Refer to appendix 6). Small and medium-sized businesses, on the other hand, are advancing and allowing for a reasonable return. It is expected that the SME Companies would be able to provide greater returns on profit and capital in addition to the increase in export services. As a result, if the investor is willing to take a risk and is willing to invest in these small businesses, he might expect a superior long-term return.
An investigation of the strength of the connection between two numerical variables is carried out statistically by correlation analysis. UK chemical manufacturers' financial data is examined using correlation analysis in order to make investment decisions. Large and small UK chemical firms' profit margins and staff counts are part of the financial information included in this report. The statistics in the available data show a substantial correlation between the two variables that may be examined using correlation analysis. Using a correlation coefficient, you can determine whether variables have a significant association with each other (Makowski et al. 2020).
According to a study of financial data from large and small organizations, there is a perfect correlation when the correlation is 1, but there is also a -1 correlation (Refer to appendix 7). The correlation between the two variables indicates that if one variable is changed, the other variable will change as well. The profit margins of small and big chemical manufacturing businesses are separated to examine the link between the two variables, using financial data from small and large enterprises in the sector. Two variables, return on capital employed and profit margins, are used in the correlation analysis of the financial data supplied. According to the results, the correlation coefficient between two variables is 1, indicating a 100% positive correlation (Makowski et al. 2020). One measure of the strength of the connection is the number of people employed by small and big businesses, which shows a positive correlation. The indication 1 is also included in the profit margin. Changing one of the variables might have an impact on the other one, which is known as a positive correlation. Profit margins would narrow, lowering the return on invested capital. The return on invested capital would be determined by the profit margins of chemical firms of all sizes.
Conclusion and recommendation
According to the aforementioned research, UK chemical businesses' financial data is scrutinized in order to make investment decisions. The financial data must be analyzed in order to examine the performance of various factors. Four hundred and eighty-six pieces of information on chemical firms in the UK region were analyzed. This data included profit margins for small and big businesses as well as costs of production and the number of workers. To show the results, the data was arranged in a way that was suited to that purpose. In this study, the distribution of profit rates is explained using descriptive statistics and histogram analysis. In order to provide the mean, median, and standard deviation of the data, the descriptive statistics are taken into account. Small and large businesses alike might benefit from the regression tool's study of profit margins. Because it is a frequent technique for anticipating the company's performance for investment decisions, it is used to analyses the profit rate. The distribution profit rate analysis report compares the export operations of the producers. ROE and profit margins for small and big enterprises are also studied using chi-square and correlation tools. In order to make a well-informed investment decision, it is important to analyses the company's financial facts thoroughly before making a final decision.
References
Ali,Z.,Bhaskar,SBandSudheesh,K.,2019.Descriptivestatistics:Measuresofcentraltendency, dispersion, correlation and regression.
Airway, 2(3), p.120.http://www.arwy.org/article.asp?issn=2665-9425;year=2019;volume=2;issue=3;spage=120;epage=125;aulast=Ali
Bhering, L.L., 2017. Rbio: A tool for biometric and statistical analysis using the R platform.CropBreedingandAppliedBiotechnology,17(2),pp.187-190.https://www.scielo.br/scielo.php?pid=S1984-70332017000200187&script=sci_arttext
Daoud,J.I.,2017,December.Multicollinearityandregressionanalysis.InJournalofPhysics:Conference
Series(Vol.949,No.1,p.012009).IOPPublishing.https://iopscience.iop.org/
article/10.1088/1742-6596/949/1/012009/pdf
Gelman,A.andNolan,D.,2017.Descriptivestatistics. Financial analysis assignmentInTeachingStatistics.OxfordUniversity Press.
https://oxford.universitypressscholarship.com/downloadpdf/10.1093/oso/9780198785699.001
.0001/oso-9780198785699-chapter-3.pdf
Heck, D.W. and Moshagen, M., 2018. RRreg: An R package for correlation and regressionanalysesofrandomizedresponsedata.JournalofStatisticalSoftware,85(2),pp.1-29.https://cran.rapporter.net/web/packages/RRreg/vignettes/Heck_Moshagen_2018_JSS.pdf
Lang,H.,2016.Elementsofregressionanalysis.Stockholm:KTHMathematics.https://people.kth.se/~lang/regression_analysis.pdf
Makowski, D., Ben-Shachar, M.S., Patil, I. and Lüdecke, D., 2020. Methods and algorithmsforcorrelationanalysisinR.JournalofOpenSourceSoftware,5(51),p.2306.https://joss.theoj.org/papers/10.21105/joss.02306.pdf
Plonsky,L.andOswald,F.L.,2017.MultipleregressionasaflexiblealternativetoANOVAin L2 research. Studies in Second Language Acquisition, 39(3), pp.579-592.https://www.cambridge.org/core/journals/studies-in-second-language-acquisition/article/multiple-regression-as-a-flexible-alternative-to-anova-in-l2-research/61C0249F51E200C712D2DDF7D489C835
Appendices
Appendix1:Descriptivestatisticsofprofitratedistribution
Appendix2:RegressionforlargeandSMEcompanies
Appendix3:Descriptivestatisticsofexportactivities
Appendix4:ReturnoncapitalthroughChisquare
Appendix5:CorrelationoflargeandSMEcompanies
Appendix6:Regressionanalysisofassociatedquantitativevariables
Appendix7:Correlationofallvariablesinthedataset