
Financial Ratio Analysis: BT And BskyB Group
Question
Task: Provide a detailed report on the significance of finance ratio analysis by taking in account the instances of two different organizations.
Answer
Introduction
It is based upon the principles of ratios that most of the activities in a company are analyzed and computed. It is by referring to the financial statements of a company that the financial ratios are calculated to analyze the present direction and financial positions. The crucial data which are majorly considered while calculating the financial ratios are cash flow statement, balance sheet, and income statement. By conducting this process, the management team in the company could ascertain the point of strengths and weaknesses by which the company would predict the future course of the company and its business. The background of the company and its operational history would also play a crucial role in predicting the possible outcomes in the future.
The companies that are listed in the US stock exchange could be analyzed by the normal citizen and for this, the data are being made available via an online platform. We have taken into account, two companies which are listed in the stock exchange of the United States of America. The media of online platform is utilized by the experts to extract the financial history of the selected companies. The financial data for three years are taken into consideration to analyze the financial ratios relevant to the selected companies. The person who has decided to ascertain the current position of the company hence requires only the financial data from past three years in this context. The financial data would provide the team with crucial data that would help in conducting the financial ratio analysis in a very efficient and relevant way. It is the financial ratios calculated or derived from these downloaded financial data that would be utilized to conduct the ratio analysis (Denny, 2003). In the below section of this report on financial ratio analysis, the formulae required to calculate the financial ratios are mentioned down.
The evaluation of the observations could only be done after the relevant ratios are being derived from the provide financial data. The calculation of the financial ratios should be considered only the initial stage of the process since without the interpretation and the consecutive analysis based on it the whole motive could not be attained. A detailed comparison between the selected companies would be conducted by relying on the interpretations made from the calculated financial ratio analysis. The ratio results may change as per the variation in various parameters and standards set in the accounting principles. A standardized parameter is set for the financial ratio and hence they could be used to conduct the financial ratio analysis of every respective selected company. In the below section of this report on financial ratio analysis, the interpretations are being made by the comparison of the calculated ratios concerning the standard parameters in the global context. Various decisions or strategies to be drafted to balance the financial ratios for each company is described in the below section of this report on financial ratio analysis.
In the conclusion section of this report on financial ratio analysis, the company which is performing better than that of the other companies is noted down. While providing a detailed interpretation of the calculated financial ratio, the reader is provided with the recommendation by which the company performs better as compared to the other selected companies. While conducting the financial ratio analysis, the significance of calculating the financial ratios could be revealed through some demerits exist along with its merits. A comprehensive effort would be taken to depict these demerits and it is at the end of this report on the financial ratio analysis that the relevant recommendations are provided.
As per the statement made by Oshoke & Sumana in the year of 2015, the value of financial ratio would aid in analyzing the financial statements. A standard benchmark is selected taking into consideration various similar companies operating in parallel markets working for a considerable period, is selected to evaluate the performance of the selected companies. In this report of financial ratio analysis, various kinds of ratios are taken into account to analyze the financial stature of each organization.
Background of the selected companies
BT Group Plc and BskyB Plc are the companies that are taken into consideration in this report on financial ratio analysis. Both of the companies are considered to be the major emerging countries in the economy of the United Kingdom. The comparison of the companies operating in the same environment and the same marketing conditions are hence taken into consideration in this financial ratio analysis report. In other words, it could be mentioned that both of the companies would belong to the same line of business. If taken into account the case of BT, it is one of the oldest communication companies in the global platform. The company has expanded its business and availability of its service up to 170 countries and hence its magnitude of operation should be considered an immense one. It was from the British Telecommunication plc established in the year of 1984 that the BT company has evolved itself to the present form. The company had evolved itself to the present stage in the year of 2001. It was investing most of its sources for the implication of most modern version of the technology in the company of BskyB which has helped in evolving it to the present position of the largest entertainment service entity. It is the reduced efficiency of the company in coping up with its contemporary environment and less access to the modern technology that both of them end up in making loss and hence merged to form the British Satellite Broadcasting and Sky Television Plc which could be dated back to the year of 1990 (Referenceforbusiness.com, 2016).
Profitability Ratios
As per the observation of Denny in the year of 2003, the value of the profitability ratio would help the company in ascertaining whether all the available resources are being utilized by the organization to its finest level. As per the opinion of Koen and Oberholster in the year of 1999, the profitability ratio is majorly used by the management team to ascertain the magnitude of accrued profit, the factors which are posing to be a potential barrier against the motive of making a profit, the factors which have even the slightest significance on the rate of profit-making, etc. Apart from the aforementioned factors, the profitability ratios could also be utilized for other motives like ascertaining and analyzing the efficiency of the operating system followed or installed in the organization (Robinson et al., 2015). There is no need to mention that the higher an organization is efficient, the higher the magnitude of profit will be.
Interpretation of Profitability Ratios
In the majority of the cases, the rate of profitability is observed to be higher when compared to the normal benchmark made by similar companies. To calculate the business profitability, the value of the ratios mentioned in the below section of this report on financial ratio analysis should be calculated.
ROCE = [PPBIT / (Non-Current Liabilities + Equity)] * 100
Operation Profit Margin = [PBIT / Sales] * 100
Net Profit Margin = [Net Profit / Sales] * 100
ROCE
|
BT Group Plc |
BskyB Group Plc |
|||||
|
|
2013 |
2014 |
2015 |
2013 |
2014 |
2015 |
|
PBIT |
3338 |
3145 |
3480 |
1291 |
1161 |
972 |
|
NCL |
17537 |
17803 |
18675 |
3016 |
2858 |
7930 |
|
Equity |
-262 |
-592 |
808 |
1012 |
1072 |
3165 |
|
ROCE |
19.32 |
18.27 |
17.86 |
32.05 |
29.54 |
8.76 |
The magnitude of the percentage is articulated by using the percentage and is referred to as the parameter of employed capital. The value of this ratio would help in determining the magnitude of the business or the firm. The higher the value of the ratio would be, the higher it would signify the magnitude of the organization and its processes. If the numerical value of the ratio is observed below a standard level, it could be ascertained that the business is accordingly small. It should be ascertained that the negative value would signify the magnitude of loss that occurred to the company in the respective year. If taken into account the local economy of United Kingdom, it could be observed that the industrial and corporate sector deals with various sectors and the numerical value of ROCE would lie in between the range of 5% and 15% (The Student Room, 2016). It could be ascertained from the calculated values that the organization of BskyB Group Plc could be considered a better one as compared to the BT Group Plc in the financial year of 2013 and 2014. If looked at the graphical representation of the ROCE for both of the companies, a falling trend could be observed. Let us have a detailed look over the graphical representation provided in the below section of this report on financial ratio analysis.
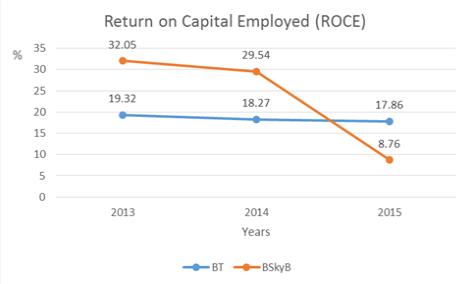
Fig 1.1: ROCE
Though the ROCE graph for both of the companies could be observed to be in a downward trend, the dip in the value of BskyB Group Plc could be states as the worst one. Hence in the financial year of 2015, the BT company could be stated as a better company than the BskyB Group Plc.
Operation Profit Margin
|
BT Group Plc |
BskyB Group Plc |
|||||
|
|
2013 |
2014 |
2015 |
2013 |
2014 |
2015 |
|
PBIT |
3338 |
3145 |
3480 |
1291 |
1161 |
972 |
|
Sales |
18253 |
18287 |
17979 |
7235 |
7632 |
9989 |
|
OPM |
18.29 |
17.20 |
19.36 |
17.84 |
15.21 |
9.73 |
By observing the financial data of both the companies in the year 2014, the OPM ratio seems to fell in the financial year of 2014. Though the company of BT group has displayed some improvement in the later financial year of 2015, the BskyB group displayed the same trend of falling values. In the below section of this report on financial ratio analysis, the trend of the Operating Profit Margin for both of the companies in the financial years of 2014 and 2015 could be observed. Let us have a detailed look over it.
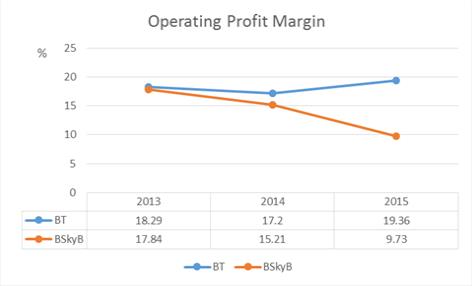
Fig 1.2: Operating Profit Margin
Net Profit Margin
|
BT Group Plc |
BskyB Group Plc |
|||||
|
|
2013 |
2014 |
2015 |
2013 |
2014 |
2015 |
|
NP |
2088 |
2018 |
2135 |
979 |
865 |
1952 |
|
Sales |
18253 |
18287 |
17979 |
7235 |
7632 |
9989 |
|
OPM |
11.44 |
11.4 |
11.87 |
13.53 |
1.33 |
19.54 |
The ratio observed in this calculation is compared to the ratio of revenue obtained from the sales. The whole numerical value is being expressed in the form of percentage and signifies the magnitude of profit accrued from the activity of sales. While considering the ratio of Net Profit Margin for both of the companies, it could be observed that the BskyB has a better trend as compared to the BT group and thus could be stated as a more profitable one. Though the value of Net Profit Margin had decreased to a considerable level in the financial year of 2014, the trend has increased to a significant level in the year of 2015and thus could surpass the average trend of the BT group. It may be the strategies about the operations followed in a company that would have caused the dip in the net profit in the company. The factors existing in the external environment of the company could also create a direct impact over the magnitude of Net Profit margin and the same could have contributed to the phenomenon of di experienced in the year 2014. Both the trends followed by the company in the context of net profit margin are described in the below section of this report on financial rate analysis. Let us have a detailed look over it.
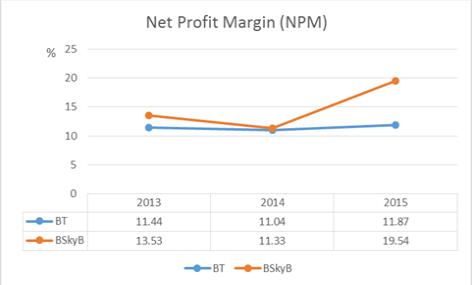
Fig 1.3: Net Profit Margin
Liquidity and efficiency ratios
It is the liquid resources retained by the organization, which helps the companies in carrying out the business activities on a daily basis. The liquid assets possessed by the company could be easily converted into the required sum of cash as per the current rate in the market (Mayes and Shank, 2007). It is by referring to the liquidity ratio displayed by an organization that its ability to repay its current dept on instant demand is analyzed. It could also be tagged under the category of current assets. To conduct a full liquidity analysis the process of cash budgeting is being carried out in the organizations, though they are referred to the parameter of current liabilities and current assets while calculation. The process of determining the liquidation power of the organization could be analyzed in a very easy way. The two major kinds of variables to measure the liquidity power is mentioned in the below section of this report on financial ratio analysis.
Quick Ratio = (Current Assets – Inventory)/ Current Liabilities
Current Ratio = Current Assets / Current Liabilities
The variable of the fixed assets turnover could also be calculated in a similar method.
The efficiency could be calculated by (Turnover / Non-Current Assets).
Current Ratio
In this variant of the financial ratio, the values relating to the cash marketable security account inventories (stock) and receivables (debtors) are taken into account. The value of the account payables including the overdrafts or the shorter loans, accrued expenses, and the accrued taxes could be taken into account under the tag of the current liabilities. If the magnitude of the ratio is observed to be above two, then it could be considered a favorable condition. Though the downward trend in the current ratio would imply the financial difficulties in the company. It was by the opinion of Hendy in the year 2011 that the ratio of two is sufficient to prove that the existing current asset is appropriate to pay for the existing liabilities in the company.
|
BT Group Plc |
BskyB Group Plc |
|||||
|
|
2013 |
2014 |
2015 |
2013 |
2014 |
2015 |
|
CA |
4621 |
5706 |
7471 |
2569 |
2573 |
4559 |
|
CL |
7551 |
7687 |
7708 |
2317 |
2519 |
4204 |
|
Current |
0.61 |
0.74 |
0.97 |
1.11 |
1.02 |
1.08 |
In the above-provided table, it could be observed that the current ratio for both the companies is below the standard level. If compared to the performance of the BT group, the current ratio of BskyB could be observed at a better level. Though it should also be noticed that the trend would reveal a different story in which the BT group is in a rising trend whereas the BskyB is in a falling trend. This would make it evident that the BskyB group is facing some financially related turmoil in the financial year of 2014. If this aspect is considered, the BT company would be considered as a much more preferable company and is expected to perform better. The trend of the current ratio is portrayed in the below section of this report on financial ratio analysis.
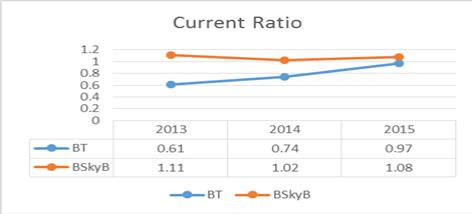
Fig 1.4: Current Ratio
Quick or Acid Test ratio
If the current assets of a company would be taken into account, it could be observed that the inventories are one of the least liquid elements. It is on the factor of current assets that most of the companies face a high probability of risks. The ability of the company to pay its overdrafts or short-term debts by relying on the sale of inventories is taken into consideration under this ratio. If the ratio is calculated to be one, then the liquidity could be ascertained as the highest (nibusinessinfo.co.uk, 2016). The finances of such organizations could be considered a very solid and stable one.
|
BT Group Plc |
BskyB Group Plc |
|||||
|
|
2013 |
2014 |
2015 |
2013 |
2014 |
2015 |
|
CA |
4621 |
5706 |
7471 |
2569 |
2573 |
4559 |
|
Inventory |
103 |
82 |
94 |
548 |
546 |
847 |
|
CL |
7551 |
7687 |
7708 |
2317 |
2519 |
4204 |
|
Quick |
0.60 |
0.73 |
0.96 |
0.87 |
0.80 |
0.88 |
It could be observed from the calculation provided in the above section of this report on financial ratio analysis that the quick acid ratio of both the companies are considered and thus could be ascertained that the both of the companies are going through very weak financial health. Although if the trend is taken into consideration, it could be observed that the BT group’s performance is much more constant than that of the BskyB group. Though the trend of the BskyB group is in the raising trend, the factor of inconsistency would lead to a higher probability of fall in values. Thus, from the perspective of an investor, the BT group is much more preferable. The fact that the required ratio of 1:1 is attained by the company could be considered as a green signal for the investors and other stakeholders (Accaglobal.com, 2016). The graphical representation of the trend followed in the acid test ratio is depicted in the below section of this report on financial ratio analysis.
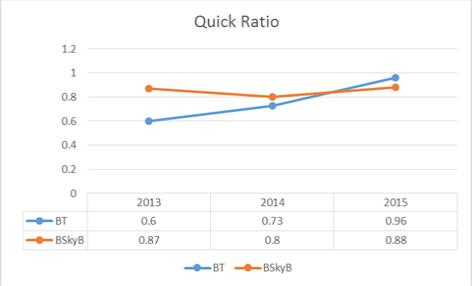
Fig 1.5: Quick Ratio
Fixed Asset Turnover
The level to which the use of the fixed assets is being done to augment the level of sales is measured using these parameters. The condition would be more favorable as the fixed asset increase for the company. The particular relation could be exploited by the company for its profit by postponing the exchange of fixed long-term assets (Mayes and Shank, 2007). If the other factors in the financial context could be considered constant, the value of the fixed asset retained by the company would plunge.
|
BT Group Plc |
BskyB Group Plc |
|||||
|
|
2013 |
2014 |
2015 |
2013 |
2014 |
2015 |
|
Sales |
18253 |
18287 |
17979 |
7235 |
7632 |
9989 |
|
NCA |
20205 |
19192 |
19483 |
3776 |
3876 |
10799 |
|
OPM |
0.90 |
0.95 |
0.92 |
1.92 |
1.97 |
0.92 |
By the calculation provided in the above table of this report on financial ratio analysis, it could be observed that the performance of the BT group is quite consistent, though the trend followed by the BskyB is in the plunging direction. If referred to the below section of this report on financial ratio analysis the graphical representation of the fixed asset turnover could be traced. If the financial data of the year 2014 is observed, the investor would get attracted to the BskyB group, though the trend in the year 2015 would change their decision. From an overall perspective, the BskyB could be considered as a better option for the investors.
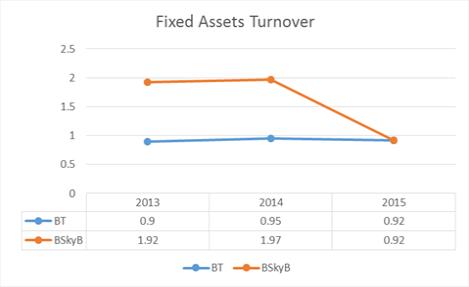
Fig 1.6: Fixed Asset Turnover
Demerits of Using Ratios
It depends on the ideology and approach of the management in a specific organization by which the asset valuation is conducted. As per the approach, the asset evaluation could be classified into three. The first approach could be mentioned as first in first out (FIFO), average cost method, and Last in last out (LIFO). The evaluation of closing stock is done in a very different way depending on each approach. Though the improper knowledge regarding it would make some misinterpretations among the employees.
The approach of ratio analysis could not be directly implied by the companies which are operating similarly and similar market since the analysis of the mere accounts would not provide the actual scenario to the readers. Though as per the guidelines provided in the international standards of financial accounting, the comparison between the financial ratios could be done for the nominal purpose.
The process of the ratio analysis could be well impacted by the seasonal and temporary factors and this is because the whole evaluation is just based on the numerical figures. The evaluation of the numerical figures would not provide the idea regarding the seasonal or temporary fluctuation in the operational market of the company. The impact and actual significance of the financial ratios would fluctuate as per the situations of the particular companies. The parameters and standards set in different countries for evaluation are different and hence the same ratios could be described differently at different places.
Conclusion
It could be ascertained from the above-provided report on the financial ratio analysis that the instances in which the numerical value of the ratios plunges below a standard limit, the condition of the related company could be considered relatively poor. Though the desirability of the investment would not depend on the numerical value of the ratio since the contextual condition of the economy would also matter in this instance. The level to which the ratio vacillates from the descent parameter is taken into account while selecting for investment. Let us take an instance that a company has a financial ratio of 2.4 whereas the latter company has a financial ratio of 2.8 keeping in mind that the standard level is 2. Since the second company has a larger gap from the standard measures, it could be considered much preferable and favorable for the investors.
Only if the calculated ratios would pertain to a longer et of time, it could be considered be reliable data. The ratios would come only handy if the companies working in a similar market with the same mode of operation could be considered for comparison. Even a little positive change in the financial ratio would indicate towards the betterment of the business conducted by the company which is taken into account. It is the previous data of the company which is majorly taken into account for financial ratio analysis.
Reference List
Accaglobal.com. (2016). Ratio analysis | ACCA Qualification | Students | ACCA Global. [Online] Available at: https://www.accaglobal.com/an/en/student/exam-support-resources/fundamentals-exams-study-resources/f2/technical-articles/ratio-analysis.html
Anon, (2016). [Online] Available at: https://www.btplc.com/Sharesandperformance/Annualreportandreview/pdf/2014_BT_Annual_Report.pdf
Anon, (2016). [Online] Available at: https://corporate.sky.com/documents/publications-and-reports/2013/annual-report-2013.pdf
Anon, (2016). [Online] Available at: https://corporate.sky.com/investors/annual-report-2014 [Accessed 20 Mar. 2016]
Anon, (2016). [Online] Available at: https://corporate.sky.com/investors/annual-report-2015
Anon, (2016). [Online] Available at: https://www.btplc.com/Sharesandperformance/Annualreportandreview/pdf/2013_BT_Annual_Report_smart.pdf [Accessed 20 Mar. 2016]
Btplc.com. (2016). Annual reports 2015. [Online] Available at: https://www.btplc.com/Sharesandperformance/Annualreportandreview/ [Accessed 20 Mar. 2016]
Crozierjones.co.uk. (2016). Common accounting ratios for measuring Business Performance. [Online] Available at: https://www.crozierjones.co.uk/WebPage/eQEAAA/Common-accounting-ratios-for-measuring-Business
Denny, R. (2003). Accounts for solicitors. London, U.K.
Hendy, P. (2011). Key accounting ratios for measuring business performance. [Online] PAH Accountants. Available at: https://wiltshireaccountants.co.uk/accounting-ratios-measuring-a-business
Koen, M. and Oberholster, J. (1999). Analysis and interpretation of financial statements. Kenwyn: Juta.
Mayes, T. and Shank, T. (2007). Financial analysis with Microsoft Excel. Mason, OH: Thomson/South Western
Oshoke, A., and Sumaina, J. (2015). Performance Evaluation through Ratio Analysis. Journal of Accounting and Finance Management, Vol. 1 No. 3. Retrieved from https://www.iiardonline.org/journals/jafm/PERFORMANCE%20EVALUATION.pdf
Referenceforbusiness.com. (2016). British Sky Broadcasting Group Plc - Company Profile, Information, Business Description, History, Background Information on British Sky Broadcasting Group Plc. [online] Available at: https://www.referenceforbusiness.com/history2/88/British-Sky-Broadcasting-Group-Plc.html [Accessed 23 Mar. 2016]


