
Financial Statement Analysis Assignment Case of Adairs
Question
Task: Access the annual reports of Adairs Ltd for the years 2017 and 2019 and prepare financial statement analysis assignment including?
A. Cashflow Analysis: Analyse the Statements of Cash Flows of your allocated company for 2019 (comparing to earlier years where relevant). Use the analysis checklist questions and points provided in Jennifer’s Topic 4 workshop to guide your analysis. You should also provide brief information about any significant business events and activities that help explain your observations from the cash flow statements and provide a conclusion evaluating the health of the company from a cash flow perspective. B. Calculation of Ratios:Calculate the following six (6) ratios for the three years 2017 - 2019 (2016 financial information will assist you in calculating averages, where necessary). You are to use only those ratio formulas that are contained within the unit resources; i.e. in the prescribed textbook, study guide, Jennifer’s workshop slides and other content provided via the unit’s Learning Pathway.
1. Return on equity
2. Operating Profit Margin
3. Inventories turnover period
4. Current ratio
5. Debt to assets ratio
6. Interest cover ratio
For each of the ratios, you should:
- write out the ratio formula that you used;
- provide the source (textbook, study guide etc.) for that formula;
- show the numbers that you used to calculate your answer. These numbers should only come from the financial statements or notes to the accounts, not earlier sections of the annual report; and
- show your answer. These should be given to two decimal places and given in a format that indicates whether it is in %, times, ratio or days.
C. Working Capital Management Analysis: Evaluate the working capital management of your allocated company. Start your analysis by calculating the company’s cash conversion cycle (CCC) for the three years 2017, 2018 and 2019 using relevant ratios you calculated in Part B and additional ratios available to you in your company’s folder in the ACC00724 MySCU site. Using these figures, evaluate the CCC and each of the areas that make it up with a view to identifying areas of strength and/or weakness. Give brief suggestions for actions the company could take to make improvements, noting any potential benefits and costs.
D. Further Company Analysis:Based on the ratios over three years you have calculated, along with additional ratios available in your company’s folder on the ACC00724 MySCU site, analyse and evaluate the company’s profitability, efficiency, liquidity, financial gearing and investment performance. Ensure you also provide an overall evaluation that links together your major findings for each category of ratios. Note: Do not repeat any detailed analysis you may have done in Part C to analyse and evaluate efficiency in Part D. However, you can use your conclusions from the Part C analysis to inform your evaluation of efficiency, other relevant areas of performance/position and overall.
Answer
PART A- Cashflow Analysis
The following table provided in the financial statement analysis assignment contains the key highlights of the cash flow statement for the reporting period 2017 to 2019.
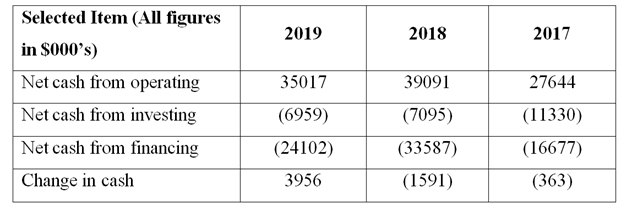
Net Cash from Operating – A positive observation is that the company is able to generate a healthy cash flow by engaging in operating activities. Infact when compared with FY17, the cash generated from operating is higher in both FY18 and FY19. This increase in the operating cash flow in FY18 and FY19 is attributed to the rising net income which the company witnessed (Adairs, 2019). This increasing trend implies that the risk of company facing cash crunch is decreased.
Net cash used in Investing –The net cash used in investing activities shows a decreasing trend which can potentially be a concerning observations since lesser amount of money is being invested in future growth of company. However, the cash outflows in FY17 and FY18 were higher owing to the company opening first store in New Zealand and expanding operations in New Zealand respectively (Adairs, 2017). The FY19 cash outflows on investing remains low owing to the difficult macroeconomic conditions prevailing in which the company wishes to be prudent in opening new stores (Adairs, 2019).
Net cash used in financing –As indicated in the table above provided in the financial statement analysis assignment, there is a net cash outflow arising from financing activities. A positive impact is that during the period under consideration, there has been no net incremental borrowing. Infact, in FY18, the company made a repayment of $17 million to the long term loan and has reduced the overall leverage in the balance sheet. Majority of the cash outflows from financing are attributed to dividend payment by the company. Over the given years, this has seen an upwards trend which is positive for the shareholders (Adairs, 2019).
Overall Health of Company –There should be positive and stable cash flow generated from operating activities for a healthy business. Also, a portion of this cash flow must be used for investing purposes so as to ensure that future growth of business can occur. Finally, a stable business would also pay a dividend to the shareholders while ensuring that the balance sheet does not get over leveraged. All the above attributes noted in the financial statement analysis assignment are being fulfilled by the existing business and hence we can conclude that the company is in a healthy state from a cash flow perspective.
PART B – Calculation of Ratios
1) Return on Equity= (Net profit after tax and any preference dividend/Average shareholders’ equity)*100
Source: Lecture Slides
Average shareholders’ equity in $000’s for 2017 = (100312+95590)/2 = 97,951
Average shareholders’ equity in $000’s for 2018 = (116180 +100312)/2 =108,246
Average shareholders’ equity in $000’s for 2019 = (118317+116180)/2 = 117,248.5
Return on Equity for 2017 = (21017/97951)*100 = 21.46%
Return on Equity for 2018 = (30561/108246)*100 = 28.23%
Return on Equity for 2019= (29643/117248.5)*100 = 25.28%
2) Operating profit margin= (Operating profit/Sales)*100
Source: Lecture Slides
The operating profit is not mentioned in the financial statements and hence it is computed for each year by addition of interest expenses to profit before tax.
Operating profit margin for 2017 = ((28921+1946)/264964)*100 = 11.65%
Operating profit margin for 2018 = ((43816+1489)/314769)*100 = 14.39%
Operating profit margin for 2019 = ((42286+1237)/344430)*100 = 12.64%
3) Inventories Turnover Period= (Average Inventory held/Cost of sales)*365 Source: Lecture Slides
Average inventories held in $000’s (2017) = (32992+26272)/2 = 29,632
Average inventories held in $000’s (2018) = (33568+32992)/2 = 33,280
Average inventories held in $000’s (2019) = (42782+33568)/2) = 38,175
Inventories turnover period for 2017 = (29632/108163)*365 = 100.00 days
Inventories turnover period for 2018 = (33280/125119)*365 = 97.09 days
Inventories turnover period for 2019 = (38175/147306)*365 = 94.59 days
4) Current Ratio= Current Assets/Current Liabilities
Current Ratio as on June 30, 2017 = 51793/32022 = 1.62:1
Current Ratio as on June 30, 2018 = 54451/34140 = 1.59:1
Current Ratio as on June 30, 2019 = 68708/46567= 1.48:1
5) Debt to Assets Ratio= Total liabilities/Total Assets
Source: Study Guide
Debt to assets ratio as on June 30, 2017 = 92369/192681=0.48
Debt to assets ratio as on June 30, 2018 = 78813/194993 = 0.40
Debt to assets ratio as on June 30, 2019 = 91957/210274 = 0.44
6) Interest Cover Ratio= Operating Profit/Interest Expense
Source: Lecture Slides
The operating profit is not mentioned in the financial statements and hence it is computed for each year by addition of interest expenses to profit before tax.
Interest cover ratio for 2017 = (28921+1946)/1946 = 15.9 times
Interest cover ratio for 2018 = (43816+1489)/1489 = 30.4 times
Interest cover ratio for 2019 = (42286+1237)/1237 = 35.2 times
PART C – Working Capital Management Analysis
Using the formula listed below within this financial statement analysis assignment, cash conversion cycle for the company may be obtained.
It is noteworthy that for Adairs Limited, there are no credit sales and hence the average settlement period for debtors is zero. Also, the information for average settlement period for creditors is available in the additional ratio data present.
Cash Conversion Cycle for 2017 = 100 -41.77 = 58.23 days
Cash Conversion Cycle for 2018 = 97.09 -46.31 = 50.78 days
Cash Conversion Cycle for 2019 = 94.59 + 0 - 41.72= 52.87 days
There is no clear trend with regards to CCC as in 2018 there is improvement in this regards followed by slight deterioration in 2019. A lower CCC is preferable for a company since it would imply that company would have lower working capital requirement and hence the associated finance cost would become lower. In regards to the company selected in the present context of financial statement analysis assignment, a big advantage from the working capital management perspective is that average settlement period for debtors is zero which would imply all cash sales. This means that only the inventory turnover period and average settlement period for creditors need to be managed for enhancing operational efficiency (Damodaran, 2015).
The lowering of CCC is derived by the lower inventory turnover period. This is an indicator that the company is able to convert the available finished inventory into sale at a faster rate and by consuming lower time. Additionally, there has been some improvement on the average settlement period for creditors which has expanded and hence the company has a higher credit period available to clear the account payables. All these developments in the context of working capital auger well for the company as these would lead to meaningful reduction in working capital (Ross et. al., 2016).
In the future, the company ought to ensure that there is further improvement in working capital management therebyreducing the working capital even further. In this context, the inventory turnover period should be reduced further by ensuring that the inventory holding period is reduced. For achieving this, the product mix may be altered and also discounts may be offered for goods which are not sold for long period. Also, the supplier payment terms must also be continuously improved so as to increase the average settlement period of creditors. The company can also diversify the suppliers in order to enhance the competition between suppliers and maximise the credit period offered (Damodaran, 2015).
PART D – Further Company Analysis
The company analysis of financial performance has been carried in the wake of financial ratios provided and also the ones calculated in Part B of financial statement analysis assignment.
Profitability
In this regards, a clear trend fails to emerge since FY18 operating profit margins were higher than the corresponding levels in FY17 but the increase was not witnessed in FY19. The profit margins derived during FY17 were lower than normal because of the poor first half that the company had on account of difficult trading conditions. In the second half of FY17, the company opened their first store in New Zealand which resulted in higher expenses and thereby lowering the profitability margins (Adairs, 2017). The falling operating profit margins in FY19 may be attributed to the drop in gross margins. Some of the key reasons responsible for the same are depreciation of AUD, bottlenecking of supply chain and inclusion of the postage costs in cost of goods for online costs. The supply chain issues were suffered as the company continued to witness a significant growth in demand which the existing suppliers failed to fulfil leading to lowering of margins since other suppliers had to be explored (Adairs, 2019).
Efficiency
In Part C, discussions done in the financial statement analysis assignment regarding working capital management have already been carried out. These indicate that there is an overall decrease in the cash conversion cycle from FY17 to FY19. This has been achieved at the back of reduction in inventory turnover period as company has been able to convert inventory into sales in lesser time. Further, there has been incremental improvement in the company’s ability to derive revenue from deployment of capital. From FY17 to FY19, there is an increasing trend witnessed in sales revenue to capital employed ratio (Adairs, 2019).
Liquidity
One critical ratio for measuring liquidity of a company is current ratio. This ratio was 1.62 as on June 30, 2017 and it has declined to 1.48 as on June 30, 2019. The acid test ratio for FY17-FY19 has remained more or less stable. It is evident that there has been deterioration in the corresponding liquidity related ratios for the company in the given period. However, liquidity position even at its lowest point remains strong since current ratio is 1.48 and hence the company can easily satisfy the current liabilities (Adairs, 2019). Even though the acid test ratio is less than 1 but it does not pose any risk since for the given industry, it is on expected lines. Hence, from the liquidity perspective, the performance of the company is quite satisfactory.
Financial Gearing
The debt to assets ratio has come down at the end of FY18 when compared with the corresponding value at the end of FY17. The key reason for this improvement is $17 million cash outflow towards repayment outstanding debt (Adairs, 2017). There has been a slight increase in the debt to assets ratio at the end of June 30, 2019 but the amount is lower than the corresponding value at the end of FY17. This clearly represents that majority funding of assets is based on equity and not debt. This implies lower financial risk associated with the business. Another relevant ratio in this regards is the interest coverage ratio. Despite some deterioration in this ratio over the period considered, the company is comfortably placed to honour the debt repayments and corresponding interest commitments (Ross et. al., 2016).
Market Performance
A key attribute in this regards is the dividend per share declared for the shareholders over time. If this is considered over the given period, it is evident that there has been an increase in excess of 75% which is a positive development for shareholders. This rise in dividend per share is consistent with the rising EPS over the given period. However, the P/E ratio for the stock is quite low even though earnings have seen consistent increase along with reduction in debt. In FY18, there was a jump in the stock market which may be driven by the future potential of the New Zealand market. However, considering the lacklustre Australian business outlook in 2019, the stock seems to have been de-rated again as future growth may be muted (Adairs, 2019).
Conclusion
The findings obtained in the financial statement analysis assignment signify that it is apt to infer that the company has seen the best performance in almost all regards in FY18. FY17 was a difficult year for the company on almost all counts while FY19 is better than FY17. On all counts, the business performance seems to be quite stable and there is no foreseeable risk of any meaningful liquidity or solvency risk. Going forward the company should focus on continuing the revenue and net income growth so that the valuation of the company may improve.
References
Adairs 2017, Annual Report 2017, viewed 23August 2020
Adairs 2019, Annual Report 2019, viewed 23 August 2020
Damodaran, A 2015, Applied corporate finance: A user’s manual, financial statement analysis assignmentWiley, John & Sons, New York
Ross,SA, Tryaler,R, Bird, R,Westerfield, RW & Jorden,BD 2016, Essentials of Corporate Finance, McGraw-Hill, New York


