
Investment Analysis Assignment: Case Analysis Of Malakoff Corporation Berhad & Petronas Gas Berhad
Question
Task:
The purpose of this investment analysis assignment is to enhance learners’ skills in analysing risk and return of stock investment.
REQUIREMENT
Choose TWO companies listed in the energy sector of the Main Market of Bursa Malaysia. Collect the companies’ monthly stock prices for the period from 1 January 2019 to 31 December 2019. Compare the risk and return of the companies’ stocks.
Answer
1. Introduction
1.1 Malakoff Corporation Berhad
Malakoff Corporation Berhad, selected in the investment analysis assignment, is an energy producer with the primary operations being power generation, water desalination and other maintenance services. Malakoff is a public listed company on Bursa Malasia and is traded as MYX: 5264. It started its operations in 1975. The Malakoff Corporation is the largest independent producer of power in Malaysia. The company is chaired by Datuk Haji Hasni Harun. The company owns a power production capacity of 5822 MW with 6 power plants which run oil, coal and gas. The power capacity of the company is held through various subsidiaries and partnering companies:
- Tanjung Bin Energy Power Plant: Malakoff owns 100% equity in Tanjung. The total capacity of Tanjung is about 100 MW.
- Sev Power Plant: 93.75% equity is held by Malakoff Corporation with the total capacity of the plant being 1303 MW.
- GB3 Power Plant: 75% equity stake of Malakoff. The power capacity of the plant is 640 MW.
- Prai Power Plant: 100% equity stake of Malakoff. The power capacity is 350 MW
- Tanjung Bin Power Plant: 90% of the equity stake is held by Malakoff Corporation. The plant has a capacity 2100 MW
- Kapar Power Plant: Malakoff owns 40% equity in the Kapar Power Plant. The power plant has a capacity of 2200 MW.
Further, the company owns a combined 588 MW power capacity plants in Saudi Arabia, Bahrain and Oman.
Financial Overview
Malakoff recorded a revenue of RM 7.42 billion in 2019. The revenue for the company has steadily increased over the last few years, increasing from RM 5.3 billion in 2015 and RM 7.35 billion a year ago. The company had a net profit of RM 320 million in 2019, however this number was a drop from RM 452 million in the year 2015. In terms of creating value for its investors, Malakoff had a return on equity of 5.81% in 2019 which was an increment over last year’s ROE of 4.86%, however, a drop from 7.85% in 2015. On a similar note, the return on assets of the firm stood at 1.21%, up from 0.95% in 2018 and down from 1.53% in 2015. The earnings per share of the company in 2019 was 6.55 sen per share which is 17% higher than the 2018 value. Also, the net assets of the company were at RM 6.67 billion.
1.2 Petronas Gas Berhad
Petronas Gas Berhad is one of the leading Gas Infrastructure and utilities companies of Malaysia. The company primarily operates in gas process, transportation and utilities. The company started its operations 1983 and currently employs 1829 employees. It is chaired by AdifZulkifli and the CEO is Kamal Bahrain Ahmad. The company has its headquarters in Kuala Lumpur. There are eight operating sites around the country out which there are two gas processing complexes situated in Kertih and Santong, two facilities for utilities business situated at Kertihand Gebeng and two facilities for regasification are situated at Sungai Udang and Johor. The firm has over 2623 km of pipeline spread across the peninsula of Malaysia. The following points outline the operations of the company:
- Gas Processing: This segment is responsible for processing the upstream natural gas of Petronas which is sourced from an offshore location and is converted into sales gas, ethane, butane and propane.
- Gas Transportation: This segment of the company is responsible for transporting the sales gas to the end customers using a pipeline network, viz. Peninsular Gas Utilisation (PGU) and Pengerang Gas Pipeline (PGP).
- Regasification: The LNG gas is converted to salesgas. The imported LNG is stored in LNG regasification terminal Sungai Udang’s storage units wherein the regasification exercise is conducted.
- Utilities: This segment works with various petrochemical businesses wherein electricity, industrial gases, utility products and steam are produced and supplied.
Financial Overview
Petronas Gas Berhad had a revenue of RM 5.4 billion in 2019 which was drop from RM 5.5 billion in 2018. The net profit of the company, however, increased from RM 1.8 billion in 2018 to 1.9 billion in 2019. The company had 20% debt funding in 2018 which marginally increased to 22% in 2019. The company had earnings per share of 97.8 sen per share in 2019 which was up from 90.6 sen per share in the year 2018. The dividend distributed by the firm was 82 sen per share for the year 2019 which was also an increase from 72 sen per share in 2018.
The following table captures the segment wise financial position of the company:
|
Segment |
Year |
Revenue |
COR |
Gross Profit |
|
Gas Processing |
2018 |
1571 |
931 |
639 |
|
2019 |
1702 |
885 |
816 |
|
|
Gas Transportation |
2018 |
1360 |
342 |
1018 |
|
2019 |
1152 |
353 |
799 |
|
|
Regasification |
2018 |
1245 |
547 |
698 |
|
2019 |
1237 |
626 |
611 |
|
|
Utilities |
2018 |
1321 |
1140 |
180 |
|
2019 |
1365 |
1205 |
160 |
2. Calculations
2.1 Malakoff Corporation Berhad
The Malakoff Corporation Berhad trades on the Bursa Market as MYX: 5264. There are almost 4.8 billion shares of the company. The required calculations pertaining to the shares of Malakoff Corporation Berhad have been presented in the following sections:
- Monthly Return: The return of a stock of a company between two periods can be calculated using the following relation: [(S2 – S1) * 100 / S1]
This expression yields the return from a share between two periods for which the closing prices where S2 and S1. This relation has been used to determine the month wise return of Malakoff’s shares. Further, the log return between two periods can be determined by ln (S2/S1). The values of monthly returns in terms of percentages and natural logarithm have been captured in the table below:
Date
Open
High
Low
Close
Monthly Return
Log Return
Jan-19
0.8
0.99
0.785
0.83
Feb-19
0.83
0.935
0.83
0.89
7.23%
0.070
Mar-19
0.895
0.96
0.88
0.91
2.25%
0.022
Apr-19
0.915
0.93
0.88
0.88
-3.30%
-0.034
May-19
0.88
0.905
0.785
0.83
-5.68%
-0.058
Jun-19
0.83
0.88
0.815
0.855
3.01%
0.030
Jul-19
0.855
0.93
0.845
0.9
5.26%
0.051
Aug-19
0.9
0.9
0.845
0.875
-2.78%
-0.028
Sep-19
0.875
0.88
0.83
0.86
-1.71%
-0.017
Oct-19
0.85
0.87
0.8
0.855
-0.58%
-0.006
Nov-19
0.855
0.91
0.84
0.895
4.68%
0.046
Dec-19
0.895
0.9
0.85
0.87
-2.79%
-0.028
- Average Return: The arithmetic average of the percentage returns for the period can be determined as the simple average of the return values. Further, the compounded monthly return rate over the 12 months of 2019 can be determined using the following relation:
Compounded Rate of Monthly Return: [(S2/S1)1/(n-1) – 1]
Using the above input relations on the closing share prices of Malakoff, we obtain the following values:
Average Return
Average Return (Log)
Compounded Monthly
0.51%
0.004
0.43%
- Standard Deviation: The standard deviation of a set of values essentially gives a measure of how dispersion of values around the mean of the values. The standard deviation for a set of values can be determined by using the following relation:
SD = sqrt [ ? (xi – u)2 / (n – 1)]
Using this relation for all the return values of the stock the following values can be obtained:
Monthly Return
(Xi - U)^2
Summation of (Xi - U)^2
Standard Deviation (Percentage)
0.0175
3.99%
7.23%
0.0045175
2.25%
0.0003026
-3.30%
0.0014473
-5.68%
0.0038310
3.01%
0.0006272
5.26%
0.0022615
-2.78%
0.0010794
-1.71%
0.0004937
-0.58%
0.0001186
4.68%
0.0017395
-2.79%
0.0010896
Using the same approach for the log returns, following values were obtained:
Log Return
(Xi - U)^2
Summation of (Xi - U)^2
Standard Deviation (Log Returns)
0.017240887
0.040
0.070
0.0042925
0.022
0.0003220
-0.034
0.0014290
-0.058
0.0039407
0.030
0.0006450
0.051
0.0022104
-0.028
0.0010530
-0.017
0.0004653
-0.006
0.0001022
0.046
0.0017176
-0.028
0.0010634
On using the excel formula for standard deviation one can obtain the same values as shown in the table below:
Standard Deviation (Return)
Standard Deviation (Log Return)
Standard Deviation (Price)
3.99%
0.040
0.025
2.2 Petronas Gas Berhad
The Petronas Gas Berhad trades on the Bursa Market as PETGAS. The required calculations pertaining to the shares of Petronas Gas Berhad have been presented in the following sections:
- Monthly Return: As mentioned in the preceding section the return of a stock of a company between two periods can be calculated using the following relation: [(S2 – S1) * 100 / S1]
The closing prices for the two periods are used in the expression above marked as S1 and S2. As done with the share prices of Malakoff, the same analysis is run for the closing share prices of Petronas Gas Berhad. The outcome of the said calculations has been put down in the table below:
Date
Open
High
Low
Close
Monthly Return
Log Return
Jan-19
19.18
19.24
17.28
18.08
Feb-19
18.28
18.48
17.66
18.08
0.00%
0.000
Mar-19
18
18.1
17.46
17.62
-2.54%
-0.026
Apr-19
17.7
17.9
17.44
17.68
0.34%
0.003
May-19
17.98
17.98
15.9
17.66
-0.11%
-0.001
Jun-19
17.8
18.5
17.1
17.36
-1.70%
-0.017
Jul-19
17.36
17.76
16.02
16.08
-7.37%
-0.077
Aug-19
16.02
16.44
14.74
16.08
0.00%
0.000
Sep-19
16.2
16.78
15.52
16.38
1.87%
0.018
Oct-19
16.48
17.1
16.12
16.64
1.59%
0.016
Nov-19
16.5
16.82
13.92
15.41
-7.39%
-0.077
Dec-19
15.47
17.89
14.95
16.52
7.20%
0.070
- Average Return: Again, the arithmetic average of the percentage returns for the period can be determined as the simple average of the return values. On the other hand, the compounded monthly return rate over the 12 months of 2019 can be determined using the following relation:
Compounded Rate of Monthly Return: [(S2/S1)1/(n-1) – 1]
Using the above input relations on the closing share prices of Petronas Gas Berhad, the following values were obtained:
Average Return
Average Return (Log)
Compounded Monthly
-0.74%
-0.008
-0.82%
- Standard Deviation: The standard deviation helps us quantify the level of dispersion of a set of values. As indicated in the previous section, the standard deviation for a set of values can be determined by using the following relation:
SD = sqrt [ ? (xi – u)2 / (n – 1)]
Using this relation for all the return values of the stock the following values can be obtained:
Monthly Return
(Xi – U) ^2
Summation of (Xi – U) ^2
Standard Deviation (Percentage)
0.017037623
3.94%
0.00%
0.0000546
-2.54%
0.0003260
0.34%
0.0001165
-0.11%
0.0000391
-1.70%
0.0000922
-7.37%
0.0044019
0.00%
0.0000546
1.87%
0.0006782
1.59%
0.0005410
-7.39%
0.0044265
7.20%
0.0063071
Using the same approach for the log returns, following values were obtained:
Log Return
(Xi - U)^2
Summation of (Xi - U)^2
Standard Deviation (Log Returns)
0.017421517
0.040
0.000
0.0000673
-0.026
0.0003087
0.003
0.0001346
-0.001
0.0000500
-0.017
0.0000798
-0.077
0.0046771
0.000
0.0000673
0.018
0.0007122
0.016
0.0005737
-0.077
0.0047045
0.070
0.0060463
On using the excel formula for standard deviation one can obtain the same values as shown in the table below:
Standard Deviation (Return)
Standard Deviation (Log Return)
Standard Deviation (Price)
3.94%
0.040
0.851
3. Comparison of the Two Stocks
Malakoff Corporation Berhad and Petronas Gas Berhad are two stocks under consideration. Thefollowing table captures a comparison of the two stocks along various dimensions:
|
Parameters |
Malakoff |
Petronas |
|
Current Price |
0.88 |
17.2 |
|
Range (52 Weeks, 2019) |
0.07 |
1.56 |
|
Market Capitalization |
4.3 billion |
34.03 billion |
|
|
|
|
|
Returns |
||
|
Price - Compounded Monthly Rate of Growth |
0.43% |
-0.82% |
|
Average Monthly |
0.51% |
-0.74% |
|
1 – Year |
4.80% |
-8.60% |
|
Standard Deviation of Returns |
0.039 |
0.039 |
|
|
|
|
|
Price Ratios |
||
|
Price / Sales |
0.62 |
6.2 |
|
Price / Cash Flow |
2.36 |
68.4 |
|
Price / Book |
0.7 |
2.62 |
|
Price / Earnings Ratio |
13.88 |
19.04 |
|
|
|
|
|
Profitability |
||
|
Net Profit Margin - 5 Year Average |
5.64% |
37.85% |
|
EPS |
0.06 |
0.98 |
|
Return on Equity |
4.92% |
13.77% |
|
Return on Assets |
1.34% |
9.39% |
|
|
|
|
|
Dividend |
||
|
Annual Payout Ratio - 2019 |
103% |
79.7% |
|
Dividend Growth |
-2.19% |
5.11% |
|
Dividend Yield |
7.44% |
4.19% |
|
|
|
|
|
Debt |
||
|
Debt - Equity Ratio |
1.94 |
0.32 |
|
Current Ratio |
2.05 |
1.76 |
|
Quick Ratio |
1.85 |
1.73 |
|
|
|
|
|
Efficiency |
||
|
Asset Turnover |
0.26 |
0.29 |
|
Inventory Turnover |
9.15 |
42.4 |
|
Revenue / Employee |
7.13 Million |
3 Million |
|
Receivable Turnover |
4.08 |
8.87 |
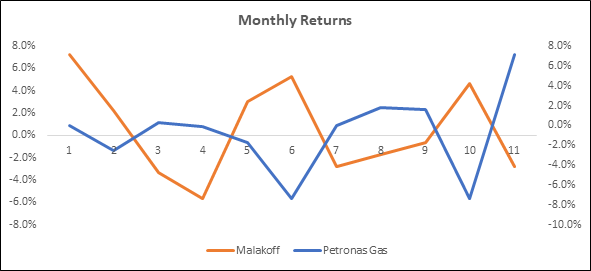
- Returns & Risk: The returns of the company favor Malakoff Corporation Berhad. While Malakoff has given a one-year return of 4.8%, Petronas Gas Berhad has resulted in a loss of 8.6%. The standard deviation marks the risk associated with the expected rate of return. In either of the cases, the values of standard deviation for monthly returns in the year 2019 are approximately same – 0.039. Therefore, it can be stated that Malakoff has resulted in higher returns for the same amount of risk associated with the return. The monthly returns for the both the companies have been plotted in the figure below:
- Price Ratios: The price ratios for both the companies suggest that Malakoff is available at a relatively cheaper valuation when compared with Petronas. For instance, the PE ratio for Malakoff is 13.8 whereas that for Petronas is 19. Similar deductions can be made based on other price ratios. Malakoff is indeed available at a cheaper price.
- Profitability: The profitability of Petronas is much higher than Malakoff. The difference in profitability has the direct relation with the higher valuation of Petronas. The net profit margin for Petronas is nearly 37% whereas that of Malakoff is 5.6% only.
- Dividend: In terms of dividend, Malakoff has been a better option for the investors, since dividend yield for Malakoff has been 7.4% against 4.2% of Petronas.
- Debt: The debt to equity ratio of Petronas is extremely competitive. This value has been 0.32 for Petronas as compared to 1.94 for Malakoff.
- Efficiency: Evidently Petronas move inventory at much higher pace than Malakoff. Petronas is better positioned in terms of other aspects too, viz. asset turnover, receivable turnover.
4. Importance of Economic Analysis
The share price of any company is a function of numerous variables which are linked to operational and financial aspects of the company. The economic evaluation helps us assess the factors which can impact the operations of the company hence affecting its share price. The following points outline some of the economic analysis and their importance in assessing a stock:
- World Economy: The world economy has a direct impact with industries like energy sector. Any fall in the economic activity in the world has a direct and immediate impact on the energy consumption. The economic activity around the world affects the foreign exchange rates. Companies like Petronas and Malakoff, both of which have significant operations abroad, any changes in the foreign exchange rates can have direct impact on the profitability of the firm.
- Domestic Economy: The domestic consumption is crucial for both the companies – Petronas Gas and Malakoff. Although they have international operations, these companies have majority of their businesses within the limits of the country. Any slowdown in the economic activity of the nation has a direct impact on the company and its stock price.
- Inflation Rate: The inflation rate prevalent in an economy is directly linked to the growth prospects of the country as a whole. The inflation leads to increasing over expense for the livelihood. Evaluating the inflation rate, allows the analysts to determine the expected growth of the company
- Interest Rates: The companies like Malakoff and Petronas have considerable debt on their books. Malakoff has been operating at the debt to equity ratio of 1.9. Therefore, it can be stated that any change in the interest rate leads to immediate on the bottom line of the company.
- Government Policies. Government policies have enormous control over the functioning of the companies in the energy sector. Lately, the government has been promoting the renewable sources of energy. Such policy decisions can result in additional cost pressure on the company in the short to medium term.
- Potential Upside and Value Creation: The ability of a company to create value for its customer, employees, shareholders and all other stakeholders is directly associated with the returns the company will generate in the long term. Any selection exercise for an investment option must, therefore, objectively assess the economic situation of the company. Such economic evaluation is used along with the current price of the stock. If the estimated price of the stock is higher than the actual price of the stock, it can generate higher returns going forward. Economic analysis helps identify those stocks with higher upside and minimal current price.
Evidently, economic analysis of a stock gives very powerful insights into the expected performance of the stock. Such insights are particularly important to the investors who can, most often, perform an external analysis of the company only.
5. Conclusion
Malakoff Corporation Berhad and Petronas Gas Berhad are both stable companies with operations spread across the country. While Malakoff has diversified its risk by having stakes in various energy companies which have presence within and outside Malaysia. Similarly, Petronas has diversified its risk by entering various segments of the overarching energy business, viz. regasification, gas processing, gas transportation and utilities.
The calculations based on the stock prices of the companies reveal that Malakoff has delivered a return of 4.8% in the year of 2019 while this number was -8.6% for Petronas Corporation Berhad. Despite the drop in the price of the stock, the ratio analysis of the companies reveal that Petronas is at much higher valuation vis-à-vis its fair valuation. The higher price of Petronas also comes with fall in stock prices in the given periods and standard deviation of the returns being just about the same. The comparison of the stock along various dimensions further establish the higher valuation and lower returns associated with the Petronas Gas Berhad. Out of the two companies Malakoff appears to be a better investment option. However, the following points must also be weighed in:
- Petronas has a much higher profitability than Malakoff, probably explains the higher valuation
- The growth in the dividend for Petronas stands at 5.11% whereas that of Malakoff has dropped by 2.11%.
- The efficiency of operations for both the companies reveal that Petronas has been utilizing its assets in a far more efficient manner than Malakoff.
While Malakoff has indeed given higher returns in the given period of assessment, Petronas has a better long-term prospect for growth and profitability.
References
Investing. Malakoff Corporation Berhad. Accessed June 23, 2020. https://www.investing.com/equities/petronas-gas-bhd
Investing. Petronas Gas Berhad. Accessed June 23, 2020. https://www.investing.com/equities/petronas-gas-bhd
Market Beat. Compare Stocks. Investment analysis assignment Accessed June 23, 2020. https://www.marketbeat.com/compare-stocks/
Malakoff. 2019. Annual Report 2019. Accessed June 23, 2020. http://ir.chartnexus.com/malakoff/doc/ar2019.pdf
Petronas Gas Berhad. 2019. Integrated Report 2019. Accessed June 23, 2020. http://disclosure.bursamalaysia.com/FileAccess/apbursaweb/download?id=199117&name=EA_DS_ATTACHMENTS


