
Portfolio Management Assignment: Active & Passive Investment Portfolio
Question
Task: You will be given funds to invest in the share market. In this portfolio management assignment, you are required to construct two $1,000,000 equity investment portfolios:
1. A passive portfolio replicating the return of the index
2. An active portfolio to achieve your investment objective of outperforming the index
You will then prepare a report in which you can explain your investment strategy for constructing a passive and an active portfolio and then evaluate the investment performance of each in terms of absolute and relative return, risk and attribution effects to explain the differences in performance of each portfolio. You will be given an equally weighted index of ten companies selected from companies listed on the Australian Stock Exchange.
This assessment replicates the tasks that would be undertaken by portfolio managers in a real-world investment company. For the passive portfolio, your task will be to replicate, as closely as possible, the risk and return characteristics of the benchmark index. For your active portfolio, your task will be to select stocks and sectors, which will result in your portfolio achieving a higher return than the index.
Your task is not necessarily to produce a positive return. If the markets fall in value, then your passive portfolio should fall in value by a similar degree. Your active portfolio should aim to outperform the return on the index: if the index falls, your portfolio should fall by a lesser amount; if the index rises, then your portfolio should rise by a higher amount.?
For Passive portfolio
• calculate the numbers of shares required for your passive portfolio to replicate the composition of the index
For Active portfolio
Assess all ten companies and sectors from the index
• analyse theoutlook for each company’s industry
• analyse the macroeconomic environment at the global and domestic level
• identify the firms and sectors which you consider will outperform relative to the index and build your active portfolio to reflect your predictions
• analyse and comment on the financial ratios of each company over the previous five years. Examples of ratios that can be used-
• Return on Equity
• Net Profit Margin
• Earnings Growth
Evaluate your findings and select six companies for your active portfolio
• after assessing the ten companies, select six to be included in your active portfolio
• describe the reasons for your selections (about 5 bullet points for each stock)
• also, describe the reasons why you have not chosen the other four firms (about 5 bullet points for each stock)
• assign portfolio weights for each of your companies and discuss why you have chosen the weights in comparison to the weight of each stock in the index
• calculate the number of shares required for each company to create a portfolio with the initial weights you have selected for your active portfolio
Build your portfolios
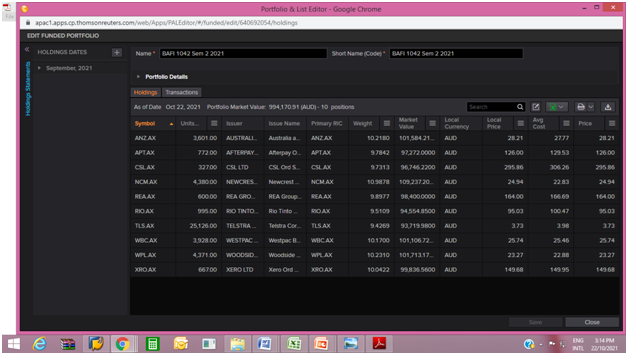
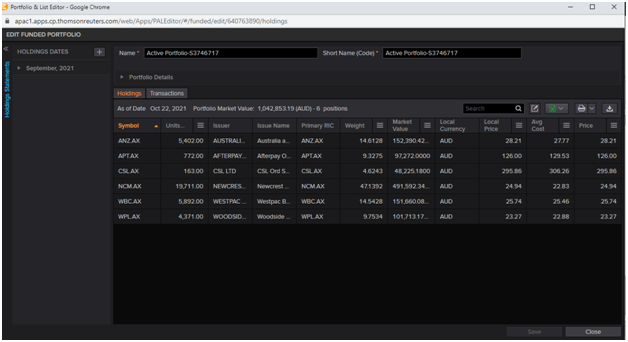
• create these two portfolios in Refinitiv Eikon, ensuring that all dates and numbers of shares are correct
Portfolio Creation Dates
Passive and Active
• Start Date: September 27th, 2021,Monday
Portfolio Names in Eikon
• Passive: Replication Student number(Ex. Replication s3254664)
• Active: Active Student number(Ex. Active s3254664)
Benchmark Portfolio
• BAFI 1042 Sem 2 2021
Portfolio Analysis period for both portfolios
• Start Date: September 27th, 2021
• End Date: October 22nd, 2021
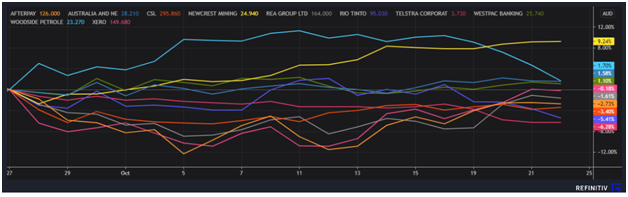
Observe your portfolios’ performances over the analysis period
• as the share prices change over the evaluation period, you will be able to watch how the returns on the index, your active portfolio and your passive portfolio react
Report Summary should include the following minimum points
• discuss your investment goals and stock selection strategies
For each portfolio
• explain the reasoning for your stock selection and weighting relative to the index
• attach screenshots of your portfolios created in Eikon
• report your results for each portfolio
• provide comments on total return/risk and active return/risk of your portfolios
• discuss the sectors and securities’ active weights in your portfolio
• analyse the active return of your portfolios with reference to the allocation and selection effects
• What was the overall performance of the active portfolio, your passive portfolio and the benchmark index?
• describe any major market events which contributed to the return performance of the benchmark or of your portfolios
• have you achieved (or not achieved)the goal for your passive/active portfolio
Finally, which of the two portfolios will you recommend and why?
Data for your report from Eikon
Eikon calculates the portfolio statistics you will require for your report. The information you will need, can be found as listed below.
|
Information |
Eikon Location |
|
Total and Active Return |
Balanced Summary – Contribution |
|
Contribution to Return |
Equity Summary – Performance/Contribution |
|
Contribution to Portfolio Weight |
Equity Summary – Allocation |
|
Allocation and Selection Effects |
Brinson Single Currency |
|
Contribution to Total Risk |
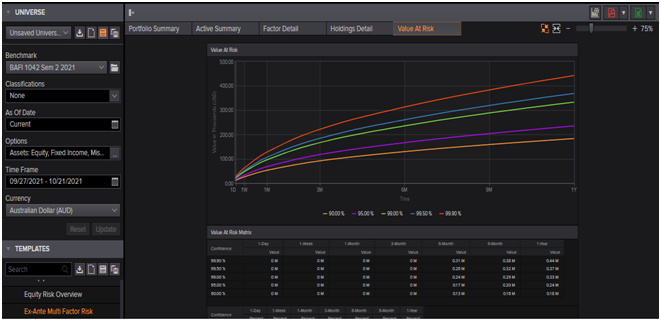
Ex-ante Multi-factor Risk – Portfolio Summary |
|
Contribution to Active Risk |
Ex-ante Multi-factor Risk – Active Summary |
|
Performance Ratios (Sharpe, Treynor) |
Return Statistics |
The index constituents, which each have a 10% weighting, are as follows:
|
Code |
Company |
Sector |
|
ANZ.AX |
Australia and New Zealand Banking Group Ltd |
Financial Services |
|
APT.AX |
Afterpay Ltd |
Technology |
|
CSL.AX |
CSL Ltd |
Health Care |
|
NCM.AX |
Newcrest Mining Ltd |
Basic Materials |
|
REA.AX |
REA Group Ltd |
Communication Services |
|
RIO.AX |
RIO Tinto Ltd |
Basic Materials |
|
TLS.AX |
Telstra Corporation Ltd |
Communication Services |
|
WBC.AX |
Westpac Banking Corporation |
Financial Services |
|
WPL.AX |
Woodside Petroleum Ltd |
Energy |
|
XRO.AX |
Xero Ltd |
Technology |
Answer
Executive summary:
The portfolio management assignmentis concerned with the active and passive investment portfolio that is created and analyzed using the EIKON software. The paper provides a complete understanding of different industries, market indexes, replication portfolio analysis, and active portfolio analysis.
Introduction:
The paper is concerned with portfolio management using the software EIKON. The portfolio analysis is conducted based on the benchmark which is a market index and there are 10 companies included in the market index with a 10% weight of each company. The replication portfolio is created with denotes the passive portfolio in which all these 10 companies are involved with different weight allocation as the passive portfolio is closely associated with a market index. The other portfolio created and analyzed is an active portfolio in which only 6 companies are selected out of these 10 companies based on the returns and growth.
Investment goals and strategies:
The investment goal is one and only is to earn return and increase the wealth of investor with minimum risk for which the strategies are adopted as passive portfolio and active portfolio. The passive portfolio is replication of market index while the active portfolio is created based on different companies under different industries based on the macro-economy and companies’ performance.
Passive portfolio management:
Passive portfolio management is a style of the portfolio in which the investor works to beat the market through several investment activities. Passive portfolio is also known as index fund in which the portfolios are generated for gaining returns which are parallel to the market index. The style of passive portfolio management is related to mutual funds and equity0traded funds. The passive portfolio is the mirror of the market as an index such as the S&P 500 index (Cox, 2017). The return and risk on the passive portfolio management are constant to the market index as the beta of passive portfolio management is equal to or near to 1 and returns are closest to market index returns.
Summary of Passive portfolio:
The passive portfolio is the replicate of a market index. The market index is based on the allocation of 10% in each company related to financial services, technology, health care, basic material, communication services, basic materials, communication services, energy, and technology. In the benchmark index portfolios, the company is weighted equally, that is 10 % of every stock is selected in the benchmark index. The companies that are included In the benchmark industry are ANZ group, After pay limited, CSL Ltd, REA Ltd, RIO Tinto Ltd, Telstra corporation ltd,Newcrest mining Ltd.,WBC, Woodside petroleum ltd and Xero Ltd.
In the passive portfolio, all of the shares of the index portfolio are being selected and the weight is different as per the analysis of the stocks and their weights in the passive portfolio. The weight of different stocks of the replicating passive portfolio is as follows-
|
Security Name |
Symbol |
Weight |
|
ANZ Group Ltd |
ANZ.AX |
20.00% |
|
After pay Ltd |
APT.AX |
5.00% |
|
CSL Ltd |
CSL.AX |
5.00% |
|
Newcrest Mining Ltd |
NCM.AX |
20.00% |
|
REA Group Ltd |
REA.AX |
5.00% |
|
RIO Tinto |
RIO.AX |
5.00% |
|
Telstra Corporation |
TLS.AX |
5.00% |
|
Westpac Banking Corporation |
WBC.AX |
15.00% |
|
Woodside Petroleum Ltd |
WPL.AX |
10.00% |
|
Xero Ltd |
XRO.AX |
10.00% |
In the replicating passive portfolio, the weight of the ANZ group and the Newcrest mining limited is increased from the level of 10 % to the level of 20 % and on the other side the investment in the Afterpay limited, CSL Limited, REA group limited, RIO Tinto limited is being decreased from the level of 10 % to the level of 5 %. That shows that in the replacing passive portfolio the assets are being allocated in different weights as compared to others. The reason for increasing weights in the selected asset is the chances of post-Covid growth and the boost in the economy will lead to the performance of the portfolio (Al-Aradi, & Jaimungal, 2018).
The benchmark index portfolio was earned a negative return of 0.60 % in the analysis period and the performance of the replacing passive portfolio the return of the passive portfolio is 1.51 % that shows that the replacing passive portfolio with the different weights will provide a higher result to the investor.
In terms of the sharp ratio and the trey nor ratio, the replicating portfolio performed well as compared to the market index the sharp ratio of the passive portfolio is 2.632 that is more than -0.023 sharp ratio of Benchmark index and on the other side the trey nor ratio the passive portfolio is higher than the other ratio. The SD of the portfolio is 12.395 and the SD of the benchmark index is 15.538 that show the risk associated with the replicating passive portfolio is higher than the index portfolio (Benhamou, & Guez, 2018).
A passive portfolio comprises the stocks of the benchmark index in different proportions and they have different weights the impact of different weights is clearly shown in the analysis and result of the portfolio.
The weighted sector in the portfolio mainly comprises two sectors that are the financial services sector and the second is the mining and basic material sectors. The financial services sector comprises almost 50 % of the weight of the entire portfolio and on the other side, the mining and base material sector includes 30 % of the weight in the portfolio. The weights of different sectors in the portfolio are as follows
|
|
Portfolio Weight |
Benchmark Weight |
|
Financials |
34.862% |
20.317% |
|
Materials |
26.129% |
20.548% |
|
Information Technology |
14.593% |
19.763% |
|
Energy |
10.264% |
10.470% |
|
Communication Services |
9.444% |
19.267% |
|
Health Care |
4.709% |
9.636% |
The goal associated with the passive portfolio is being achieved as it provides the replicating portfolio of the benchmark index and the replicating portfolio outperforms the benchmark index of the company.
Active portfolio management:
Active portfolio management is the concept in which the investors directly invest in different companies of different sectors and earn higher returns are compared to the market index. The active portfolio is not a replication of the market index while the weight allocation of different companies is based on the annual returns and growth of companies and industries. The active portfolio requires a timely overview and also required to change the allocation of funds to earn effective returns on the investment (Dapena, Serur, & Siri, 2019).
Analysis of Macroeconomic:
The macroeconomic of the country and the geography will impact the selection of the stocks for the investment; the macroeconomic factors will impact the results of the stocks and their performances, different macroeconomic factors may impact the performance of the portfolio, such as-
Interest rate – Interest rate in a country will be the highest factor that will impact the organization and their results, the lower interest rates cause an increase in inflation and economic growth and the higher interest rate is being used for control over the inflation and impact on the monetary circulation in the market.
Economic indication polls – The Macroeconomic factors are assessed based on the economic indicator polls such as retail sales MM final, Broad Money, Private Sector Credit, Housing credit, Reserve assets, and Service PMI Flash. The other and important economic indicator poll is CPI which has actual results of 3.8 in quarter 2 of 2021 and forecasts is 14. Based on the long-term outlook the CPI full-year % for the 31st December 2023 is 2.2.
Based on the macroeconomic analysis of Australia, the retail sales and service sector has the highest share in the economic development hence the investor should consider the economic indicator polls while investing (Hu, & Tiwari, 2021).
Overview of the relevant sector:
The sectors selected for the portfolio are major sectors of investment after the impact of COVID-19 as these sectors have effective growth in the market. The financial service sector is the major sector of the economy as the banking industry play important role in the country's economy of Australia and provides long-term returns to investors. The portfolio is created based on the different sector such as technology, health care, communication, energy, basic material, and financial services which have effective growth in business after the impact of COVID-19 and has financial stability in the long-term period.
Outlook of companies:
The result of the companies and the comparison of the companies with the relevant factors and the ratios are as follows-
|
Identifier (RIC) |
Company Name |
Return On Asset - Mean - Estimate Diffusion (FY1, D30) |
Net Profit Margin, (%) (FY0) |
Earnings Per Share - Actual (FY0, USD) |
IV Earnings Growth Projection (FY1) |
Weighted Average Cost of Capital, (%) |
Price / EPS (Smart Estimate ®) (FY4) |
|
RIO.AX |
Rio Tinto Ltd |
-1.00 |
21.9% |
7.65 |
73.3% |
5.2% |
10.52 |
|
ANZ.AX |
Australia and New Zealand Banking Group Ltd |
0.00 |
15.0% |
0.87 |
65.5% |
4.4% |
12.30 |
|
WBC.AX |
Westpac Banking Corp |
-0.71 |
8.5% |
0.51 |
92.7% |
4.2% |
13.44 |
|
NCM.AX |
Newcrest Mining Ltd |
-0.60 |
25.4% |
1.42 |
|
5.6% |
18.72 |
|
TLS.AX |
Telstra Corporation Ltd |
|
8.6% |
0.11 |
-9.3% |
4.5% |
20.12 |
|
REA.AX |
REA Group Ltd |
|
32.1% |
1.77 |
20.8% |
9.9% |
26.91 |
|
CSL.AX |
CSL Ltd |
1.00 |
23.0% |
5.21 |
-5.7% |
4.3% |
31.78 |
|
XRO.AX |
Xero Ltd |
1.00 |
2.3% |
0.14 |
-134.1% |
5.5% |
101.71 |
|
APT.AX |
After pay Ltd |
|
-16.9% |
0.01 |
|
19.6% |
|
|
WPL.AX |
Woodside Petroleum Ltd |
1.00 |
-111.9% |
0.47 |
166.0% |
9.0% |
|
(Pierrakis, 2019)
Apart from this, the outlook towards different companies and performance of the different companies are as follows-
ANZ.AX
The company is included in the financial services and provides different financial and banking services to the different clients of the company. In Australia and the New Zealand segment of the company, the company will provide retail and corporate banking services to the client. The company is operated in different countries that include Australia, New Zealand, and some of the Asia Pacific region countries. Currently, the company is being operated at a net profit margin of 15 % with a weighted average cost of capital of less than 5 % and the PE ratio of 12.30 make it is the perfect financial company for investment.
APT.AX
APT company is a technology service that provides platform services for the payment platform. Apart from this it also serves the after pay services and the pay now services. Both the online purchase services and the in-store purchase services will lead to the organization a wide conglomeratein the technology company. Currently, the company is provided a net loss (-16.9 %) and the cost of capital is also very high at the point of 19.6 % in the previous period.
CSL.AX
CSL is a company that is related to the pharmacy industry, the company can also be considered as the biotech company that provides various biotherapies for the removal of chronic diseases and also generate and manufacture different vaccines for the same. The operations of the company is being divided into two major parts the parts can be considered as the plasma technique-oriented segment that works in an environment to develop the issues related to plasma treatment and the other segment is related to the non-plasma related treatment. The company has a high-profit margin of more than 23 % and also has a high PE ratio of more than 31.
NCM.AX
Newcrest Company is a mining company that is based in Australia. The company indulges in the activities of exploring, development, and operation of mines, extraction of minerals mainly the gold and copper concentrate, and then sold them to the market. The company is being operated for different locations and has various mines in the operations. The company is earning a profit at the rate of 25.4 % with a PE ratio of 18.
REA.AX
REA Group is a company that provides services to the client the company is being included in the marketing activities, the company includes advertising the properties over the internet or mobile-based applications. The company also has an investment in the company that is indulged in the activities of broking and lending services. The company also includes the development of the program that is responsible for the management of the properties. REA company has the second-highest net profit ratio that is 32 % and is valued at a P/E ratio of approx 27.
RIO.AX
Rio Tinto is a company that is a part of the mining industry in the country; the company is also included in the mining services, extraction services, exploration, marketing, and sales of the material. The company operates in multiple metals such as aluminum, coopered; apart from this the company also has their existence in the petroleum and the energy sector. The energy sectors extract Uranium, a baronetcy material that is very precious for the profits and even for the company. The company has a net profit margin of 23.3% which is higher than the industry average which is 10.6%. The return on equity is also higher as compared to the industry average i.e. 22.3%.
TLS.AX
The company is engaged in business technology and telecommunication. The company has provided the services through four segments which are TC & SB, Network and IT, Telstra enterprises, and Telstra Infra Co. The segments provide different services and products concerning telecommunication such as TC&SB provides services in media, mobile, and small business customers and digital consumers in Australia, Telstra Enterprises provides network, cloud, and other integrated services to government agencies in Australia, Network and IT has to work under internal functions of the software and Telstra InfraCo provides services of fixed network infrastructure in Australia such as mobile towers, poles, data centers, etc. The company has an effective return on equity i.e. 12.8% while the industry median is 4.9%. The company has a higher long-term debt portion in the total capital as compared to the industry median as the industry has 25.6% long-term debt while the company has 40.7% long-term debt which provides tax benefits to the company and also increases the responsibility of fixed cost.
WBC.AX
The group is engaged in the business of financial services as the company provides number of financial and banking services to customers, businesses, institutes, government organizations, and management of wealth services. The company provides services through different divisions such as consumer, business, WIB, specialist business, and Westpac New Zealand. The consumer division provides services to consumers and customers of Australia; the business division provides services and sales banking products to small and medium enterprises in Australia, WIB provides financial services and sales financial products to government and corporate institutes, Westpac New Zealand provides services of banking wealth management to the customers in New Zealand, and specialist business provides services of finance, investment, insurance, superannuation and retirement in Australia.
The company has non-performing loans equal to the industry average i.e. 1.6% while the banking corporation has a negative reinvestment rate in the year 2021.
WPL.AX
The company is engaged in the business of petroleum production and exploration business. The company is focusing on the hydrocarbon business as engaged in the business of production of LNG. The company has operated its business through three segments production, development, and miscellaneous segments. The company has effective market growth while there are major issues related to the environmental impact of business that increase the non-financial factors in the business which has a major influence on the market value of securities. The company has major issues in the year 2020 as the impact of COVID-19 which impacts the business highly which results in the negative NP margin of 110.40% and a negative operating margin of 143.6%. The company has a negative return on equity while the industry median is positive that may impact the decision of investment for a short-term period.
XRO.AX
The company is a software as a service organization that provides accounting services at cloud platforms in Australia, New Zealand, and the international level. The characteristics of the software services provided by the company are payment services, adviser tools, assets management, reconciliation, smart lists, tax returns, payroll, management of projects, and other reporting services. The company also offers mobile services such as Xero mobile application in which the company provides all services concerning accounting and provides a facility to the company to access financial information by the business organizations at any time at any place. The company has a high market after the impact of COVID-19 as the organizations are focusing on the cloud platform and working on the network. The company has effective positive returns in form of a net profit margin of 2.3% while the industry median has a negative margin of 13.1%.
Analysis of performance ratio of companies:
The performance ratios which are considered for evaluation of the companies are as follows:
|
ANZ.AX |
Industry Median |
2020 |
2019 |
2018 |
2017 |
2016 |
|
Efficiency Ratio |
63.9% |
58.3% |
52.0% |
50.5% |
51.1% |
60.2% |
|
Nonperforming Loans (% of Total Loans) |
1.57% |
11.44% |
10.47% |
2.90% |
3.00% |
2.92% |
|
Pretax ROE |
9.8% |
9.0% |
14.9% |
16.7% |
15.8% |
14.2% |
|
APT.AX |
|
|
|
|
|
|
|
Net Margin |
(0.8%) |
(17.2%) |
(4.4%) |
(16.6%) |
(6.3%) |
(33.1%) |
|
ROE |
0.4% |
(13.9%) |
(2.5%) |
(10.3%) |
(5.2%) |
(9.7%) |
|
Current Ratio |
3.69 |
8.17 |
7.26 |
5.78 |
6.51 |
4.71 |
|
Debt/Equity |
0.60 |
1.01 |
0.50 |
0.08 |
0.88 |
0.29 |
|
CSL.AX |
|
|
|
|
|
|
|
Net Margin |
(65.2%) |
23.0% |
23.0% |
22.5% |
21.8% |
19.3% |
|
ROE |
(27.5%) |
31.9% |
35.7% |
41.1% |
47.7% |
46.7% |
|
Current Ratio |
6.79 |
2.38 |
3.01 |
2.53 |
2.61 |
2.84 |
|
Debt/Equity |
0.05 |
0.69 |
0.92 |
0.89 |
1.08 |
1.26 |
|
NCM.AX |
|
|
|
|
|
|
|
Net Margin |
10.6% |
25.4% |
16.2% |
14.9% |
5.9% |
9.2% |
|
ROE |
9.7% |
12.4% |
8.0% |
7.5% |
2.7% |
4.3% |
|
Current Ratio |
1.71 |
2.98 |
2.90 |
2.93 |
2.57 |
1.88 |
|
Debt/Equity |
0.22 |
0.17 |
0.24 |
0.27 |
0.27 |
0.27 |
|
REA.AX |
|
|
|
|
|
|
|
Net Margin |
25.5% |
31.1% |
12.8% |
11.2% |
30.5% |
7.1% |
|
ROE |
24.7% |
33.4% |
12.7% |
11.4% |
30.3% |
6.3% |
|
Current Ratio |
1.99 |
1.95 |
1.17 |
0.69 |
0.93 |
1.21 |
|
Debt/Equity |
0.27 |
0.46 |
0.38 |
0.34 |
0.46 |
0.61 |
|
RIO.AX |
|
|
|
|
|
|
|
Net Margin |
10.6% |
23.3% |
16.2% |
34.4% |
23.2% |
14.1% |
|
ROE |
9.7% |
22.3% |
19.0% |
30.9% |
21.9% |
12.0% |
|
Current Ratio |
1.71 |
1.80 |
1.56 |
1.91 |
1.66 |
1.61 |
|
Debt/Equity |
0.22 |
0.29 |
0.35 |
0.29 |
0.34 |
0.45 |
|
TLS.AX |
|
|
|
|
|
|
|
Net Margin |
8.3% |
8.8% |
7.8% |
8.5% |
13.8% |
14.9% |
|
ROE |
4.9% |
12.8% |
12.5% |
14.8% |
25.0% |
25.9% |
|
Current Ratio |
0.56 |
0.68 |
0.65 |
0.76 |
0.83 |
0.89 |
|
Debt/Equity |
0.43 |
1.20 |
1.32 |
1.19 |
1.16 |
1.22 |
|
WBC.AX |
|
|
|
|
|
|
|
Efficiency Ratio |
63.9% |
75.2% |
49.7% |
44.0% |
43.5% |
43.9% |
|
Nonperforming Loans (% of Total Loans) |
1.57% |
1.59% |
0.94% |
0.56% |
0.50% |
0.48% |
|
Pretax ROE |
9.8% |
6.4% |
15.0% |
18.6% |
19.3% |
19.1% |
|
WPL.AX |
|
|
|
|
|
|
|
Net Margin |
2.7% |
(110.4%) |
7.8% |
28.0% |
29.3% |
23.9% |
|
ROE |
4.9% |
(28.1%) |
2.0% |
8.4% |
7.1% |
6.0% |
|
Current Ratio |
1.15 |
2.03 |
4.11 |
2.31 |
0.97 |
0.93 |
|
Debt/Equity |
0.50 |
0.62 |
0.41 |
0.23 |
0.34 |
0.34 |
|
XRO.AX |
|
|
|
|
|
|
|
Net Margin |
(13.1%) |
2.3% |
0.5% |
(4.9%) |
(6.1%) |
(23.4%) |
|
ROE |
2.7% |
3.4% |
0.9% |
(9.1%) |
(10.7%) |
(27.4%) |
|
Current Ratio |
1.99 |
7.13 |
6.19 |
5.58 |
1.71 |
2.25 |
|
Debt/Equity |
0.02 |
1.28 |
1.18 |
1.25 |
0.19 |
0.00 |
(Yan, & Zheng, 2017)
Technical analysis:
Selection of companies:
The companies selected for the active portfolio are ANZ Group Limited, Afterpay limited, Newcrest mining ltd, WBC, Woodside petroleum, and CSL Ltd.
Reasons:
The reasons for the selection of companies are profitability, financial stability, growth, and return on equity as the companies have returns and financial stability stronger as compared to industry median and have effective growth after the impact of COVID-19 also. The technology sector has effective growth due to an increase in the use of technology in each sector such as online payment, cloud platform, etc. The health care sector has developed highly as a requirement of medical facilities has increased in the last few years, the high increase of petroleum market in the current scenario and the financial services have effective growth in the long-term period as the banking sector part of the economy.
Overweight& Underweight:
The high weight is allocated to the Newcrest Mining Limited as 45% while the ANZ bank and WBC weights 15% each, 10% weight allocated to WPL and Afterpay each, and 5% fund allocated to CSL Ltd. As the Newcrest mining has overweight as involved in the basic material sector and highly related to the market demand of the company. The company has effective returns and profitability to shareholders and after the impact of COVID-19, the market returns has increased frequently. The financial sector and technology sector has constant and effective returns with high risk, therefore, the allocation of funds is average and the health sector has high risk and fewer returns therefore the weight allocation is low.
Summary of Active portfolio:
The active portfolio is created based on the energy, health care, technology, and financial sector of the Australian market. The portfolio has effective returns of 4.29% for the period from 27th September 2021 to 22nd October 2021 and the minimum risk as compared to market index as the portfolio has upside semi-standard deviation of 1.972% and downside semi-standard deviation is 2.170%.
Comparative analysis and performance evaluation of portfolio:
The active portfolio is created based on the financial services, technology, energy, and health care sector which has effective growth after the impact of COVID-19 and provides effective returns on the portfolio.
Weights of portfolio:
The weights allocated to the securities in different companies in the active portfolio are as follows:
|
Security Name |
Symbol |
Weight |
|
ANZ Group Ltd |
ANZ.AX |
15.00% |
|
Newcrest Mining Ltd |
NCM.AX |
45.00% |
|
Westpac Banking Corporation |
WBC.AX |
15.00% |
|
Woodside Petroleum Ltd |
WPL.AX |
10.00% |
|
Afterpay Ltd |
APT.AX |
10.00% |
|
CSL Ltd |
CSL.AX |
5.00% |
|
|
|
100.00% |
Total and active return:
The portfolio has effective returns in total and is active as the benchmark has negative returns while the portfolio provides positive returns to the investors based on the weighted allocation in investment (Zambolin, 2020). The return on the portfolio is as follows:
|
|
Active Portfolio |
Market Index |
|
Periods of losing |
25.000% |
25.000% |
|
Periods of profitability |
75.000% |
75.000% |
|
Total return period |
4.623 |
-0.025 |
|
Average betting |
1.000 |
0.000 |
|
Return as Arithmetic Mean |
59.640 |
0.585 |
|
Return as Geometric Mean |
79.954 |
-0.327 |
The active returns on the portfolio over the period from 27/09/2021 to 22/10/2021 are as follows:
|
Portfolio with Benchmark (09/27/2021 - 10/21/2021) |
||
|
Date |
Portfolio |
Benchmark |
|
09-27-2021 |
0.00% |
0.00% |
|
09-28-2021 |
-1.26% |
-1.79% |
|
09-29-2021 |
-1.35% |
-3.06% |
|
09-30-2021 |
-0.26% |
-1.71% |
|
10-01-2021 |
-0.96% |
-2.99% |
|
10-04-2021 |
0.21% |
-2.44% |
|
10-05-2021 |
0.54% |
-3.03% |
|
10-06-2021 |
0.32% |
-3.14% |
|
10-07-2021 |
1.08% |
-2.22% |
|
10-08-2021 |
1.94% |
-0.93% |
|
10-11-2021 |
2.56% |
-1.31% |
|
10-12-2021 |
1.93% |
-2.06% |
|
10-13-2021 |
2.27% |
-2.00% |
|
10-14-2021 |
3.62% |
-0.74% |
|
10-15-2021 |
3.98% |
-0.38% |
|
10-18-2021 |
4.04% |
-0.50% |
|
10-19-2021 |
4.09% |
-0.62% |
|
10-20-2021 |
4.71% |
0.02% |
|
10-21-2021 |
4.62% |
-0.03% |
Based on the above details the portfolio has effective returns as compared to the benchmark.
Total and active risk:
The total risk of the portfolio is denoted by the SD and the standard deviation of the active portfolio is 12.210 while the standard deviation of the benchmark is 15.538 therefore the portfolio has fewer totals risk as compared to the market index. The beta of the active portfolio is 0.744 while the beta of the market index is 1 means the portfolio is less risky as compared to the market index. The active risk contribution of different companies is as follows:
|
Issue Name |
Portfolio Weight |
Active Risk Contribution |
|
Newcrest Mining Ord Shs |
46.95% |
7.99 |
|
CSL Ord Shs |
4.59% |
0.28 |
|
ANZ bank |
14.58% |
0.14 |
|
WBC |
14.55% |
0.11 |
|
Afterpay Ord Shs |
9.32% |
0.02 |
|
WPL |
10.01% |
-0.01 |
Tracking error:
The realized tracking error of the portfolio is 5.569%, in which there are several factors contribute such as specific risk contribution, industry group, style, currency, region, world, and statistical. The contributions in the tracking error of these factors are as follows:
|
Allocation Effect |
0.000 |
|
Selection Effect |
4.648 |
|
Total Effect |
4.648 |
The average weight difference, market return, and selection effect of each company in the portfolio are as follows:
|
|
Average Weight Difference |
Market Return |
Selection Effect |
|
Newcrest Mining Ord Shs |
35.31% |
9.15 |
3.17 |
|
CSL Ord Shs |
-5.02% |
-3.79 |
0.19 |
|
ANZ |
4.63% |
1.69 |
0.09 |
|
WBC |
4.65% |
1.45 |
0.08 |
|
WPL |
-0.33% |
4.68 |
0.02 |
|
Afterpay Ord Shs |
-0.29% |
-2.47 |
-0.02 |
Information ratios (Sharpe/Treynor):
The ratios are the mode of assessment of the viability of the portfolio. The performance ratios of the portfolio are as follows:
|
|
Active Portfolio |
Benchmark |
Replication Portfolio |
|
Treynor Ratio |
0.964% |
-0.004% |
0.339% |
|
Sharpe Ratio |
6.544 |
-0.023 |
2.362 |
|
Information Ratio |
14.415 |
|
9.060 |
|
Sortino Ratio |
3.809 |
0.000 |
0.000 |
|
Sterling Ratio |
7.297 |
-0.025 |
2.478 |
|
Calmar Ratio |
83.505 |
-0.109 |
16.023 |
Based on the above ratio analysis, it is found that the company has effective performance in the active portfolio as compared to the benchmark and replication portfolio.
Recommendation & Conclusion:
Based on the above analysis, active portfolio is recommended for investment due to effective returns as compared to the passive portfolio. The passive portfolio is a replication of the market index and is closely associated with the market index risk and returns while the active portfolio is based on the companies returns and weight allocation such as buy and sell of securities is based on the assessment and forecast of information. The active portfolio created in the report has high risk as compared to the replication portfolio however the active portfolio required timely and frequently monitored by the investors to maintain the effective return and mitigate the level of risk. As the investor can sell the securities and invest in other securities based on the performance ratios.
References:
Al-Aradi, A., & Jaimungal, S. (2018). Outperformance and tracking:
Dynamic asset allocation for active and passive portfolio management. Applied Mathematical Finance, 25(3), 268-294.
Benhamou, E., & Guez, B. (2018). Incremental Sharpe and other performance ratios. arXiv preprint arXiv:1807.09864.
Cox, C. C. (2017). A comparison of active and passive portfolio management.
Dapena, J. P., Serur, J. A., & Siri, J. R. (2019). Risk on-Risk off: A regime switching model for active portfolio management. Portfolio management assignmentSerie Documentos de Trabajo-Nro, 706.
Hu, Y., & Tiwari, P. (2021). Examining the Macroeconomic Determinants of Property Cycles in Australia. International Real Estate Review, 24(2), 293-322.
Lefebvre, W., Loeper, G., & Pham, H. (2020). Mean-variance portfolio selection with tracking error penalization. Mathematics, 8(11), 1915.
Pierrakis, Y. (2019). Peer-to-peer lending to businesses: Investors' characteristics, investment criteria, and motivation. The International Journal of Entrepreneurship and Innovation, 20(4), 239-251.
Yan, X. S., & Zheng, L. (2017). Fundamental analysis and the cross-section of stock returns: A data-mining approach. The Review of Financial Studies, 30(4), 1382-1423.
Zambolin, A. (2020). Do active mutual fund managers deserve their fees? Return-based style analysis on their performance.
Appendix:
Benchmark for portfolio:
Value at risk in Replication portfolio:
Active Portfolio:
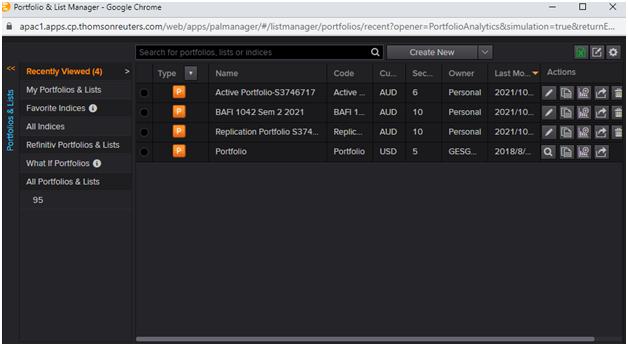
Portfolio List manager:
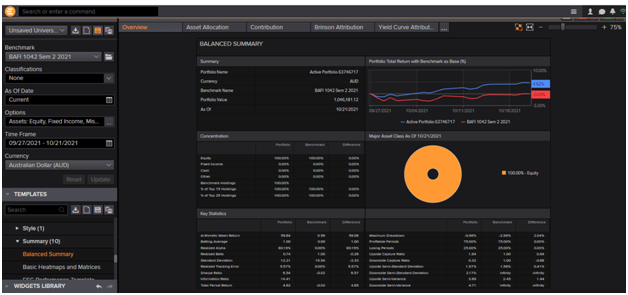
Balance summary of active portfolio:
Economic indicator polls:
|
Economic Indicator Polls |
||
|
Short-term Outlook |
|
|
|
Indicator |
Australia - CPI YY |
|
|
Poll Date |
23-Jul-2021 |
|
|
Unit |
-- |
|
|
This material may not be reproduced or redistributed in whole or in part without the express written consent of Refinitiv |
||
|
Consensus |
Q2 2021 |
|
|
Actual |
3.8 |
|
|
Median |
3.8 |
|
|
SmartEstimate® |
3.81 |
|
|
Predicted Surprise |
0.01 |
|
|
Mean |
3.8 |
|
|
Mode |
3.7 |
|
|
Min |
3.5 |
|
|
Max |
4.0 |
|
|
Standard Deviation |
0.2 |
|
|
# Forecasts |
14 |
|
|
Contributor |
Forecast |
Rank |
|
AMP |
3.9 |
2 |
|
ANZ Bank |
3.9 |
-- |
|
Bendigo |
3.9 |
-- |
|
BofAML |
3.7 |
1 |
|
CBA |
-- |
9 |
|
CBA Ltd |
3.8 |
10 |
|
Deutsche Bank |
3.7 |
-- |
|
HSBC Hldg |
3.6 |
-- |
|
Indeed |
-- |
8 |
|
Laminar Cap |
3.5 |
-- |
|
Macquarie Group |
3.8 |
3 |
|
Morgan Stanley |
-- |
7 |
|
NAB |
3.7 |
5 |
|
RBC |
3.8 |
6 |
|
St George Bank |
4.0 |
-- |
|
UBS |
4.0 |
4 |
|
Westpac |
4.0 |
-- |


