
Business Analytics Assignment: Case Analysis Of Cunningham Holdings
Question
Task:
Business Analytics Assignment Instructions
You are the new business analyst for Cunningham Holdings. The CEO of the Cunningham Holdings subsidiary, Oscar Cunninghamhas assigned you the task to conduct a statistical analysis of the current accommodation business data (see CHL Accommodation DATA.xlsx) and prepare 800 word report summarising your findings addressing the five issues below.
- Issue 1: Determine current average pricing of the accommodation by brands, states, and locations
- Issue 2: Determine whether price differentiation exist among the accommodation brands.
- Issue 3: Determine whether price differentiation exist between state among accommodation brands.
- Issue 4: Determine whether price differentiation exist between location among accommodation brands.
- Issue 5: Determine if the introduction of the Comfort brand has increased internal competition among the other accommodation brands
Your assignment consists of 2 parts:
- Part 1: Action Plan
- Create an action plan for how you will conduct the analysis to address the five issues above. You action plan should describe the followings for EACH issue:
- How the data will be prepared and organised for analysis
- What analytic tool will be used to perform the analysis
- How hypothesis testing will be performed for issues 2 to 5 (see more details in the case study description)
- Part 3: Report and Communication
- Write an 800 word report summarising the findings of your analysis for all the five issues.
Answer
1. Action Plan based on the case of business analytics assignment
Issue – 1
- Average weekly rate for accommodations in CHL Hospitality group of hotels have been explored. Pivot tables have been constructed for this purpose, and two-way tables have been used to present average prices for the three brands by states and locations of the properties (Collins, 2018).
- Resort, Cottage, and Classic were the three brands of the CHL accommodation group. A total of 144 hotels were explored where average price for Resort was $200, Cottage was $203, and Classic was $201. No substantial difference in average room prices per week was noted from the tabular representation of the data, but inferential analysis was required to confirm the case.
Table 1: Average Price by brand of the hotels
Brand
Number of Hotels
Average Price
Classic
48
201
Cottage
48
203
Resort
48
200
-
Each of the three states, New South Wales (NSW), Queensland (QLD), and Victoria (VIC) had 48 hotels in their provinces. Average weekly price for a hotel room was $201 in NSW, $202 in QLD, and $201 in VIC. Weekly average prices were noted to be almost similar in all the three locations, but required further statistical investigation.
Table 2: Average Price by Location State of the hotels
State
Number of Hotels
Average Price
NSW
48
201
QLD
48
202
VIC
48
201
-
A two-way pivot table was used to present the weekly average prices in three states by the three brands. Prices of Resort properties were the lowest in all three states, whereas Cottage properties were the costliest throughout all the states. Brand wise variation in prices was identified, but no such price difference was noted between the states. Further statistical investigation was required.
Table 3: Average Price by brand by state of the hotels
Brand / State
NSW
QLD
VIC
Classic
202
202
201
Cottage
202
204
202
Resort
199
201
200
-
Seventy-two CHL properties were located each in Metropolitan cities and in Regional cities. Average weekly price was $202 in the Metropolitan cities, and $201 in Regional cities. No considerable difference in average room prices per week was noted from Table 4, but inferential analysis was required to confirm the case.
Table 4: Average Price by Location of the hotels
Location
Number of Hotels
Average Price
Metropolitan Cities
72
202
Regional Cities
72
201
-
A two-way pivot table was used to present the weekly average prices at two locations by the three brands. Mean prices of Cottage accommodations were the highest at both the locations, where Resorts were the cheapest ones. No major difference in prices was noted by locations or brands, which remain to be confirmed by statistical investigation.
Table 5: Average Price by brand by location of the hotels
Brand/ Location
Metropolitan Cities
Regional Cities
Classic
202
201
Cottage
202
203
Resort
200
200
Issue – 2
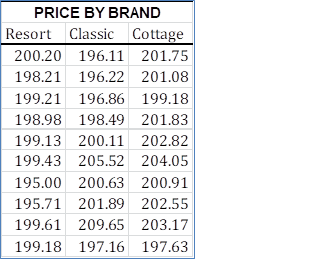
- Probable price difference by brands was investigated by a one-way ANOVA. Price of the hotels was un-stacked using PHStat application by the three brands(Kanal, & Raman, 2016). First ten rows of the un-stacked data have been visually presented in the following figure.
- ANOVA – Hypothesis testing
- Null hypothesis: H0: There is no difference between the weekly average prices of Resort, Cottage, and Classic accommodations.
- Alternate hypothesis: HA: At least one of the brands has difference in weekly average accommodation price.
- Level of significance = 5%
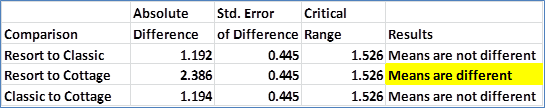
- Calculations were done in MS Excel using PHStat application. The results (F(2, 141) = 7.19, p < 0.05) indicated that there was significant difference in prices by brands at 5% level.
- The null hypothesis was rejected to conclude that average weekly prices for all the brands were not the same.
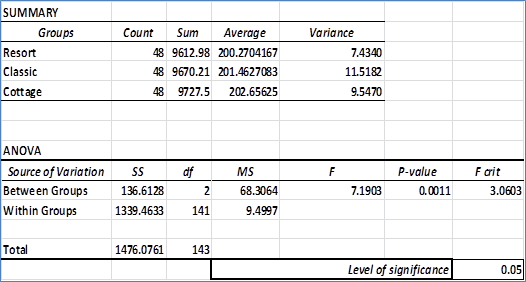
- A post-hoc analysis by Turkey Kramer was conducted to find out that average weekly prices in Resorts were significantly higher than that in the Cottages (Kucuk, Eyuboglu, Kucuk, & Degirmencioglu, 2016).
Issue – 3
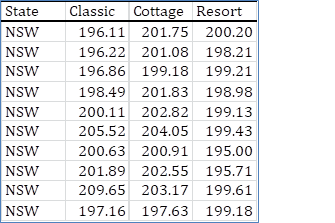
- A two-factor ANOVA with replication was chosen to compare average weekly prices at three different brands by their location states (Upendra, Mahendra, & Rao, 2017). Price was un-stacked for the brands by the three states. The following figure presents the data rearrangement.
- Two-way ANOVA – Hypothesis testing
- Null hypotheses:
- H01: Average weekly prices were same for Resort, Cottage, and Classic brands.
- H02: Average weekly prices were same in NSW, QLD, and VIC states.
- H03: There was no difference between the average weekly prices by Brand by State.
- Alternate hypotheses:
- HA1: At least one of the brands had different average weekly prices.
- HA2: At least one of the states had different average weekly prices.
- HA3: There existed significant difference between the average weekly prices by Brand by State.
- Level of Significance = 5%
- Degrees of Freedom for both Brand and Statevariables were 3 – 1 = 2. The interaction term Brand*State had = (3 – 1) * (3 – 1) = 4 degrees of freedom.
- Results:
- There was no State wise difference (F(2, 135) = 2.08, p = 0.129) in average weekly prices. Thus, null hypothesis H01 failed to get rejected at 5% level.
- There was significant Brand wise difference (F(2, 135) = 7.23, p < 0.05) in average weekly prices. Thus, null hypothesis H02 was rejected at 5% level.
- No significant interaction between Brand and State was noted (F(4, 135) = 0.66, p = 0.62), thus the null hypothesis H03 failed to get rejected.
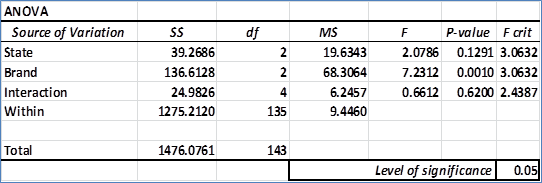
- Decision: No statistically significant difference in average weekly prices by State was noted. However, significant difference in Brand wise prices was noted (similar to one-way ANOVA). It was interesting to note that there was no considerable difference of accommodation by brands when compared between the three states.
- Null hypotheses:
Issue – 4
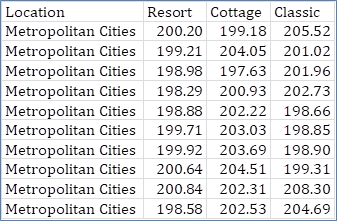
- A two-factor ANOVA with replication was chosen to compare average weekly prices at three different brands by their locations. Price was un-stacked for the brands by the locations. The following figure presents the data rearrangement.
- Two-way ANOVA – Hypothesis testing
- Null hypotheses:
- H011: Average weekly prices were same for Resort, Cottage, and Classic brands.
- H012: Average weekly prices were same in Metropolitan and Regional cities.
- H013: There was no differenceof the average weekly prices by Brand by Location.
- Alternate hypotheses:
- HA11: At least one of the brands had different average weekly prices.
- HA12: At least one of the locations had different average weekly prices.
- HA13: There existed significant difference of the average weekly prices by Brand by Location.
- Level of Significance = 5%
- Degrees of Freedom for Brand was 3 – 1 = 2, and 2 – 1 = 1 for Location. The interaction term Brand*Location had = (3 – 1) * (2 – 1) = 2 degrees of freedom (Quirk, 2012).
- Results:
- There was no Location wise difference (F(1, 138) = 0.14, p = 0.707) in average weekly prices. Thus, null hypothesis H011 failed to get rejected at 5% level.
- There was significant Brand wise difference (F(2, 138) = 7.47, p < 0.05) in average weekly prices. Thus, null hypothesis H012 was rejected at 5% level.
- No significant interaction between Brand and Location was noted (F(2, 138) = 2.07, p = 0.13), thus the null hypothesis H013 failed to get rejected at 5% level.
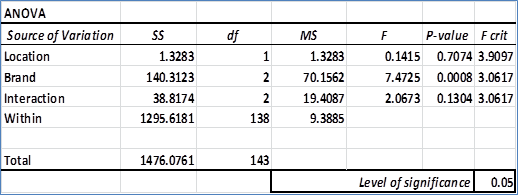
- Decision: No statistically significant difference in average weekly prices by Location was noted. However, significant difference in Brand wise prices was noted (similar to one-way ANOVA). There was no considerable difference of accommodation by brands when compared between the two locations.
- Null hypotheses:
Issue – 5
- Comparison between average weekly prices of accommodations due to presence or absence of nearby Comfort brand was performed using three independent t-tests for the three brands of hotels.
- First, data for Classic brand of hotels was extracted in the following format.
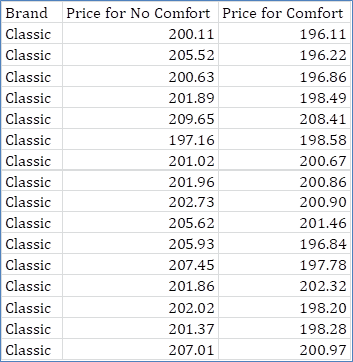
- Independent t-test – Classic Brand
- Null hypothesis: H021: There was no difference in average weekly prices of Classic properties due to existence or absence ofa nearby Comfort brand.
- Alternate hypothesis: HA21: Average weekly price of Classic properties was significantly higher in absence of a nearby Comfort brand compared to existence of a nearby Comfort brand of hotel (Upper-Tailed/ One-tailed).
- Level of Significance = 5%
- ?Results: The null hypothesis H021 was rejected at 5% level based on the test results (t = 3.28, p < 0.05).
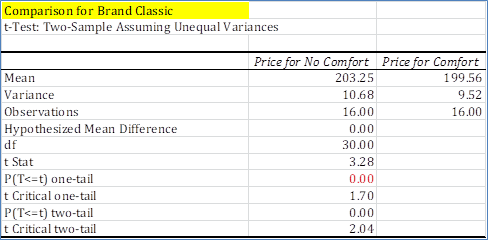
- Decision: Average weekly price (for Classic property) in absence of Comfort brand (M = $203.25, SD = $3.27) was significantly higher in case there existed a nearby Comfort brand (M = $199.56, SD = $3.08).
- Independent t-test – Cottage Brand
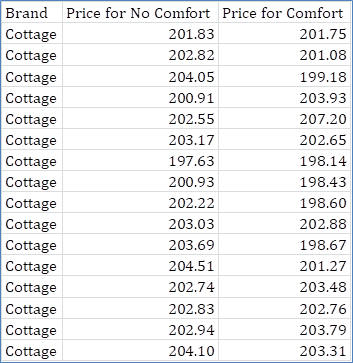
- First, data for Cottage brand of hotels was extracted in the following format.
- Null hypothesis: H031: There was no difference in average weekly prices of Cottage properties due to existence or absence of a nearby Comfort brand.
- Alternate hypothesis: HA31: There was significant difference in average weekly prices of Cottage properties due to existence or absence of a nearby Comfort brand (Two tailed).
- Level of Significance = 5% (Ayd?n, 2016).
- Results: The null hypothesis H031 failed to get rejected at 5% level based on the test results (t = 1.05, p =0.30).
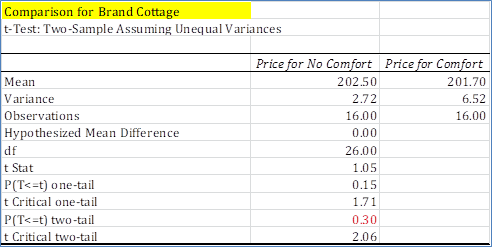
- Decision: There was no difference between average prices of Cottage properties due to absence or presence of a nearby Comfort brand of hotel.
- First, data for Cottage brand of hotels was extracted in the following format.
- Independent t-test – Resort Brand
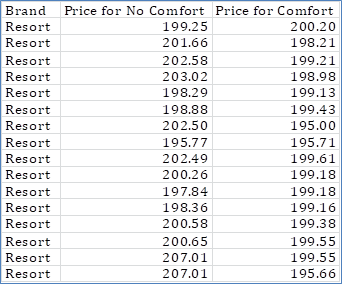
- First, data for Resort brand of hotels was extracted in the following format.
- Null hypothesis: H041: There was no difference in average weekly prices of Resort properties due to existence or absence of a nearby Comfort brand.
- Alternate hypothesis: HA41: Average weekly price of Resort properties was significantly higher in absence of a nearby Comfort brand compared to existence of a nearby Comfort brand of hotel (Upper-Tailed/ One-tailed).
- Level of Significance = 5%
- Results: The null hypothesis H041 was rejected at 5% level based on the test results (t = 2.80, p < 0.05).
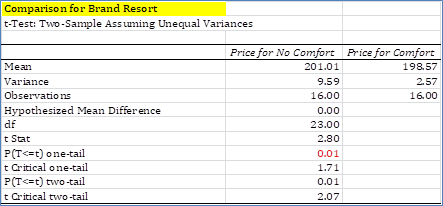
- Decision: Average weekly price (for Resort property) in absence of Comfort brand (M = $201.01, SD = $3.10) was significantly higher than average weekly price in case there existed a nearby Comfort brand (M = $198.57, SD =$1.60).
- First, data for Resort brand of hotels was extracted in the following format.
Executive Summary
Evaluation of brands of the CHL hospitality group was performed using descriptive and inferential analysis. The report found that average weekly price of Cottages was considerably higher compared to another upmarket product known as Resort brand of hotels. Interestingly, the Resort brand was performing at par with budget brand of accommodations. Launch of budget brand named Comfort was adversely affecting the prices for Resort and Classic properties. Most remarkably, different city or state locations were not influencing factors for determination of weekly prices for the three brands of CHL hospitality group.
Introduction
The present report explores the average weekly price of accommodation in Resort, Classic, Cottage, and Comfort brand of hotels managed by CHL Hospitality in Australia. The company was looking to strategies their expansion policy with both expensive (Resort and Cottage) and budget category (Classic and Comfort) hotels. The primary objective was to assess the market scenario before announcing the “Family Friendly” holiday promotion package (Viglia, Mauri, & Carricano, 2016). Therefore, perspective and preference of clients were analysed based on choice of the properties. For this purpose, weekly room prices of the hotels were compared by brand and location in New South Wales (NSW), Queensland(QLD) and Victoria(VIC) provinces of Australia. Alongside, adverse impact of introducing the new budget category accommodation named “Comfort” was evaluated on the average prices of the two upmarket CHL properties in the nearby locality. The report was used as a guideline for mentoring supporting staffs of the hospitality group.
Market Review
The market investigation was based on five issues based on comparative analyses of average weekly prices based on brand, location, and state of the accommodations. Moreover, average weekly prices of accommodations in different brands were compared between Metropolitan and Regional cities. A similar comparative study for difference in average room prices by brands was also done forNew South Wales, Queensland and Victoriasates of Australia. The five issueswere investigated with 144 hotels with 48 from each brand of hotels. Interestingly, 48 hotels were located in each of the three states, whereas 72 hotels were situated each in Metropolitan and Regional localities.
Average weekly accommodation in Cottageswas the costliest for $203, followed by $201 in Classic and$200 for Resort brand hotels. Average weekly price for lodging in a hotel room was $202 in QLD, $201 in NSW and VIC. Again, an average price of $202 in the Metropolitan and $201 in Regional cities were evaluated. Parity in average prices was noted amongst the brands, locations and as well amongst the three states. Brand by State comparison of prices revealed that average prices of Resort properties were the lowest in all three states, whereas Cottages were the costliest. Similarly, mean prices of Cottage accommodations were the highest at Metropolitan and Regional locations, where Resorts were the cheapest ones. No disparity in state wise variation or location wise difference in prices by the brands was identified.
Further investigation revealed that Cottage brand of hotels was significantly costlier than Resort properties. However, change in location and state was not generating any differences in prices for a particular brand of hotels. The company was interested in assessing the introduction of “Comfort” brand of budget accommodation. It was identified that average prices of lodging in Resort and Classic brand of properties was considerably lower in case there was a ‘Comfort” brand of hotel within 2 kilometres. There was no significant change noted in prices for Cottage properties by presence of Comfort” brand of hotel in vicinity.
Conclusion
The primary focus of the report was on developing a sustainable model for establishing CHL hospitality as a market leader. Different comparative analyses were performed to assess the client preferences in choosing accommodations. Average weekly lodging price was considered as the dependent factor, and descriptive and confirmatory analyses have been performed.
Market analysis indicates that Cottage brand of accommodation was highly preferred by clients, irrespective of higher prices for weekly lodging. Resorts were noted to be under performing instead of being an upmarket brand of CHL. In fact, average prices of staying in Resort and Classic brands were almost same. Also, weekly prices considerably dropped for Resorts in case of Comfort brand of hotels in vicinity. Average weekly lodging prices were almost stable across New South Wales, Queensland and Victoriairrespective of brands. Likewise, no difference between Metropolitan and Regional hotel prices existed for all the three brands.
Recommendations
There were few highlights from the detailed market survey conducted on price differences by brand, location, and states in Australia. The utmost important issue to be addressed was the underperforming of Resort properties, especially when competing with the other upmarketbrand. The prices of Resorts were at par with that of the budget brand of CHL (Classic). Average prices for Resorts were considerably lower where customers had accessibility of staying in nearby Comfort brand of hotels. Therefore, remodelling and restructuring of the Resort brand should be the first priority of the company. After renovation the company might offer the “Family Friendly” deal to customers for Resort hotels to gain back the confidence of the clients towards the brand.
Classic brand was a budget brand which was noted doing uniform business around the country. However, presence of Comfort brand of hotels was forcing Classic hotels to considerably lower its lodging prices. Hence, the company should carefully select the location of the Comfort motels to avoid conflict of interest with the Classic brand.
References
Ayd?n, S. (2016). Using Excel in teacher education for sustainability. Journal of Teacher Education for Sustainability, 18(2), 89-104.
Collins, J. C. (2018). 9 PivotTable Enhancements in Excel 2016. Journal of Accountancy, 225(3), 74.
Kanal, A., & Raman, A. (2016). Data Analysis And Business Modelling In Microsoft Excel Using Analysis Tollpax. International Journal Of Computer Science And Information Technologies, 7(5).
Kucuk, U., Eyuboglu, M., Kucuk, H. O., & Degirmencioglu, G. (2016). Importance of using proper post hoc test with ANOVA. Business analytics assignment International journal of cardiology, 209, 346.
Quirk, T. J. (2012). One-way analysis of variance (ANOVA). In Excel 2007 for Educational and Psychological Statistics (pp. 163-179). Springer, New York, NY.
Upendra, S., Mahendra, S., & Rao, P. S. (2017). Two-way ANOVA Calculations Using MS-Excel. Research Journal of Science and Technology, 9(4), 532-536.
Viglia, G., Mauri, A., & Carricano, M. (2016). The exploration of hotel reference prices under dynamic pricing scenarios and different forms of competition. International Journal of Hospitality Management, 52, 46-55.


