
Data Analysis Assignment: Effects of COVID-19 on White and BAME People
Question
Task:
In a recent BBC (UK) news, it has been identified that the infection rate of Covid – 19 is varied between white people and BAME in the UK. In order to identify the ratio and the truthfulness of the findings, 50 different white and BAME patients have been selected. All the patients age is between 20 and 100 years. Based on the data in the table below, you are required to analyse the ratio of infection rate and truthfulness of the findings.
Your data analysis assignment should include the following factors:
What do you mean by t-Test?
What is hypothesis? How to develop null and alternative hypothesis?
Develop an appropriate set of testable hypotheses (null and alternative) for the experiment for the above data.
The testing of your hypotheses to significance level of p=0.10, p=0.01, and p=0.02
The presence of any outliers in the data and the effect that they have on the outcome
Any other features of the data that appear during your investigation of the dataset
Any other factors that might affect the results but have not been considered in the stated experimental set-up, together with ideas as to how you might control these factors
This analysis should be documented in a report of no more than 2000 words illustrated with visualizations.
Answer
Introduction
Covid – 19 has ruptured the world system up to a large extent. Its impact has been seen in every domain of life. The objective of this data analysis assignment is to analyze the relation between the effects of covid on white people and BAME people. The procedure of data analysis will be hypothesis testing which would involve comprehending the common notion of effects of COVID on both sets of people. The sample data is taken from the population of the UK. The age of the patient is between 20 to 100 years. The data analysis will attempt to find out the relation between ethnicity and infection due to covid.
T – Test
T – test is basically a type of inferential statistics which is meant to seek the significant difference between two groups or two sets of data. The notion of difference is to advocate for different parameters and factors that could impact a certain result. The sample data or a set of data taken for the analysis is taken as a normal distribution. The purpose of t – test is to test the assumptions which could be applied to a population or large group of datasets. There are different parameters and attributes that are calculated within the dataset to find certain characteristics and interpret them accordingly.
When t – test for different groups results in significance level, this is meant as a null hypothesis which is inferred as the common attribute impacting the result in a particular dataset. The operability of t – test is comprehended from the average of both the data and their standard deviation. The basic inference is based on evaluating the behaviour or mean to find out whether there is any truthfulness regarding the assumption. The t – test compares the two sets of data to find the common parameter that impacts them in a similar way.
Hypothesis
The concept of hypothesis is associated with the notion of assuming a certain outcome or behaviour regarding a dataset. The dataset represents a certain behaviour which is analyzed to find out whether a particular set of data can be comprehended in a particular way. The objectivity of a hypothesis is to assume a particular outcome about the data and then test whether that outcome is achieved or not. Usually, the concept of hypothesis is well used and analyzed during t – test. The t – test is carried out between two groups of data. These groups' data is often evaluated on the parameters of equal or unequal variances or means. The analysis of t – test takes place on this parameter. The concept of analysis is that two sets of data have some kind of common behaviour or any parameter that is affecting them in a similar way. The t – test is a way to prove that common notion between those groups of data.
The t – test is carried out between two sets of data based on means or variance. The notion of hypothesis is to establish a common parameter that affects both sets of data. This is known as the null hypothesis. The null hypothesis is often proved when the significance level is 0.05 or within the assumed alpha level. If the significance of statistics (p – value) is less than the alpha value, then the null hypothesis is rejected and there could be different parameters affecting the two-group of data. If the value of p is more than the assumed alpha level, then the hypothesis is accepted and proven. This means that there is no parameter that impacts both groups in a similar way. Apart from the null hypothesis, there are some alternative hypotheses that are basically different p – values on varied assumed alpha levels.
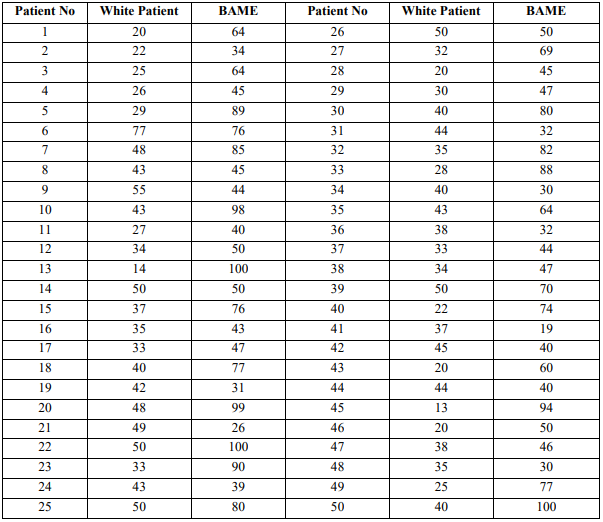
Dataset
The dataset contains three columns, namely Patient No., White Patient, BAME. The patient number contains the count of patients about which covid parameter is being evaluated. The second and third columns are White patients and BAME is the age of the covid patient. These two columns contain the age of the individual who got impacted by covid. The prospect of representing the age of people who got affected by the covid is to portray that a specific range of people belonging to a particular ethnicity got affected by the covid. The dataset is representing the sample data of people affected by covid.
T – Test of the Dataset
The t -test on the dataset is carried out on predefined alpha level that is 0.05. The test results are shown below. In the given table, one can observe that p – value for one – tail is 9.54795E-09 and p – value for two tail is 1.90959E-08. Both the values shows that hypothesis is rejected and both the dataset doesn’t have any common parameter impacting the people of particular ethnicity. This also proves that there is certain impact of covid and taking place differently on both the set of data. This t – test is for null hypothesis.
|
t-Test: Two-Sample Assuming Unequal Variances |
||
|
|
White Patient |
BAME |
|
Mean |
36.58 |
60.04 |
|
Variance |
143.5138776 |
547.1820408 |
|
Observations |
50 |
50 |
|
Hypothesized Mean Difference |
0 |
|
|
df |
73 |
|
|
t Stat |
-6.312037424 |
|
|
P(T<=t) one-tail |
9.54795E-09 |
|
|
t Critical one-tail |
1.665996224 |
|
|
P(T<=t) two-tail |
1.90959E-08 |
|
|
t Critical two-tail |
1.992997126 |
|
Varied Significance Level
The objectivity of facilitating varying significance level is to test alternative hypothesis. The notion of alternative hypothesis is to prove the same objective but at different significance level. The different significance level represents different portion of normal distribution.
For p – value = 0.1
This can be considered as first alternative hypothesis. The test results are shown below. In the given table, one can observe that p – value for one – tail is 9.54795E-09 and p – value for two tail is 1.90959E-08. Both the values shows that hypothesis is rejected and both the dataset doesn’t have any common parameter impacting the people of particular ethnicity. This can also be comprehended that impact of covid is different on white people and BAME people.
|
t-Test: Two-Sample Assuming Unequal Variances |
||
|
|
White Patient |
BAME |
|
Mean |
36.58 |
60.04 |
|
Variance |
143.5138776 |
547.1820408 |
|
Observations |
50 |
50 |
|
Hypothesized Mean Difference |
0 |
|
|
df |
73 |
|
|
t Stat |
-6.312037424 |
|
|
P(T<=t) one-tail |
9.54795E-09 |
|
|
t Critical one-tail |
1.293256413 |
|
|
P(T<=t) two-tail |
1.90959E-08 |
|
|
t Critical two-tail |
1.665996224 |
|
For p – value = 0.01
This can also be considered as second alternative hypothesis. The test results are shown below. In the given table, one can observe that p – value for one – tail is 9.54795E-09 and p – value for two tail is 1.90959E-08. Both the values shows that hypothesis is rejected and both the dataset doesn’t have any common parameter impacting the people of particular ethnicity. This can also be comprehended that impact of covid is different on white people and BAME people.
|
t-Test: Two-Sample Assuming Unequal Variances |
||
|
|
White Patient |
BAME |
|
Mean |
36.58 |
60.04 |
|
Variance |
143.5138776 |
547.1820408 |
|
Observations |
50 |
50 |
|
Hypothesized Mean Difference |
0 |
|
|
df |
73 |
|
|
t Stat |
-6.312037424 |
|
|
P(T<=t) one-tail |
9.54795E-09 |
|
|
t Critical one-tail |
2.378521878 |
|
|
P(T<=t) two-tail |
1.90959E-08 |
|
|
t Critical two-tail |
2.644868782 |
|
For p – value = 0.02
This can also be considered as third alternative hypothesis. The test results are shown below. In the given table, one can observe that p – value for one – tail is 9.54795E-09 and p – value for two tail is 1.90959E-08. Both the values shows that hypothesis is rejected and both the dataset doesn’t have any common parameter impacting the people of particular ethnicity. This can also be comprehended that impact of covid is different on white people and BAME people.
|
t-Test: Two-Sample Assuming Unequal Variances |
||
|
|
White Patient |
BAME |
|
Mean |
36.58 |
60.04 |
|
Variance |
143.5138776 |
547.1820408 |
|
Observations |
50 |
50 |
|
Hypothesized Mean Difference |
0 |
|
|
df |
73 |
|
|
t Stat |
-6.312037424 |
|
|
P(T<=t) one-tail |
9.54795E-09 |
|
|
t Critical one-tail |
2.091096978 |
|
|
P(T<=t) two-tail |
1.90959E-08 |
|
|
t Critical two-tail |
2.378521878 |
|
A conclusive interpretation can be drawn from all the result that despite varied significance level, the p – values were same in all three conditions.
Outliers
The outliers are the value that is beyond a significance range. Statistically, it is interpreted as any value that lies beyond normal distribution. The outliers are calculated in excel using =Outlier() function. The outliers are for the given dataset is calculated by calculating first quartile, third quartile, interquartile range. The first quartile is calculated by using a function =Quartile(Array,1) and third quartile is calculated using function =Quatile(array,3). Interquartile range is calculated by subtracting first quartile from third quartile. Thus, lower bound and upper bound is calculated by using the formula = Q1 – (1.5*IQR) and = Q3 + (1.5*IQR) respectively. The results for both ethnic people are given below.
|
Q1 |
Q3 |
IQR |
Upper Bound |
Lower Bound |
|
|
WP |
28.25 |
43.75 |
15.5 |
67 |
5 |
|
BAME |
43.25 |
79.25 |
36 |
133.25 |
-10.75 |
The identification of a particular value of age lying beyond outlier is given in the table below.
|
White Patient |
Outlier |
BAME |
Outlier |
|
20 |
FALSE |
64 |
FALSE |
|
22 |
FALSE |
34 |
FALSE |
|
25 |
FALSE |
64 |
FALSE |
|
26 |
FALSE |
45 |
FALSE |
|
29 |
FALSE |
89 |
FALSE |
|
77 |
TRUE |
76 |
FALSE |
|
48 |
FALSE |
85 |
FALSE |
|
43 |
FALSE |
45 |
FALSE |
|
55 |
FALSE |
44 |
FALSE |
|
43 |
FALSE |
98 |
FALSE |
|
27 |
FALSE |
40 |
FALSE |
|
34 |
FALSE |
50 |
FALSE |
|
14 |
FALSE |
100 |
FALSE |
|
50 |
FALSE |
50 |
FALSE |
|
37 |
FALSE |
76 |
FALSE |
|
35 |
FALSE |
43 |
FALSE |
|
33 |
FALSE |
47 |
FALSE |
|
40 |
FALSE |
77 |
FALSE |
|
42 |
FALSE |
31 |
FALSE |
|
48 |
FALSE |
99 |
FALSE |
|
49 |
FALSE |
26 |
FALSE |
|
50 |
FALSE |
100 |
FALSE |
|
33 |
FALSE |
90 |
FALSE |
|
43 |
FALSE |
39 |
FALSE |
|
50 |
FALSE |
80 |
FALSE |
|
50 |
FALSE |
50 |
FALSE |
|
32 |
FALSE |
69 |
FALSE |
|
20 |
FALSE |
45 |
FALSE |
|
30 |
FALSE |
47 |
FALSE |
|
40 |
FALSE |
80 |
FALSE |
|
44 |
FALSE |
32 |
FALSE |
|
35 |
FALSE |
82 |
FALSE |
|
28 |
FALSE |
88 |
FALSE |
|
40 |
FALSE |
30 |
FALSE |
|
43 |
FALSE |
64 |
FALSE |
|
38 |
FALSE |
32 |
FALSE |
|
33 |
FALSE |
44 |
FALSE |
|
34 |
FALSE |
47 |
FALSE |
|
50 |
FALSE |
70 |
FALSE |
|
22 |
FALSE |
74 |
FALSE |
|
37 |
FALSE |
19 |
FALSE |
|
45 |
FALSE |
40 |
FALSE |
|
20 |
FALSE |
60 |
FALSE |
|
44 |
FALSE |
40 |
FALSE |
|
13 |
FALSE |
94 |
FALSE |
|
20 |
FALSE |
50 |
FALSE |
|
38 |
FALSE |
46 |
FALSE |
|
35 |
FALSE |
30 |
FALSE |
|
25 |
FALSE |
77 |
FALSE |
|
40 |
FALSE |
100 |
FALSE |
Analysis and Findings
From all the analysis conducted throughout the paper, it can be argued that there is no relation between ethnicity and infection of covid. This can also be inferred as there is no dependency of infection due to a certain ethnicity of individual. This means that covid can attack anyone in general based on the hygiene principles and activities carried out. The null hypothesis in the above analysis was that covid impacts similarly on white people and BAME people which would have been visualised as the difference in statistical significance among the both datasets given in all conditions. But for p = 0.05, 0.01, 0.02, and 0.1, the p- value in both one – tail and two tail is lower than the given alpha value. This proves that null hypothesis is rejected and also that there is certain difference in impact of covid due to ethnicity of an individual. The further discussion of the result is a subject of interpretation. The reason is that one could not blame the ethnicity for the impact of covid but there are other things that can be considered responsible.
There can be two separate angles to this situation. First, that it has already been proved that impact of covid was differently on BAME and white people. But to establish an exact cause or reason, there isn’t sufficient data. Second, there could be a possibility of further investigation to this scenario to find out the possible reasons why BAME people are impacted differently than white people in the case of covid – 19.
Conclusion
Data analysis is one of the most prominent tools for comprehending dataset and finding any necessary outcome or interpretation. The basic fundamental of using t – test is to establish a common ground of covid impact on different set of people. This can also be inferred that the impact of covid has taken place differently on different section of society or people of certain ethnic background. The analysis in this assignment has proven that covid impacts differently on different ethnic people. But the dataset lacks sufficient data to prove the exact reason why it happens so. That’s why, the research and analysis is open for further analysis and interpretation as more variables are required to comprehend the impact of covid on a particular set of people.
References
Lancaster, G., Iatsenko, D., Pidde, A., Ticcinelli, V. and Stefanovska, A., 2018. Surrogate data for hypothesis testing of physical systems. Physics Reports, 748, pp.1-60. https://www.sciencedirect.com/science/article/pii/S0370157318301340
Balakrishnan, S. and Wasserman, L., 2018. Hypothesis testing for high-dimensional multinomials: A selective review. The Annals of Applied Statistics, 12(2), pp.727-749. https://projecteuclid.org/journals/annals-of-applied-statistics/volume-12/issue-2/Hypothesis-testing-for-high-dimensional-multinomials-A-selective-review/10.1214/18-AOAS1155SF.short
Cleff, T., 2019. Applied statistics and multivariate data analysis for business and economics: A modern approach using SPSS, Stata, and Excel. Data analysis assignment Springer. https://books.google.com/books?hl=en&lr=&id=9tOhDwAAQBAJ&oi=fnd&pg=PR5&dq=Outliers+in+excel+analysis&ots=O_fwAr6Xx_&sig=u2cQ
3n1JHbFTpWFBecdEGK4Px7o
Ledolter, J., Gramlich, O.W. and Kardon, R.H., 2020. Parametric Statistical Inference for Comparing Means and Variances. Investigative ophthalmology & visual science, 61(8), pp.25-25. https://jov.arvojournals.org/article.aspx?articleid=2770337
Delacre, M., Lakens, D. and Leys, C., 2017. Why psychologists should by default use Welch’s t-test instead of Student’s t-test. International Review of Social Psychology, 30(1). https://www.rips-irsp.com/articles/10.5334/irsp.82/


