
Statistics Assignment: Stock Market Price Evolution of Tesla & Pfizer
Question
Task: The aim of this statistics assignment is to elaborate a report describing stock market price evolution of two publicly traded companies. Prepare a business report that should be supported with all the necessary analysis.
Answer
Introduction
As discussed in the present context of statistics assignment, the evolution of the stock market began when companies around the globe began to trade with each other. As a result, a large group of investors who possess adequate savings for investment pooled their money and became the business partners and co-owners of such companies. The investors received share ownership against the investment made to establish a joint-stock business. The fluctuation in the stock market price is a normal affair in the economy. The prices of stock are determined by demand and supply. In case a seller happens to find no changes in the prices while trading, it means the size of the investment is very small (Vargaset al., 2017). On the other hand, when an investor tries to purchase or sell a large number of shares at one time, there is a price movement in the share market. In this report, two US-based listed companies are selected which are Tesla and Pfizer, to ascertain their stock price movement in the past five years. Using Excel formula and a variety of graphs, the daily price evolution and changes in the daily return of the stock prices for both the company shall be ascertained to find out the degree of fluctuation in the US stock market.
1. Brief description of the company
Tesla Inc. is a US-based electric vehicle company that deals with electric cars run on clean energy. The company was founded in 2003 to make people believe that electric cars are better, quicker at speed and easy to drive in comparison to gasoline cars. The mission of the company is to improve the world's transition to a sustainable source of energy. In order to promote a sustainable environment, Telsa is also engaged in manufacturing a unique series of energy solutions for its electric cars, which are Powerwall, Powerpack and Solar Roof. These devices foster homemakers, businesses and utility service providers in the country to manage renewable sources of energy generation, storage and consumption (Tesla, 2021). The company believes that the faster the world prohibits the use and relies on non-renewable sources and fossil fuels, the better it is for the world to move quickly into a zero-emission future. The strategy of the company is to penetrate into the high-end automobile market where its customers are ready to pay a premium amount for the electric cars offered by the company. It was innumerate that Tesla plans to drive down as soon as possible to higher car unit volume and lower prices with each of the successive models launched in the market.
Pfizer Inc is a US-based MNC pharmaceutical and biotech company that was established in the year 1849. The company deals with the manufacturing of medicines, vaccines and booster shots. The business is engaged in the development, innovation, manufacturing, marketing, sales and distribution of biopharmaceutical products. The company aims to offer quality healthcare and wellness services throughout the world to prevent, treat and cure diseases. Pfizer works in collaboration with the governments of several countries and local communities to offer support and provide access to healthcare facilities (Pfizer, 2021). Pfizer has had multiple achievements in its name by discovering citric acid, producing penicillin and vitamin C. However, the company has faced a number of legal compliances where the consumers have claimed that Pfizer has sold defective drugs, and the US government has imposed heavy fines on the business. The recent development for Pfizer is in the introduction of the Covid-19 vaccine. The company partnered with BioNTech in April 2020 to develop a vaccine against Covid-19. After completing extensive research and development on the manufacturing of vaccines, Pfizer produced around 50 million vaccines in the year 2020 and up to 1.3 billion doses by the end of 2021.
2. Daily price evolution and daily returns
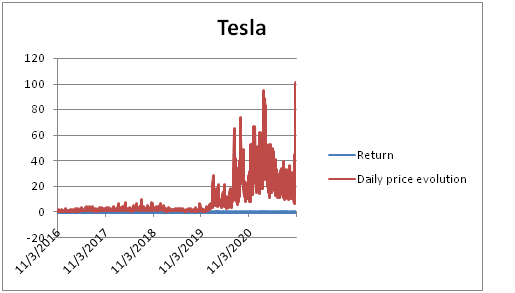
The daily price evolution is a measure of volatility that measures how much the stock changes its values. The daily price variation of the stock is the net difference between the highest and lowest share values on a specific trading day. The daily price evolution for Tesla and Pfizer is calculated by taking the difference between the high price and low price of the stock in a given day (Zhou et al., 2018). The daily price evolution is important in financial analysis as it allows making the prediction of price changes. Price change forms one of the two factors that involve the total return from the investment in the given period and any dividend obtained from the investment.
Tesla’s daily price evolution became prominent over the years due to an increase in its share prices. In the initial time period, that is, in 2016 and 2017, the high stock price and a low stock price of Tesla remained within $50 per share (Finance. yahoo, 2021). Over the years, the market price of the share gradually improved and was recorded as $1208.59 as the high price and $1146 as the low price as of 2 November 2021. This contributed to the large gap of daily price evolution for Tesla's shares. It suggests that investors at the present date earn more dividends from investing in Tesla as compared to 5 years before due to low share prices.
(Source: Finance. yahoo, 2021)
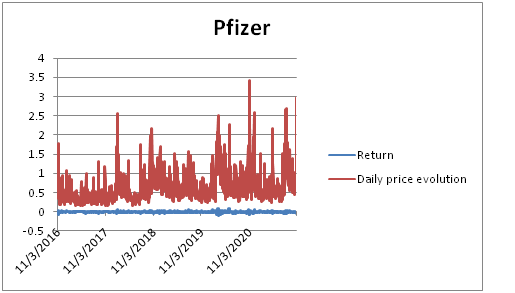
Pfizer maintained its daily price evolution within $1 throughout the past five years. The prices of Pfizer shares did not observe any significant increase or decline since 2016, causing the daily price evolution to remain stable throughout (Zhang et al., 2018). It suggests that the company derives moderate return from investment through stock trading and follows a constant or stable dividend policy to declare dividends to its shareholders. On 3 November 2016, the high and low price of Pfizer's stock was $29.12 and $28.30, respectively that reached $46.04 and $43.05 in the year 2021 as the high and low share price of the biopharmaceutical company (Finance. yahoo, 2021).
(Source: Finance. yahoo, 2021)
Daily stock return is a financial measure that is used to define the daily performance of the stock. It is computed by comparing the closing price of the stock on a day to the price of the same stock at the last day's closure. A positive daily return indicates that there is an appreciation in the stock price of the company on a daily comparison.
The daily stock return for Tesla is expressed in %, wherein it can be seen that throughout the five years, the company experienced both positive and negative stock returns. This suggests that the company had a deep fluctuation of stock prices in the NYSE, causing the daily return to remain unstable from positive to negative and vice versa on a daily basis. In a few instances, the daily return was recorded at 0%, which means there have not been any changes in the prices of the present day and last day of the company's stock (Li, Wu & Wang, 2020). The volatility of daily stock prices increased rapidly for the automobile business in recent years that reflecting the returns as -13%, -8%, -3% and so on (Finance. yahoo, 2021). Talking about Pfizer, the daily price return remained comparably stable for the business in the past 5 years. A consistency of daily stock return was observed for Pfizer throughout the period, wherein in the initial years, a positive return % was observed, indicating that the prices of stocks had gradually increased by the company. Similarly, in the later years, both mixture of positive and negative % was seen as a daily return causing a simultaneous increase and decrease in the stock prices due to market demand and market supply of shares prices in the stock market. No extreme changes in the daily returns were observed for Pfizer.
3. Stock price return
The mean stock price return is commonly known as the expected return and is referred to as the amount of stock return on a daily basis. In capital budgeting theory, a mean return is the value of the probability distribution of the possible stock return. The mean stock return is usually computed by the investors from the historical prices (HoseinzadeandHaratizadeh, 2018).
Tesla's mean stock price return at the end of 5 years is 0.344%. This means a profit-making situation for the company. The computation of mean return helps the investors to define the quantitative relationship between the risk of the investment portfolio and the potential return. In the given case of Tesla, the relationship between risk and return is positive. It means lower risk in the portfolio of securities shall generate lower returns to the investors and vice versa. This suggests that risk-averse investors should purchase stocks of Tesla to profit from the investment. However, a mean return does not guarantee that a future rate of return is based on the results derived. Rather, it is one of the popular investment tools that must be considered by an investor while evaluating an investment decision before purchasing the stock of a listed company.
The mean stock price return for Pfizer at the end of 5 years is 0.048% (Finance. yahoo, 2021). It is exactly the same situation as in the case of Tesla that states a positive relationship between risk and return. However, the proportion of positive risk-return is higher for Pfizer in comparison to Tesla. The investors who are interested in purchasing stocks of Pfizer and/or Tesla can calculate the expected return or the mean of the portfolio of investments to help him in achieving a better understanding of how definite securities shall have an impact on the investment portfolio as a whole (Pang et al., 2020). The investors can add and alter securities as a part of the investment analysis process to make the mean of the stock price return by visualising the pros and cons of each of the investment opportunities. It shall enable the investor to build a portfolio that meets a permissible risk tolerance level.
In both cases, a positive mean return was generated. There are many factors that cause a stock to have a positive mean return. The current performance of the company, favourable situation in the industrial sector and deflation in the economy have caused both Pfizer and Tesla to record a positive return byinflowing a major part of its investment value.
4. Median stock price return
The median stock price return is the middle return stock price of a sorted list for each independent security return. The median price return defines a good rate of return for the stock. In a general sense, an average annual return of 10% or above is considered to be a good ROI for the long-term investment in the stock market (Gandhmaland Kumar, 2019). However, there are several governing factors that differ a good rate of return for the business. The medianstock price return for Tesla has been 0.166% in the last 5 years (Finance. yahoo, 2021). It is the annualised return on the Compound Annual Growth Rate or CAGR for stocks of Tesla. It suggests that the daily stock price media for Tesla is 0.166% which is the distribution of stock prices umpteen years into the future. Similarly, for Pfizer, the median stock price return is -0.026% which is lower than Tesla (Finance. yahoo, 2021). It translates the middle price of the overall daily stock price recorded by the company. This figure suggests that both Tesla and Pfizer have shown a larger decline in the daily stock price in comparison to the increase in daily stock prices.
5. Frequency distribution
The frequency distribution is either a tabular or graphical representation that illustrates the number of observations within a specific interval. The size of the class interval depends upon the kind of data analysed and the goals of the analyst. The class intervals are mutually exclusive and exhaustive (Zhang et al., 2019).
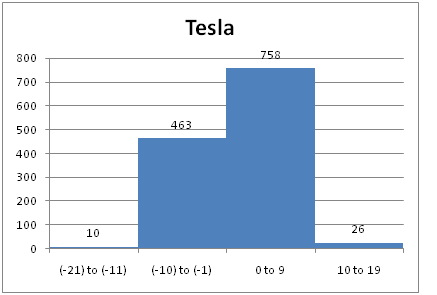
The table shows the class interval as an equidistance of 10 classes to find out the respective frequency of Tesla's stock price return in the past 5 years. The class intervals are -21% to -11%, -10% to -1%, 0% to 9%, 10% to 19%. The frequency for each of the classes for Tesla was 10, 463, 758 and 26, respectively (Finance. yahoo, 2021). It can be observed that the highest frequency of stock price return was depicted between 0% and 9%, which is followed by -10% and -1% as 463. This means that the company has reported its daily return largely at a decreasing price from the previous day and/or maintained the same to a maximum 9% change in daily return from 2016 to 2021 (Finance. yahoo, 2021).
|
Tesla Inc. |
||
|
Class interval |
Frequency |
|
|
(-21) to (-11) |
10 |
1% |
|
(-10) to (-1) |
463 |
37% |
|
0 to 9 |
758 |
60% |
|
10 to 19 |
26 |
2% |
|
1257 |
100% |
|
(Source: Finance. yahoo, 2021)
(Source: Finance. yahoo, 2021)
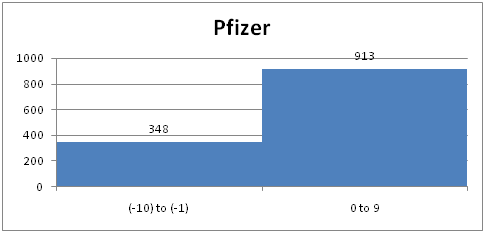
The histogram above shows the frequency distribution table results in graphical form (Nabipour et al., 2020). The entire data for 1257 days is organised based on the daily stock price return in groups of 10 intervals. The histogram shows the condensed data series of the tabular representation made by grouping them into logical and rationale ranges or bins. The vertical columns for the class interval -10% to -1% illustrate 463 as the frequency, and the class interval of 0% to 9% represent 758 as its desired frequency(Finance. yahoo, 2021). The other class intervals have scored the frequency as 10 for -21% to 11%, 26 for 10% to 19%. In the case of Pfizer, a similar class interval was adopted to display the frequency table and frequency %. The class intervals are -10% to -1% and 0% to 9%. The frequency distribution for each class interval was as follows 348 for -10% to -1% and 913 for 0% to 9% (Finance.yahoo, 2021). The total number of days traded in the 5 years is 1261days. The frequency % represents the % of daily stock price return with respect to each class interval.
Pfizer
|
Pfizer |
||
|
Class interval |
Frequency |
Frequency % |
|
(-10) to (-1) |
348 |
28% |
|
0 to 9 |
913 |
72% |
|
|
1267 |
100% |
(Source: Finance. yahoo, 2021)
(Source: Finance. yahoo, 2021)
In comparing the frequency distribution of Tesla and Pfizer, it can be seen that in both the chances, the fluctuation of daily stock price return was majorly found between -10% and -1% and 0% and 9% class interval. However, the proportionate change is larger for Tesla in comparison to Pfizer at -10% to -1%, which is vice versa in the case of 0% to 9%. For the -10% to -1% class interval, the daily stock price return for Tesla was 463, whereasPfizer reported it as 913(Finance. yahoo, 2021). On the other hand, the frequency for Tesla for class intervals 0% to 9% was 758 than it was for 913 for Pfizer. This indicates prices have largely fallen in the following day for Tesla, whereas prices of stock have increased on the following day for Pfizer.
6. Most frequent stock price return range
The most frequent stock price return range that was observed from the frequency distribution table of both the companies isthe same. In the case of Tesla, it was 0% to 9% that reported the highest frequency in the table, which is 758, which is 60% as frequency % change of daily stock price return. In the case of Pfizer, the stock price range is 0% to 9% that reported the highest frequency in the table, which is 913, which is 72% as frequency % change of daily stock price return(Finance. yahoo, 2021). This means that daily prices of the stocks for both Pfizer and Tesla have shown the increased price in the following date.
7. Variance and standard deviation of the stock price returns
Variance is the statistical measure that states the distance spread between the numbers in the data set. In other words, variance measures how far or near each number is in the data set from its mean and, therefore, from every other observation in the dataset (Ntiet al., 2020). The variance is depicted as 2. It is used for measuring the volatility and market security of shares in the stock market. The variance of stock price return for Tesla is 0.001. The variance is very low for the company indicating that there is very little volatility or risk in the market to trade in the stocks of Tesla. Investors are interested in trading in stocks whose risk or variance is low. Therefore, Tesla is a favourable choice for the investors to make investment decisions for the company. The variance of stocks for Pfizer between November 2016 and November 2021 is 0.0002 (Finance. yahoo, 2021). It is also less for the company, indicating that it is safe for the investors to make an investment in this business. However, it is comparatively higher with regards to Tesla, meaning that stocks of Pfizer carry a marginally higher risk in comparison to Tesla. In case the investors are doubtful to choose between the companies, Tesla is a better choice than Pfizer.
Standard deviation is a statistic that evaluates the dispersion of a given dataset in relation to the mean value (Chung and Shin, 2018). The standard deviation is computed as the square root of the variance that is determined from each of the data points that is deviated in relation to the mean. In the stock market, the standard deviation is computed as all kinds of uncertainty as to the risk when it is in favour of the investors that are above the average return. The standard deviation for the daily stock return of Tesla is 0.038. The standard deviation is used to inform the investors of Tesla as well as the prospective investors of the risk of a stock or the investment portfolio. The volatility of shares for Tesla is 0.038, which is very less (Finance. yahoo, 2021). The greater the volatility or standard deviation of stock, the larger is the deviation from the average return of the stock. The standard deviation of Pfizer for the past 5 years of average stock return is 0.014. It can be observed that the SD of Pfizer is quite low in comparison to Tesla (Althelayaet al., 2018). It means investors of Pfizer faces 1.4% of risk while making an investment in the company, whereas it is 3.8% for Tesla. There is a contradictory result in the case of the volatility of stock return for both the company with regards to variance and SD. In such a situation, SD shall be given more priority as it involves exhaustive choices of the investors. Therefore, it is safer to make an investment in Pfizer than in Tesla due to lower SD results.
8. Relationship between the stock prices
The relationship of stock prices between Tesla and Pfizer is positive at 0.120104. This states that with an increase in the price of Tesla’s stocks, the prices of Pfizer shall also rise by 12%. Similarly, with a rise of Pfizer’s shares, the stocks of Tesla shall increase by 12% as well. Therefore, both the companies’ shares a positive correlation with one another (Shah et al., 2019). Although both the companies experience a positive correlation with one another, it is weak to moderate though. A positive correlation suggests that changes in one variable suppose Tesla's shares shall be related to the similar kind of change in the other variable, which is Pfizer's shares (Finance. yahoo, 2021). A correlation is said to be moderate when it is less than 0.25. This suggests that there is some kind of relationship between the stock prices of Pfizer and Tesla. However, there is a large number of randomness that is affecting either one variable or both. This suggests although both the variable are positive, they are not very strong to cause a noticeable impact on the other when one variable changes.
|
|
TSLA |
PFE |
|
TSLA |
1 |
|
|
PFE |
0.120104 |
1 |
(Source: Finance.yahoo, 2021)
Although a change in either of the stock price shall bring forth a positive change on the other, however, such change shall not make any vital change in the decision-making of the other company. The correlation coefficient is a statistical measure that determines how strong or weak the statistical relationship is between two variables (Sharmaet al., 2017). In the given case, the correlation coefficient between Pfizer and Tesla is 0.120104 or 12% (Finance. yahoo, 2021). The Pearson's correlation or R is used to find the linear regression for the stock price of Tesla and Pfizer. A positive correlation is derived between the stock prices of Tesla and Pfizer, reflecting a simultaneous impact of the changes in the prices of stock by 0.120104 (Finance. yahoo, 2021). The meaning of these results states that a change in the prices of stock for Tesla or Pfizer shall reflect a positive change on the other by 12%. It was expected to derive a low correlation between the companies as for both, the changes in the stock return did not fluctuate much.
9. Historical average stock market return
If the historical average stock market return is 10% and the standard deviation for (S&P500) is 15%, then as an investor, I will definitely invest in this company. According to the historical knowledge of stock performance, the annual average return of around 10% is considered to be moderate. It is regarded as far from the average return of the stock prices. However, LSE is a very volatile market, and in the past 5 years, the stock prices of large companies like Pfizer and Tesla reported wide fluctuation in the annual prices of stock. Therefore, a return of 10% is said to be positive and fair for a given year. For most investors, an annual return of 10% is considered to be a favourable ROI for the business, especially for long-term investment in the stock market (Simet al.,2019). Therefore, I can rely on investing in such stocks that shall derive a guaranteed 10% return on my invested capital. I also need to understand that this value is average which means in a few years, the returns can be lower than 10%, whereas, in some years, it can be more than 10% as well. (Finance. yahoo, 2021). However, in the past 10 years, that is 2011 to 2020, the nominal annualised return is considered to be 13.9%, and the adjusted annualised real return is 11.96% (Finance. yahoo, 2021). This means the expected return of 10% is low, which makes me choose among the other alternative available in the market for investment.
An S&P 500 index fund producing a standard deviation of 15% is suggested to be best for the portfolio investment. This means that the value of the stock has deviated by 15% from the mean value of the portfolio investment (MogharandHamiche, 2020). Under this given condition, I will make an investment into such a company as it shall reap me a higher return in comparison to the risk of an investment that I shall bear. A good standard deviation for investment is regarded as around 68%. Therefore, a deviation of only 15% of the stock is a favourable situation for me. When I shall be using SD for measuring the risk in comparison to the return I shall derive in the stock market, I shall make an underlying assumption that most of the stock prices will follow the pattern of normal distribution. In the given case, the return is 10% in comparison to 15% risks (Finance. yahoo, 2021). Despite such a situation, I will invest in such a company; as for other businesses, such high returns will not be available at comparatively low risk. A standard deviation of 0 shall mean that an investment has a return that does not vary, for example, a bank account that pays compound interest at a fixed rate.
Conclusion
It can be concluded that statistical tools like central tendency and measures of dispersion are used by the business manager to organise, analyse and interpret the available data for decision-making. Statistical research like daily stock price return has enabled the business managers of Tesla and Pfizer to predict the future stock market performance of the business. The results derived from the statistical research shall be used by investors in making future investment decisions for them. Overall from the 5 years of analysis, Tesla's stock market performance has seen a wide fluctuation in terms of opening share price, closing share price in comparison to Pfizer. The volatility of share prices is higher for Tesla than Pfizer, causing a higher risk of investment for the investors of Tesla than Pfizer. For instance, the volatility of share prices and standard deviation for Tesla was higher than Pfizer, making the form highly sensitive shares for investment.
Reference List
About Tesla | Tesla., (2021). Available on: 3 November 2021, from https://www.tesla.com/about
Althelaya, K. A., El-Alfy, E. S. M. and Mohammed, S., 2018, April.Evaluation of bidirectional LSTM for short-and long-term stock market prediction.In 2018 9th international conference on information and communication systems (ICICS) (pp. 151-156).IEEE.
Chung, H. and Shin, K. S., 2018.Genetic algorithm-optimized algorithm-optimised long short-term memory network for stock market prediction. Sustainability, 10(10), 3765.
Gandhmal, D. P. and Kumar, K., 2019. Systematic analysis and review of stock market prediction techniques. Computer Science Review, 34, 100190.
Hiransha, M., Gopalakrishnan, E. A., Menon, V. K. and Soman, K. P., 2018.NSE stock market prediction using deep-learning models. Procedia computer science, 132, 1351-1362.
Hoseinzade, E. and Haratizadeh, S., 2019. CNNpred: CNN-based stock market prediction using a diverse set of variables. Expert Systems with Applications, 129, 273-285.
Jiang, W., 2021. Applications of deep learning in stock market prediction: recent progress. Expert Systems with Applications, 115537.
Li, X., Wu, P. and Wang, W., 2020.Incorporating stock prices and news sentiments for stock market prediction: A case of Hong Kong. Information Processing & Management, 57(5), 102212.
Moghar, A. and Hamiche, M., 2020.Stock market prediction using LSTM recurrent neural network. Procedia Computer Science, 170, 1168-1173.
Nabipour, M., Nayyeri, P., Jabani, H., Mosavi, A. and Salwana, E., 2020.Deep learning for stock market prediction. Entropy, 22(8), 840.
Nti, I. K., Adekoya, A. F. and Weyori, B. A., 2020.A comprehensive evaluation of ensemble learning for stock-market prediction. Journal of Big Data, 7(1), 1-40.
Pang, X., Zhou, Y., Wang, P., Lin, W. and Chang, V., 2020.An innovative neural network approach for stock market prediction.Statistics assignment The Journal of Supercomputing, 76(3), 2098-2118.
Pfizer: One of the world's premier biopharmaceutical companies| Pfizer (2021). Available at: https://www.pfizer.com/ (Accessed: 3 November 2021).
Shah, D., Isah, H. and Zulkernine, F., 2019. Stock market analysis: A review and taxonomy of prediction techniques. International Journal of Financial Studies, 7(2), 26. Sharma, A., Bhuriya, D. and Singh, U., 2017, April.Survey of stock market prediction using machine learning approach.In 2017 international conference of electronics, communication and aerospace technology (ICECA) (Vol. 2, pp. 506-509).IEEE.
Sim, H. S., Kim, H. I. and Ahn, J. J., 2019. Is deep learning for image recognition applicable to stock market prediction. Complexity, 2019.
Vargas, M. R., De Lima, B. S. and Evsukoff, A. G., 2017, June.Deep learning for stock market prediction from financial news articles.In 2017 IEEE international conference on computational intelligence and virtual environments for measurement systems and applications (CIVEMSA) (pp. 60-65).IEEE.
Yahoo is part of the Yahoo family of brands. (2021). Available 3 November 2021, from https://finance.yahoo.com/quote/TSLA/historyp=TSLA Yahoo is part of the Yahoo family of brands. (2021). Available 3 November 2021, from https://finance.yahoo.com/quote/PFE/historyp=PFE
Zhang, K., Zhong, G., Dong, J., Wang, S., & Wang, Y. (2019).Stock market prediction based on generative adversarial network. Procedia computer science, 147, 400-406.
Zhang, X., Zhang, Y., Wang, S., Yao, Y., Fang, B. and Philip, S. Y., 2018.Improving stock market prediction via heterogeneous information fusion. Knowledge-Based Systems, 143, 236-247.
Zhou, X., Pan, Z., Hu, G., Tang, S. and Zhao, C., 2018.Stock market prediction on high-frequency data using generative adversarial nets. Mathematical Problems in Engineering, 2018.


