
Statistics Assignment: One-Way ANOVA To Determine Contemporary Issues
Question
Task:
Your policy agency is interested in understanding whether there is a difference in education level among officers in different specialisation, such as Narcotics Investigations, Traffic Enforcement and SWAT. This type of information can help determine whether particular educational backgrounds are more likely to end up in particular units, which could be helpful for recruiting and diversity purposes. One way to investigate this is through an analysis of variance (ANOVA). ANOVA is a type of analysis that helps determine whether there are differences on a continuous variable (such as years of education) among different categories or groups (such as policy unit).
You have been tasked with conducting a study comparing the years of education completed between different officer specialization groups Group 1 is Narcotics Investigations, Group 2 is Traffic Enforcement Officers and Group 3 is SWAT Officers.
This statistics assignment has 3 steps.
Step 1: Use what you learned in your intellipath lessons to help conduct this analysis and answer the questions that follow
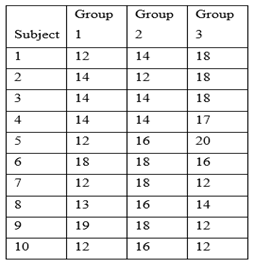
Step 2: Follow the instructions below to conduct the ANOVA in Microsoft Excel. The data you will use is in the following table:
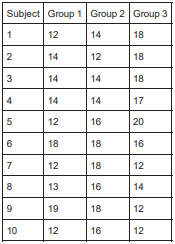
For reference: Group1= Narcotics Investigators, Group2= Traffic Enforcement Officers, Group3= SWAT Officers; 12= high school/GED, 14= Associate’s, 16= Bachelor’s, 18= Master’s, and 20= Doctorate
Steps for analysis in Excel:
- Cut and paste the data from the table above into Microsoft Excel.
- Click the Data tab and then the Data Analysis button to open the statistical analysis dialogue box.
- Choose "ANOVA: Single Factor" as the type of analysis.
- Click into the input range box, and then highlight all of the data in the Group 1, Group 2 and Group 3 columns.
- Click the Labels in First Row box to ensure Excel does not try to analyze the column headers as data.
- Click the New Worksheet Ply button so that Excel spits the data output into a new worksheet
- Click "OK" to run the analysis.
Step 2: Answer the following questions using the analysis results that you generated:
- What is the average years of education for Group 1 (Narcotics Investigators)?
- What is the Average years of education for Group 3 (SWAT Officers)?
- What is the pvalue for your ANOVA model? Is the pvalue greater than or less than 0.05?
- Do you reject or accept the null hypothesis that states, “There is no difference between the groups in years of education?”
- Which group, on average, has the most years of education?
Why did you reject or accept the null hypothesis?
Answer
Introduction
According to the findings of this statistics assignment, a one-way ANOVA is used to determine if police in different specialties, such as Enforcement of Traffic, Investigations of Narcotics, and SWAT, have varying degrees of education. One-way ANOVA is a highly helpful technique for determining even if there aren't statistically significant difference between means of two or more distinct (unrelated) groups (Baur, N., & Lamnek, 2019). Primary objective of this study is to evaluate even if there isn't a difference in the education level between both the two groups of participants. Police special agents acquire evidence of suspected crimes by relying on reliable statistical data compiled by the police department. It is hoped that this study would assist police agencies in better understanding if there is a disparity in educational status among officers of law enforcement in different specialties, such as Investigations of Narcotics and Enforcement of Traffic as well as SWAT, based on the findings of one-way ANOVA (Tipton, Pustejovsky, and Ahmadi, 2019).
Research questions:
- Group 1 (Investigations of Narcotics) members have a min average of a year of schooling.
- Group 3 (Officers of SWAT) have a min average of how many education years?
- For your ANOVA model, what is the p-value?
- Does the p-value exceed or fall below 0.05? The null hypothesis indicates that reflects no variation in the years of schooling between the groups. Do you accept this or reject this as the null? Why have you selected to accept or reject the null hypothesis, respectively?
- In terms of total years of schooling, which group has the most?
Table 1: Research data
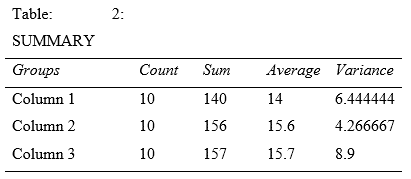
Answer 1: the number of years is 14
Answer 2: The number of years is 15.7
Answer 3: The value of p in the ANNOVA model is 0.265835659. Hence it appears to be greater than the value 0.05
Answer 4: The acceptance of null hypothesis was reflected.
a) In this study, the researchers hypothesised that police officers in different specialties, such as narcotics investigations, traffic enforcement, and SWAT, had varying degrees of educational attainment. A consequence of these findings is the null hypothesis, which is based on the premise that there is no variance in the educational level of police officers across various professions. We may make the assumption that all groups have the same mean value by employing ANOVA's null hypothesis. When comparing two groups, an ANOVA is used since there is no such thing as a common mean in both groups. On the off chance that the null hypothesis is dismissed, the p esteem is utilized to decide if the invalid speculation ought to be acknowledged. In the event that the likelihood of the null hypothesis is under 0.05, the invalid theory ought to be dismissed. Accordingly, almost certainly, the normal worth of the reliant variable will contrast among all gatherings that have been measurably broke down. If the null hypothesis is rejected, it means that at least two groups do not share characteristics (Goos&Meintrup, 2018). The p value for the ANOVA was calculated to be 0.265835659. (Goos, &Meintrup, 2018). Because the p value is larger than 0.05, it is recommended that the null hypothesis be accepted. This shows that there is no difference in educational attainment across police officers of different professions, according to the data.
Answer 5: Group 1, Group 2, and Group 3 all had average ages of 14, 15.6 years, and 15.7 years. This suggests that the SWAT officers in Group 3 have the highest schooling.
Data analysis and Results Presentation
ANOVA: Single Factor
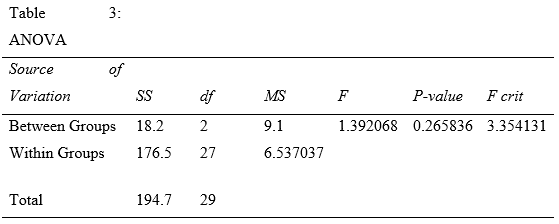
Average education levels for Group 1 (Narcotics Investigators) and Group 3 (SWAT Officers) are 14 and 15.7 years, respectively (Paolella, 2018). The null hypothesis is rejected if the p-value is less than 0.05 and the alpha significance threshold is more than 0.05. Otherwise, the hypothesis is not rejected (Hare, T. A., Camerer, C. F., & Rangel, 2020). Table 3 shows an ANOVA model with a p-value of 0.265836. That's a significant p-value (=0.05) higher than the alpha cut-off. If the null hypothesis is not rejected, then this indicates that it has failed. In light of these findings, it cannot be concluded that there is a difference in educational attainment between the two groups. Group 3 (SWAT Officers) has the most years of schooling on average, according to the data.
Conclusion
In order to test the hypothesis that there is a difference in education between the two groups, as well as to address additional research concerns, this study was conducted (Frossard, and Renaud, 2021). This study found that there is no difference in the number of years of schooling between the two groups. It was discovered that Group 3 (SWAT Officers) had the greatest years of schooling, on average, whilst Group 1 (Narcotics Investigators) had the least. In general, as evidenced by data analysis, there are no educational differences among police officers with various specialities, such as Narcotics Investigations.
References
Baur, N., &Lamnek, S. (2019). Multivariate analysis. The Blackwell Encyclopedia of Sociology, 1-3
Breitsohl, H., 2019. Beyond ANOVA: An introduction to structural equation models for experimental designs. Organizational Research Methods, 22(3), pp.649-677.
Frossard, J. and Renaud, O., 2021. Permutation Tests for Regression, ANOVA, and Comparison of Signals: The permuco Package. Statistics assignment Journal of Statistical Software, 99, pp.1-32.
Goos, P., &Meintrup, D. (2018). Statistics with JMP: Hypothesis Tests, ANOVA and Regression. Hoboken, NJ: John Wiley & Sons.
Hare, T. A., Camerer, C. F., & Rangel, A. (2020). Self-control in decision-making involves modulation of the vmPFC valuation system. Science, 324(5927), 646-648.
Paolella, M.S., 2018. Linear models and time-series analysis: regression, ANOVA, ARMA and GARCH. John Wiley & Sons.
Tipton, E., Pustejovsky, J.E. and Ahmadi, H., 2019. Current practices in meta?regression in psychology, education, and medicine. Research synthesis methods, 10(2), pp.180-194.


