
Statistics Assignment Analysing Household Data
Question
Task:
Consider the house hold data set and complete the following tasks to prepare this statistics assignment:
Task 1:
A. I) Draw a random sample 250 households as per the sample selection procedure.
ii) The sampling method adopted in (i) is called simple random sampling. In less than 200 words, discuss what it is, its advantages and disadvantages.
iii) It is argued that the stratified sampling method can be more useful than simple random sampling in this case. Discuss what it is and how it can be implemented to capture the (population) characteristics of the households, more effectively than simple random sampling.
B. Compute the descriptive statistics and draw Box-Whisker plots of expenditures on the following variables:
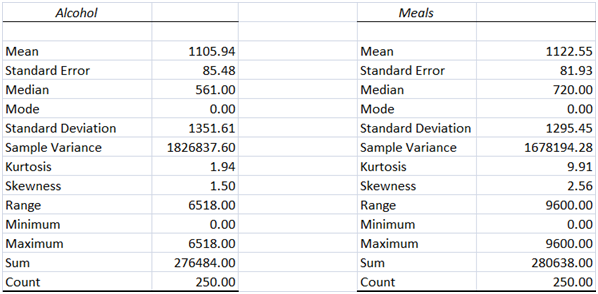
i) Alcohol
ii) Meals
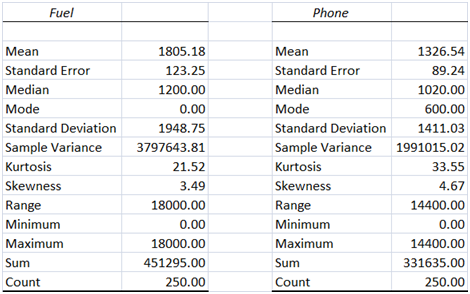
iii) Fuel
iv) Phone
C. Use information from the descriptive statistics and the Box-Whisker plots in part (B) above to present a summary of your findings by contrasting different features of these distributions: i) central tendency; ii) spread iii) shape
Task 2
A. Calculate the 10th and 90th percentiles of the household’s annual after-tax income (Ataxlnc). Explain, in less than 100 words, what information these two values carry terms of the distribution of the after-tax income?
B. The series OwnHouse is a dummy variable that takes 1 if household owns their house and 0 otherwise. Find the proportion of the households who own a house in your sample. Using this proportion as an estimate of the probability of house ownership, calculate the probability that three of the five randomly chosen households own a house.
C. Draw a scatter plot of the total expenditures against the after-tax income and calculate the correlation coefficient. Based on these information, explain, in less than 100 words, your finding about the features of liner relationship between the two variables.
Task 3
A. Construct a contingency table between the gender (GHH) and the level of education
B. What is the probability that a randomly chosen head of a household is male and his higher level of education is Master?
C. What is the probability of having male among those who have the Master degree?
D. What is the probability of having the Bachelor as the highest degree among females?
Answer
Statistics AssignmentTask 1
PART A
(i) A random sample of 250 households has been generated from the data provided. This has been used for further analysis.
(ii) Simple random sampling refers to a probabilistic sampling technique where each element in the population has equal chance of selection. In this sampling method, the population of interest is first identified and then the requisite sample size is chosen from this population randomly. One of the key advantages of this sampling method is that it is easy to implement and convenient. There is because it does not involve any segregation in the population. Since this is simple to perform, hence it is more cost effective and requires limited time. In homogenous data, this sampling method is quite useful as it provides an unbiased random sample. One of the key disadvantages of simple random sampling is that it may lead to a biased sample. This is especially the case when the underlying population is heterogeneous. In this case, people with a particular attribute might be overrepresented at the cost of others.
(iii) For the given scenario, stratified random sampling may be a superior alternative. This sampling technique involves two steps. In the first step, the population is divided in groups based on the key parameters identified considering the research question. In the second step, random samples are selected from each of the groups based on their respective representation in the population. In order to capture the characteristics of the households, all the households would be segregated based on key attributes such as socio-economic status, gender of head, marital status, race and country of origin. After that, random samples would be selected from each group based on their representation in the actual population. This would significantly increase the chances of obtaining a sample which is truly representative of the underlying population.
PART B
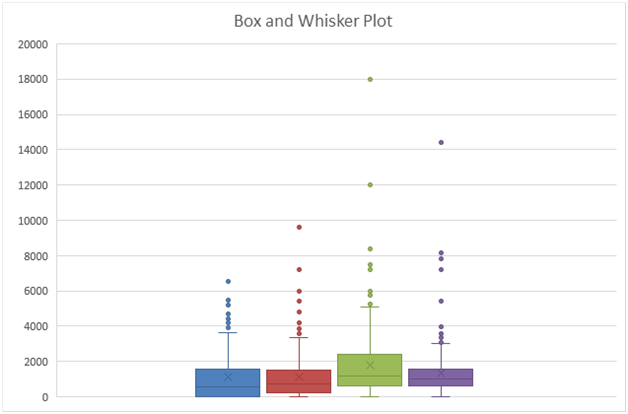
The requisite box and whisker plot for the various expenditure types is indicated as follows.
The descriptive statistics for the various expenditures have been computed using Excel and illustrated as follows.
PART C
i) Central Tendency – From the box and whisker plot, it is evident that for all the four types of expenditures there are outliers present on the higher end owing to which the appropriate measure of central tendency would be the median and not the mean. Using the mean may result in a biased approach to the various expenditures since mean value is significantly impacted by the extreme values.
ii) Spread – The dispersion present in the different expenditure subtypes is different. As compared to other expenditures, the highest dispersion is seen for fuel expenditure. Considering the skewed nature of the all four expenditure types, it would be appropriate to use IQR as the suitable measure of dispersion.
iii) Shape – There is high positive skew coefficient for each of the four expenditures which implies that all the given expenditures are heavily positively skewed owing to the presence of outliers. As a result, the shape of the distribution would be non-normal and asymmetric in shape. There is also significant positive excess kurtosis in all the expenditures which indicates narrower peaks than normal distribution.
Task 2
A) The requisite percentile values have been computed in Excel. The relevant output is pasted below.
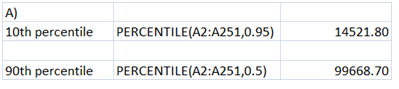
From the above, it can be inferred that there is only 10% of the households that have an annual after tax income not exceeding $14,521.80. Similarly, there are only 10% of the households which annual after tax income exceeds $99,668.70.
B) Requisite probability as computed using Excel is 0.2926.
C) The scatter plot has been obtained using Excel and pasted below.
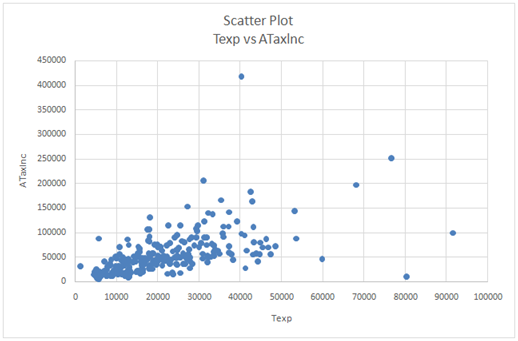
Correlation coefficient = 0.5507
There is a positive relationship between the two variables.
However, the strength of the relationship is moderate only since the correlation coefficient does not exceed 0.6.
Task 3
a) The contingency table between gender and level of education is indicated as follows.
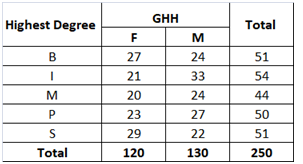
b) P(Male and Master) = (24/250) = 0.0960
c) P(Male l Master) = (24/44) = 0.5455
d) P(Bachelor l Female) = (27/120) = 0.2250


