
Role of Artificial intelligence towards developing effective retail industry business strategies
Question
Assessment 2
This is an individual, written assessment, to be completed in report format. You are required to write around 3,000 words (+/- 10%), excluding title page, preliminaries, tables, figures, reference list and appendices. The report requires in-text referencing and a full reference list in APA style, with evidence that you have critically read and integrated a minimum of 20 suitable scholarly references.
The purpose of this assessment is to present the final report of the Professional Project you proposed in Assignment 1. This report should build upon both components of your Assessment 1 and it should be developed with the help of the tutor/co-ordinator feedback.
In order to successfully complete Assessment 2, you are required to carry out the investigation you have proposed in Assessment 1 and produce a professional research report that shows that you have followed through from finding a research question to answering that question and developing recommendations that arise from your findings. The report will follow the typical structure of a research report and will need to include the following:
- Project title
- Introduction (which must include some justification of your topic and your project's aim and research question(s))
- Critical literature review
- A detailed presentation of how you carried out your project (commensurate with a 'Methods' chapter)
- Findings from your secondary data analysis
- Discussion of findings in light of your previously reviewed literature
- Conclusion, including recommendations and limitations
- Title, background, definitions
- Justification, aim and objectives/research questions
- Quality and coherence of introduction and conclusion
- Critical literature review
- Methods
- Findings and analysis
- Discussion
- Written communication
- Quality and appropriateness of references, and accuracy of referencing
Answer
Executive Summary
As the number of businesses being established by young entrepreneur’s increases each year, the pressure on existing and newly established businesses to build a brand name and register profits is also rising. More businesses indicate increase competition, for businesses to retain their market position it is mandatory to adopt Artificial intelligence technologies and tools. This report will explore the use of data analytics towards business analysis and ways in which the technologies can be used by business owners, marketing, sales and operations teams to maximize profits, determine peak demand and production period and minimize losses. The analysis will be performed using a Australian retail industry dataset which would be analysed using ms excel to help determine important trends and movements which can be used for further investigations. The report shall explore strategies that can be used to screen data after which the finding shall be reported and recommendations provided linked to improving business operations through the use of data analytics and Artificial intelligence.
Introduction
Artificial intelligence has helped revolutionize the global business world. Organizations are today able to utilize computer programs to perform in-depth analyses of historical data to reveal important trends that can be used to steer the organization's future operations. In business, Artificial intelligence is taking the most prominent position with regards to performing data analysis and statistical tools which can be used to analyze business data to determine important trends to help the marketing, sales, and operations departments prepare for future market fluctuations (Jourdan et al., 2008). These take shape of both increments and reductions in customer interest and sales which allows the business to modify its operation plans accordingly to minimize expenditure and maximize profits. To prepare this report effectively a data set (TABLE 2. Retail Turnover, By Industry Group - Percentage change from previous month) has been downloaded from the Australian Bureau of statistic from the following link (Statistics, 2018). A copy of the data set has also been attached to the assessment for further analysis. The data set has been filtered leaving only necessary information and data which would be analysed using Ms Excel to generate basic graphics which would then be used to deliver a visual depiction of the power within data analytics and its importance to the business world (Breese et al., 1998). The report shall focus on responding to answering four questions raised on the project proposal as mentioned below.
- How effective and efficient could be AI in performing business operational activities?
- Can AI contribute to enhancing the customer targeting practice or can it be helpful in targeting customers in a much efficient way?
- What are the possible benefits that could be gained through this technological adoption?
- Is it possible to apply AI with e-commerce without hampering the legal rights and ethical issues of the community?
Each of the above questions shall be explored and data analysis performed on the selected data set with the objective of responding to the question with conclusive answers demonstrating the importance and role played by data analytics in modern business.
Critical literature review
Data analytics and machine learning are relatively new fields used in business to generate visual depictions of past data which can be used to predict future trends. According to (Gandomi & Haider, 2015)data analytics is a field which is being broadly adopted by businesses from across the globe due to its ability to organize and transform random data into organized visuals which can then be used to determine movement trends. Data analytics is not limited to numeric data and can also be used to mine words and other data from big data sets helping sift large amounts of data leaving only the most important data. (Stephens et al., 2015) Outlines the important role played by big data towards organizing business operations and the increasing demand as well as the production of big data by organizations across the globe. He further goes on to explain the rapidly increasing value of big data for each organization and how each business depends heavily on data to perform in-depth analysis of the industry before commencing or planning its operations. Further, he continues to point out that every business will have to consider adopting big data analysis by the year 2025 in order to retain their competitive edge on the global market. This point is further supported by (Obermeyer & Emanuel, 2016) who explore the current role played by big data analysis in the healthcare industry and its future role in improving healthcare and patient treatment. Clearly big data and data analytics play an important role in the modern work due to the adoption of digital communication gadgets and Artificial intelligence which help improve monitoring and collecting customer data which can then be used to predict future trends from historical data thus improving business operations (Najafabadi et al., 2015).
A detailed presentation of how you carried out your project
There is a wide variety of Artificial intelligence tools which can be used to analyze the data and generate important as well as valuable visuals outlining business operations. This report and data analysis will be performed using Ms Excel which is adequate to reveal important trends within small and medium-sized datasets (Dhanalakshmi et al., 2016). The data set I would be using comprised of 21 Retail product categories spread across 441 rows. Each row displays data for a single month for each of the retail categories. The 441 rows constitute to data collected from April 1982 to December 2018 a period of 26 years. Due to the vast amount of data I will filter the data and perform the analysis on individual retail product categories which will help reveal specific trends in consumer spending within the retail industry which can then be used to advice stakeholders and businesses on suitable marketing, sales, and manufacturing strategies. The analysis will focus on covering the Food retailing, Household goods retailing and Clothing, footwear, and personal accessory retailing which will help demonstrate how big data can be used with Artificial intelligence to identify information that is capable of improving business operational activities (Xu et al., 2016).
Findings from your secondary data analysis
To vividly understand customer trends, an analysis of three categories of data shall be performed from the data set. This will help deliver a clear outline linked to consumer spending trends and ways in which businesses can use the information to maximize profits and cut losses (Ousterhout et al., 2015). The following categories shall be analysed; Clothing, footwear and personal accessory retailing. Each of the retail industry categories shall be analyzed independently after which a combined analysis shall be prepared to outline the overall analysis findings (Gani et al., 2016).
Food retailing
The data analysis begins with the generation of a simple line graph depicting consumer spending towards food over the 26 year period. This helps determine trends within the data which can further be investigated to deliver concise finding on the research. Below is a visual depiction of the food retailing industry sales data over a 26 year period?
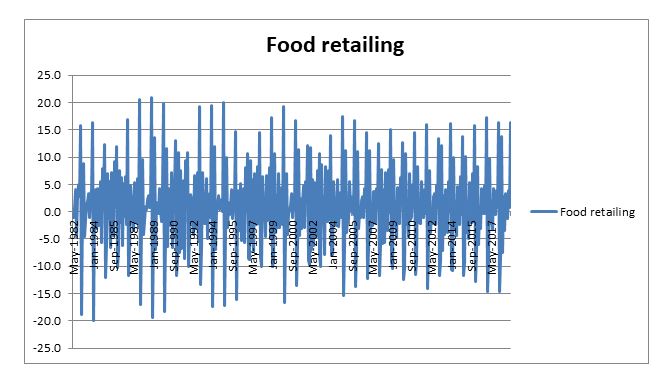
Immediately it is possible to determine Australian consumers are following a predefined pattern each year where there is a time during the year where there is a sudden increase and reduction in the purchase of food (Carlsson et al., 2015). This is an important point which can be further investigated to determine precise months when customers tend to increase their purchases considerably. It is also clear that the consumers continue a positive food purchasing spree in between the year 1988-1989; 1994-1995 and between 1999-2000. During these years the data portrays consumers continued spending on food throughout the year raising another scenario which requires further investigation to validate the trends and also determine the reasons behind increase consumer spending during these selective years (Novio et al., 2016).
Determining factor influencing annual food retails
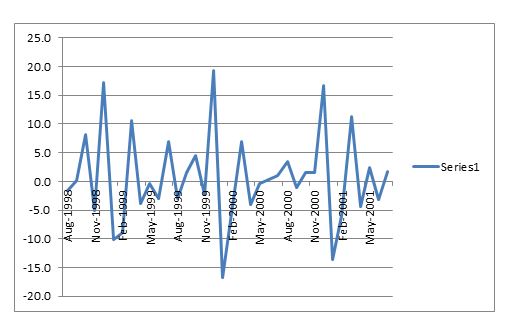
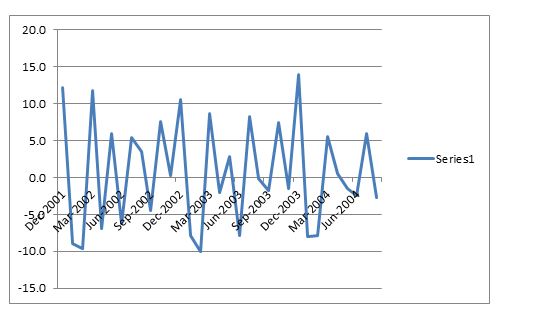
With a clear trend linked to annual spending on food visible, it is critical for a smaller section of the data set to be reviewed to determine specific trends as well as the precise period at which food sales increase or reducing. To generate accurate results 2 sets of data for random years shall be analyzed and compared. Below are visuals generated after performing analysis of the years 1989-1993 and 2002-2006?
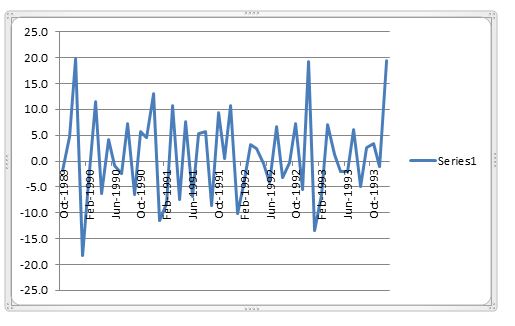
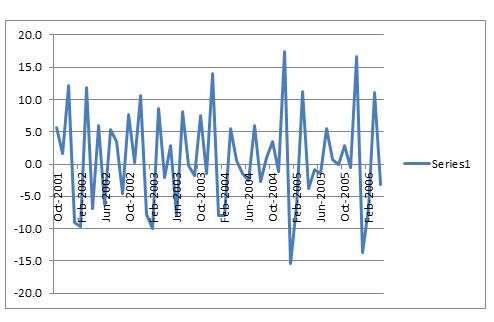
From the above diagrams is become clear the large spending sprees observed on the overall data occur in the month of December. It becomes clear consumers spend 2 to 3 times more during December as opposed to other months. For the retail industry, this clearly indicates an opportunity to maximize sales thus allowing for marketing and sales campaigns to be developed to target consumers during the festive season. Another important observation made after performing data analysis is the immediate reduction of sales in the providing months of January and February. This indicates consumer exhaust their financial resource during the festive season and suddenly reduce their average mending on food by 10 to 15% during the preceding months of January and February (Erevelles et al., 2016). The above analysis clearly demonstrates the power of data analytics and AI toward influencing and improving business operations and profits.
Factors influencing increase spending
The years 1988-1989; 1994-1995 and 1999-2000 also outline steady positive spending towards food throughout the year. This assumption will also be analyzed using the same technique to verify the details after which in-depth investigations can further be reviewed to determine the reasons behind increased spending.
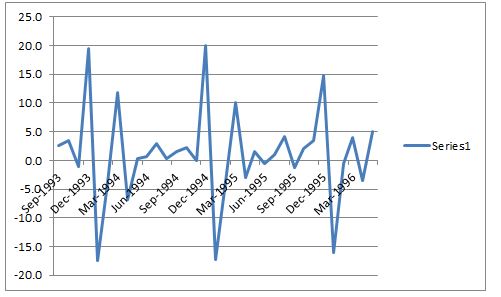
The three above years indicate an increasing amount of spending towards food as opposed to other years where there where larger fluctuations in the amount spent each month. When the above graphs are compared to the below graph, it is clear on common years consumer spending towards food fluctuated considerably on certain months thus indicating a financial influencing factor that requires further investigation during these years (Sacha et al., 2016).
It is clear on ordinary year’s consumer spending fluctuated both above and below the monthly average spending with the largest movements being felt during the December and January. Armed with this insight further investigations can be performed to determine major events which may have occurred during those years in the Australian economy which may have delivered additional financial stability thus influenced consumers to spend more each month.
Household goods retailing
To counter verify common trends and factors influencing consumer spending this can be used towards improving marketing and sales campaigns, additional retail categories also require to be reviewed in the same manner to draw clear and conclusive findings. Below is an overall visual of the household good retail industry.
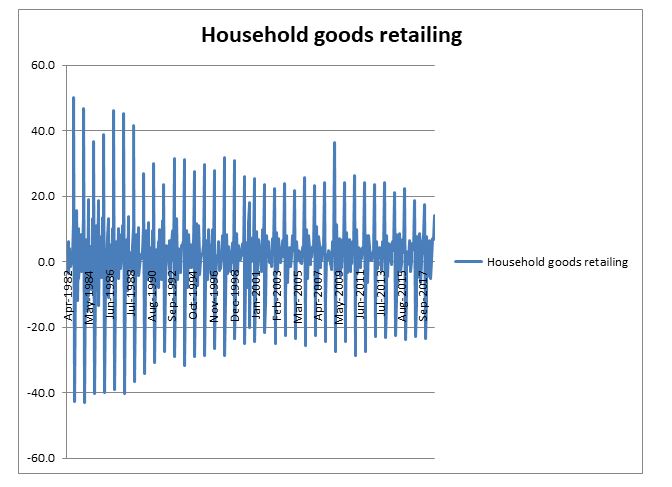
Once again the household good retail industry demonstrates the same trend line with a sudden increase in spending followed by a sharp reduction in spending on household good. One major difference observed between the food and household goods categories is the percentage of change with purchases which is climaxes at 20% for food but is doubled to 40% on household good. This clearly indicates consumers spend considerably more on household good during the festival season but continue spending on household good at a higher rate as opposed to food throughout the year. Further investigations can continue being performed to determine precise data and influencing which can be used by business professionals to enhance their operations, sales and profits.
Discussion of findings in light of your previously reviewed literature
With analysis of an Australian retail sector data set performed and clear finding identified, I will proceed to respond to the four questions asked during the project plan.
How effective and efficient could be AI in performing business operational activities?
AI can be a very effective tool towards performing business operation activities due to AI tools allowing the business analyst review historical data to determine precise market and product segment movements and trends. This has been clearly demonstrated in the food retailing data analysis whereby trends cannot be easily identified in raw data with the necked eye. Businesses cannot rely on small data sets and as the amount of big data produced by businesses and consumers increases, the need to incorporate artificial intelligence the analyze the information and retrieve trends is becoming more important (Razzhivina et al., 2015). Valid data is a major resource towards improving business operations as the data can be mined to determine specific trends. Data filtering allows for unique data to be organized within large data sets after which they can be analyzed to outline specific information. As AI tools become more powerful, so is the level of accuracy which improves prediction rates and analysis. Presently many analytical tools are capable of delivering above 90% accuracy with regarding the predictive analysis making them a huge asset and very effective and efficient tools used in business operations.
Can AI contribute to enhancing the customer targeting practice or can it be helpful in targeting customers in a much efficient way?
Yes AI technologies and tools can easily be used to analyze data and determine specific customer segments and their purchasing habits thus allowing the marketing and sales teams of companies to develop effective customer targeting strategies. While the selected data set is limited to customer spending power in different months, data sets that include consumer gender age, interests, amount spend and other details can be accessed to determine specific information related to their purchasing habits (Radhika et al., 2016). This allows marketing teams to develop extremely accurate data basses targeting specific customer traits based on their shopping trends. The social media has grown to be an important source of data with potential client data being categories based on their country, region, religion, gender, age, and other particulars which deliver a powerful tool with which accurate customer targeting activities can be developed to help a business tap into the largest possible market
What are the possible benefits those could be gained through this technological adoption?
The main and direct benefits linked to adopting AI and data analysis tools are improved efficiency and increased profitability
The efficiency of business operations
Efficiency plays a huge role in the business operation and production costs. AI helps perform analysis and improve efficiency by rapidly reducing time spend performing work as well as reducing the wastage from the manufacturing and production process. Time used to make decisions is also greatly reduced as decision making can be made based on the rapid analysis of data and reporting of the AI tools (Ransbotham et al., 2017). This commonly seems in the Australian equity market where traders are capable of tracking the share prices instantly thus allowing them to make quick decisions based on the instant reporting. In addition to instant reporting, there are multiple algorithms which are used by stock traders to analyze stock movements thus helping improve share price movements to an accuracy of above 90%.
Is it possible to apply AI with e-commerce without hampering the legal rights and ethical issues of the community?Yes is possible to apply Artificial intelligence with e-commerce without hampering the communities legal and ethical rights (Metcalf, 2016). This requires for the business to put in place security facilities which help protect the user data from unethical usage. Most e-commerce websites collect their customer data for analysis towards improving their operations but also have powerful security measures in place to protect the data sets as well as have powerful encryption systems. Most e-commerce sites requirements for the client to accept a consent which is inserted on to their terms and conditions which allows the organization to retain the data and use it for their personal business analysis and business operation improvements (Hoanca et al., 2018). Recently the European Union has made it mandatory for all companies based in the EU to display popups mentioning the website is collecting the consumer’s data thus helping reduce or eliminate ethical concerns which may be associated to us of AI for data collection and analysis on e-commerce websites.
Conclusion, including recommendations and limitations
Artificial intelligence has grown to become amount the most powerful analysis tools a business can access to access its product and market position. As technologies are grown most powerful and easier to access, businesses have larger data sets to analyze and determine specific consumer needs which can be exploited by businesses to increase their sales. The future of business adopting AI technologies is destined to continue growing at a rapid rate and only businesses which adopt the technologies are likely to remain in business. With AI displaying its potential to influence business success directly, it is mandatory for each business owners and management to begin implementing AI technology and tool training programs amount its staff and equipment. Business must adopt modern methods of data collection and storage as this is a basic requirement every business must begin utilizing. AI technologies are dependent on digital input which means businesses must be able to begin collecting and storing all data in digital format in order for the data to be usable on AI technologies and tools. AI technologies continue to increase in demand and continue growing more powerful each day making them a mandatory requirement for every business to adopt in order to retain its market position and continue registering success and profitability.
Bibliography
Breese, J.S., Heckerman, D. & Kadie, C., 1998. Empirical analysis of predictive algorithms for collaborative filtering. In Proceedings of the Fourteenth conference on Uncertainty in artificial intelligence. Morgan Kaufmann Publishers Inc, pp.43-52.
Carlsson, G., Sexton, H. & Singh, G., 2015. Systems and methods for visualization of data analysis. Ayasdi Inc, U.S. Patent 8, pp.972 - 899.
Dhanalakshmi, V., Bino, D. & Saravanan, A.M., 2016. Opinion mining from student feedback data using supervised learning algorithms. In Big Data and Smart City (ICBDSC). 2016 3rd MEC International Conference on IEEE., pp.1-5.
Erevelles, S., Fukawa, N. & Swayne, L., 2016. Big Data consumer analytics and the transformation of marketing. Journal of Business Research, 69(2), pp.897-904.
Gandomi, A. & Haider, M., 2015. Beyond the hype: Big data concepts, methods, and analytics. International Journal of Information Management, 35(2), pp.137-44.
Gani, A., Siddiqa, A., Shamshirband, S. & Hanum, F., 2016. A survey on indexing techniques for big data: taxonomy and performance evaluation. Knowledge and information systems, 46(2), pp.241-84.
Hoanca, B., Marinchak, C.M. & Forrest, E., 2018. Ethical Implications of the General Data Protection Directive for Virtual Personal Marketing Assistants. I. 2018 IEEE International Conference on Big Data, pp.4073-80.
Jourdan, Z., Rainer, R.K. & Marshall, T.E., 2008. Business intelligence: An analysis of the literature. Information Systems Management, 25(2), pp.121-31.
Metcalf, J., 2016. Big data analytics and revision of the common rule. Communications of the ACM, 59(7), pp.31-33.
Najafabadi, M.M. et al., 2015. Deep learning applications and challenges in big data analytics. Journal of Big Data, 2(1), p.1.
Novio, G.L. et al., 2016. Empowering consumers in selected Public Markets in Metro Manila: A framework for the development of AgriWatchPH. 10 Conference (TENCON), 2016 IEEE, pp.2236-41.
Obermeyer, Z. & Emanuel, E.J., 2016. Predicting the future—big data, machine learning, and clinical medicine. The New England journal of medicine, 375(13), p.1216.
Ousterhout, K. et al., 2015. Making Sense of Performance in Data Analytics Frameworks. In NSDI , 15, pp.293-307.
Radhika, V.M., Thottungal, A. & Nizar, M.A., 2016. An enhanced model for behavioral targeting in online advertising. In Data Science and Engineering (ICDSE). 2016 International Conference on IEEE, pp.1-5.
Ransbotham, S., Kiron, D., Gerbert, P. & Reeves, M., 2017. Reshaping Business With Artificial Intelligence: Closing the Gap Between Ambition and Action. MIT Sloan Management Review, 59(1).
Razzhivina, M.A., Yakimovich, B.A. & Korshunov, A.I., 2015. Application of information technologies and principles of lean production for efficiency improvement of machine building enterprises. Pollack Periodica, 10(2), pp.17-23.
Sacha, D. et al., 2016. The role of uncertainty, awareness, and trust in visual analytic. IEEE transactions on visualization and computer graphics, 22(1), pp.240-49.
Statistics, A.B.o., 2018. 8501.0 - Retail Trade, Australia, Dec 2018. [Online] Available at: http://www.abs.gov.au/AUSSTATS/abs@.nsf/DetailsPage/8501.0Dec%202018?OpenDocument [Accessed 4 February 2019].
Stephens, Z.D. et al., 2015. Big data: astronomical or genomical? PLoS biology, 13(7).
Xu, Z., Frankwick, G.L. & Ramirez, E., 2016. Effects of big data analytics and traditional marketing analytics on new product success: A knowledge fusion perspective. Journal of Business Research, 69(5), pp.1562-66.


