
Statistics assignment: Shoes Price analysis in Asian Markets
Question
Task:
Part 1:
1. Construct a pie chart for numbers of men and women shoes. Construct a pie chart for numbers
for the three countries- Thailand, Singapore and China. Present your findings.
2. Construct a cross-classification table of frequencies between gender and country. Plot a
vertical bar chart of frequency (Y variable) and gender (X variable), then group the bar charts
of genders for three countries and comment on the relationship between gender and country
Part 2:
1. Calculate the Mean, Median, Mode, Standard Deviation and Coefficient of Variation, for
prices for men and women shoes, separately. Compare the figures and explain that what
conclusions you can draw from these analyses? Draw a box and Whisker plot for men and
female shoes prices and comment on the shape of the graph.
2. Calculate the Mean, Median, Mode, Standard Deviation and Coefficient of Variation for prices for the three countries – Thailand, Singapore and China, separately. Compare the figures and explain what conclusions you can draw from these analyses? Draws a Box and Whisker plot for each country and comment on the shape of the graph.
Part 3:
Answer the following hypothesis questions:
3. Determine if average prices for female shoes is less than average prices for male shoes.
Compare the result with part 2 question 1. Does the result confirm your previous findings?
(Follow the hypothesis testing steps, 0.05 level of significance, assuming “equal variances”
of populations).
4. Using a scatter graph of price (Y variable on vertical axis) and production cost (X variable,
horizontal axis), comment on the relationship between price and cost.
Answer
Business Problem An Australian manufacturer is developing new line of shoes specifically aimed at the Asian market. In order to understand some Asian markets, sample data has been collected with regards to the shoes already available in Singapore, Thailand and China. In order to better understand the prices and other dynamics of these markets, data comprising of 99 products has been provided for further analysis and interpretation within this statistics assignment.
Statistics Problem
Based on the descriptive statistics provided in the statistics assignment, the sample data summary has been provided in order to indicate the key characteristics of shoes such as country and gender of target customer. Using this analysis, the three given shoe markets can be better understood which would lead to prudent recommendations for the way forward with regards to entering Asian market with the new shoe line. The statistical analysis done in the statistics assignment also involves the use of inferential statistics for determining if the key variables in the dataset tend to exhibit significant different or not.
Analysis
Part 1
Question 1
The pie chart depicting men and women shoes is indicated as follows.
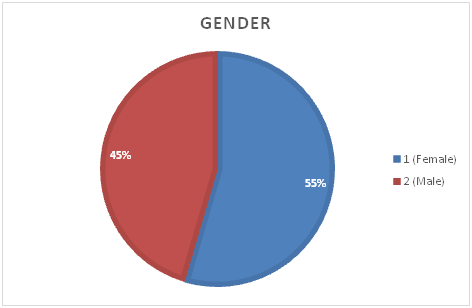
The pie chart highlighted in the above section of statistics assignment indicates that more percentage of shoes included in the sample is for females as compared to males. If the sample is representative of population, then it implies that female shoe is a larger target market when compared with male shoes. However, it would be better if any conclusion is drawn from a bigger sample which might be more representative.
The shoe production market share related pie chart is indicated as follows.
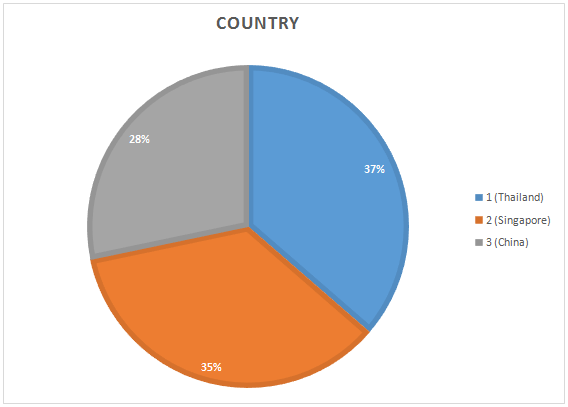
The above pie implies that the sample comprises of higher representation from Thailand market in comparison with other two. Out of the three given countries, the given sample has the lowest share coming from China which indicates that shoe demand may be higher in Thailand & Singapore when compared to China. This seems surprising considering the underlying population and hence a higher sample size is recommended.
Question 2
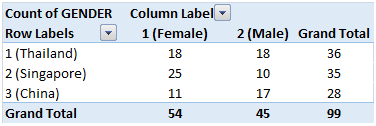
The gender and country cross classification tables using the given sample data is indicated as follows.
The above information provided in the statistics assignment can be graphically summarised as indicated in the following bar chart.
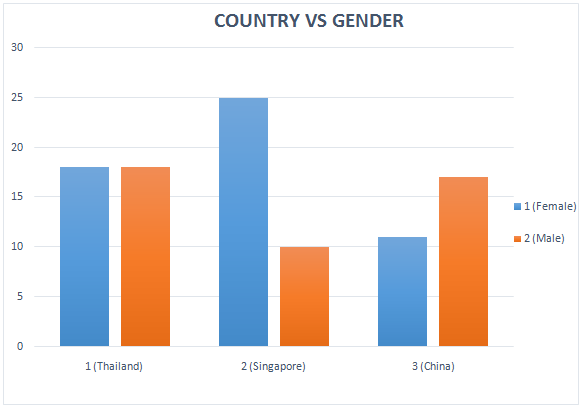
The above table and graph highlight that the shoe sales related distribution of gender varies significantly across the given three countries. In case of Thailand presented in the v, there is no significant difference between male and female shoes but the same cannot be said about Singapore where the female show market seems to be comparatively higher than the male shoe market. With regards to China, the dominant market seems to be the male shoes which seem higher than female shoes. Hence, there potential markets for the two genders in regards to shoes vary significantly across the given three markets.
Part 2
Question 1
The descriptive statistics with regards to the sample shoes for the two genders are summarised in the tabular manner indicated as follows.
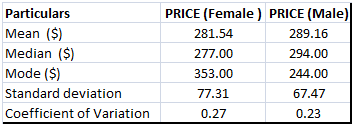
The table mentioned in the above section of statistics assignmenthighlights higher average price being charged for male shoes as compared to female shoes. The difference between the average price is significant with regards to median as compared to mean. Even though the modal price for female shoes is higher, but still it does not impact the conclusion derived above since mean and median favour male shows have a higher average price. The two measures of dispersion i.e. standard deviation and coefficient of variation both are higher for female shoe price in comparison to male shoe price. Also, the dispersion indicators for the two variables suggest that dispersion in prices of shoes for both genders is moderate and not very high.
The sample data on male and female shoe prices is captured through the following box and whisker plot.
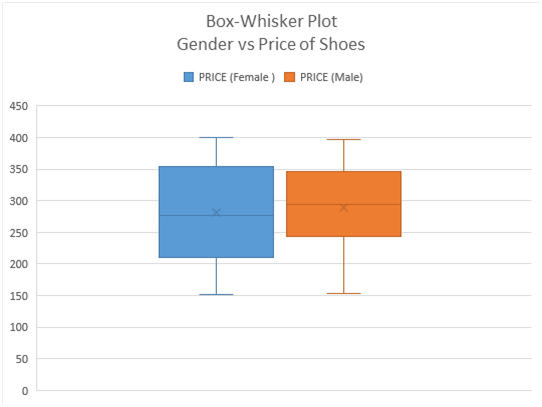
The plot above highlights that price distribution for female shoe price is symmetric. However, this is not true for male shoes where the prices are skewed towards the left as there are certain prices which are abnormally low. For the given sample, the female shoe median price is higher than the male shoe median price.
Question 2
The descriptive analysis for shoe price in the three countries is expressed in the tabular format highlighted as follows.
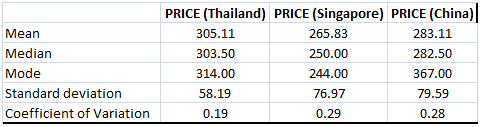
Based on the mean prices, it seems that the shoes are the most expensive in Thailand and cheapest in Singapore. Similar observation is derived based on median prices of shoes. In regards to dispersion, the standard deviation of price is higher for China market while lowest for Thailand market. The coefficient of variation is higher for Singapore and lowest for Thailand. The extent of dispersion in shoe price is moderate for Thailand but high for the other two markets.
The box and whisker plot with regards shoe price based on country is as indicated below.
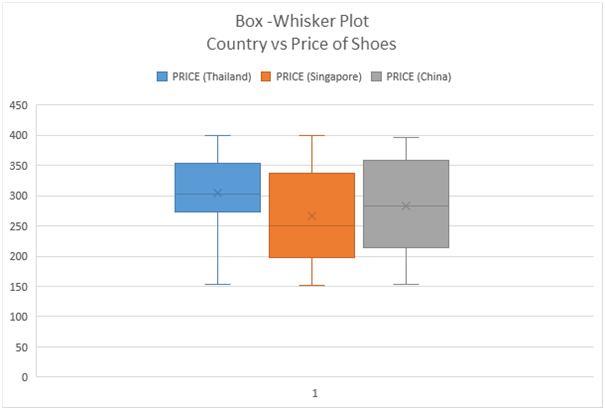
The width of the boxes indicates that variation seems to be lesser than Thailand shoes in comparison to other two markets. Additionally, the shoe prices seem to be symmetrically distribution for the China and Thailand market while the same is not true for Singapore where right or positive skew is apparent. Also, the median prices of shoes are significantly different in the three given markets.
Part 3
Question 1
Hypothesis:A two sample independent test has been used to compare the average price of shoes for the two genders. This has been preferred over Z based test since the population standard deviation for the shoe prices of the two genders is unknown. Besides, independent test has been chosen since it does not impact the other. The requisite hypotheses are as highlighted below within the statistics assignment.
H0: µfemale ? µmale
H1: µfemale < µmale
Level of significance = 0.05
Decision Rule: The null hypothesis would be rejected if the t test statistic would be lower than the t critical value of -1.66 considering that the test is lower one tail test.
The result of the test obtained from Excel is indicated as follows.
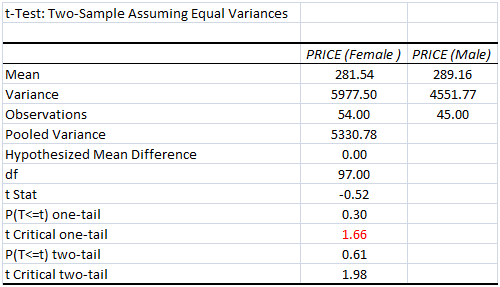
Conclusion: Since the computed test statistic (-0.52) is greater than -1.66, therefore there is no rejection of null hypothesis. Hence, it can be concluded that there is no significant difference in the average prices of male and female shoes.
Question 2
The scatter with production cost as the independent variable and price as the dependent variable is indicated as follows.
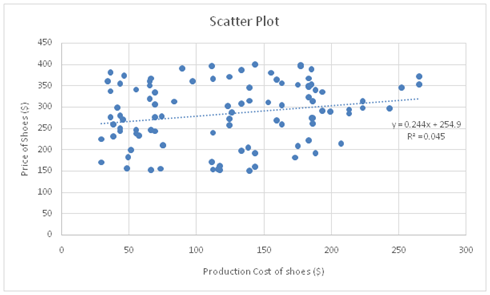
As the trend line is upward trending, hence it can be concluded that there is a positive relationship between the given variables. This is not surprising since if the production costs are higher, it would exert an upward pressure on prices in order to maintain the profit margins. However, the relationship between the variables seems to be weak in strength as points are significantly away from the best fit line. This would indicate that there are other independent factors other than shoe production cost which have a key impact on the shoe price in the given markets.
General Conclusion
There are key differences (i.e. gender and price) in the shoes sold in the three markets (China, Singapore, Thailand) which is apparent from the sample data descriptive statistics. It may be therefore recommended that expansion of the company into any of the given three markets should be done after due consideration to the specific factors which impact consumer preference with regards to shoes. Further, it can be concluded in the statistics assignment that there is no significant difference between the female shoe price and male show price in the three markets. Additionally, there is a positive but weak association between shoe production costs and shoe sale price.
One of major limitations of the research is that sample may not be representative of the target population since only a tiny fraction of the population was included in the sample owing to which there would be biases which may undermine the generalisation of results obtained above. Hence, it is recommended in this section of statistics assignment that future studies should be carried with a larger sample size so as to better underlying market dynamics of shoe markets.


